




Golden cross trading explained: setups, rules, and examples

In order to confidently capitalise on bullish setups in trading, first you need to master golden cross technical analysis.
The golden cross is a widely followed technical signal , serving as a cornerstone for chartists wanting macro direction. It develops when momentum pushes a faster moving average through a slower baseline, showing a clear transition in underlying supply and demand.
For traders, understanding this indicator is crucial for identifying potential upward trends and making timely market entries. Spotting this shift early lets traders align their capital with sustained momentum rather than battling prevailing headwinds.
What is a golden cross in trading?
The golden cross is a specific chart pattern in technical trading that alerts traders to a major upward shift in long-term momentum. It happens on a price chart when a faster-moving average crosses above a slower-moving average, signaling that recent price action is significantly outperforming historical averages. Traders usually treat this event as a key signal that a long-term bearish phase may be ending, giving way to a sustained bull market across forex, equities, or commodities.
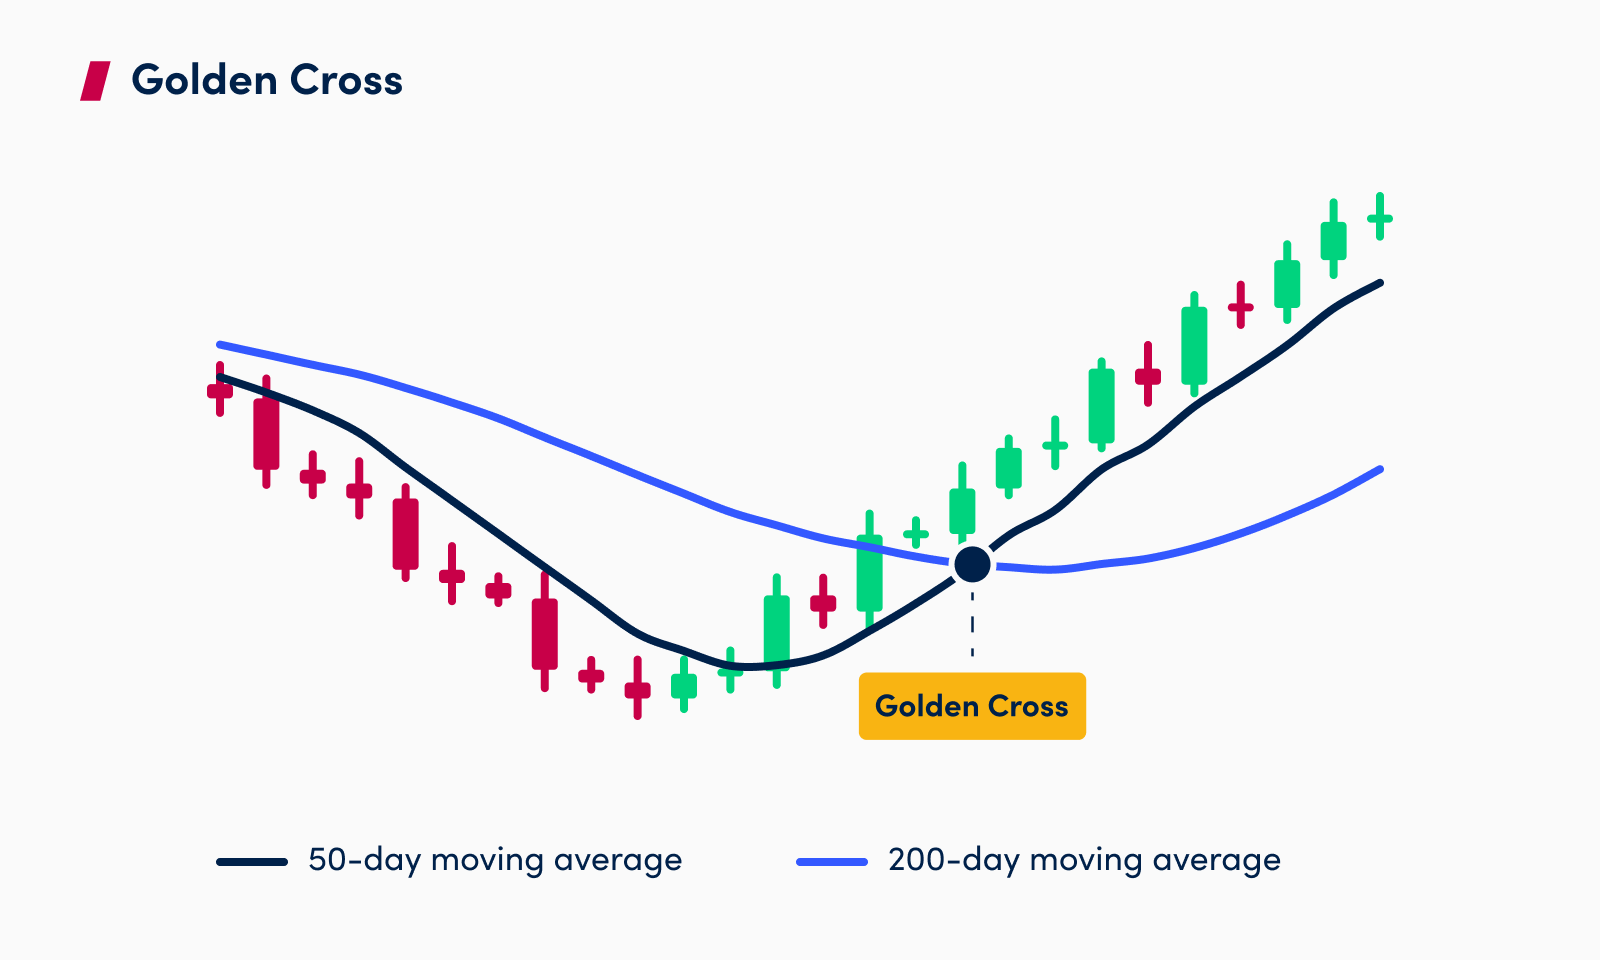
Initially, a golden cross may develop after a downtrend, a period of consolidation, or a correction within a broader uptrend. As buying pressure begins, price action bottoms out and begins to rally, forcing the shorter-term average to curve upward toward the flatter or declining longer-term average.
Once the short-term line intersects and breaks above the long-term line, the golden cross is officially validated, forming a new dynamic support level.
The golden cross relies on the use of moving averages for its identification, utilising smoothed mathematical calculations to cut through market noise and help assess potential changes in trend direction. Moving averages aggregate price data over specific lookback periods to visually display market direction, sentiment, and momentum.
By pairing two distinct moving averages, traders transform raw historical prices into a quantifiable crossover system that provides a rule-based indication of a potentially improving price trend.
Understanding moving averages
Moving averages are fundamental technical tools that smooth out price action by calculating a dynamic average price over a set period, helping traders filter out temporary market noise to identify underlying trend direction.
Explore more here in our moving average crossover guide.
Shorter-term moving average
This moving average is a key element in the crossing action that defines the golden cross pattern, and is usually calculated over a period of 50 days to track the intermediate price trend while responding faster than the 200-day average.
Its interaction with a longer-term moving average is central to both golden and death cross definitions, serving as the fast-reacting line that signals shifting momentum when it ascends or descends across the slower baseline.
Longer-term moving average
This moving average acts as the baseline against the shorter-term moving average crosses, usually calculated over a 200 day window to represent the macro trend and major institutional valuation.
The golden cross pattern formation
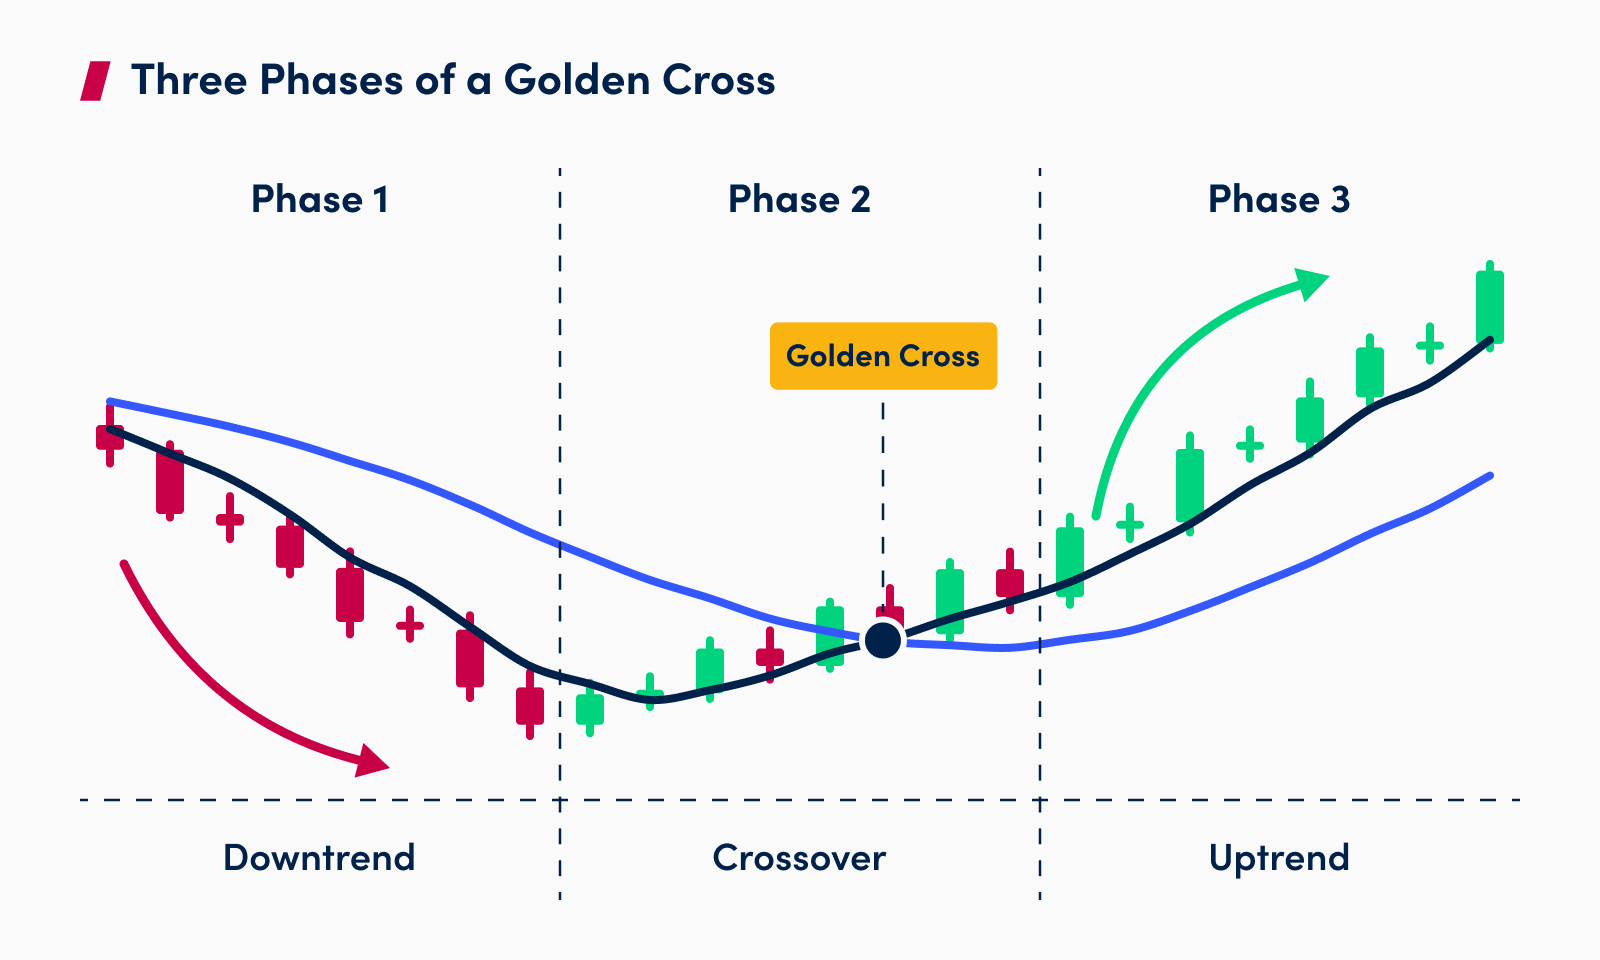
The formation of a golden cross specifically involves the shorter-term moving average crossing above the longer-term moving average on a price chart, marking a technical shift where short-term momentum overtakes long-term price memory. This intersection usually follows a extended period of consolidation or accumulation, showing that buying interest is actively absorbing selling pressure and accelerating upward.
This crossing event is a core mechanic of the golden cross definition, serving as the structural milestone that separates a bottoming phase from a potentially improving trend. Technical analysts wait for the exact moment the fast line pierces the slow line to confirm that the balance of market power has shifted from bears to bulls.
The pattern formation signals a bullish market indicator that alerts institutional and retail traders alike to prepare for potential long positions.
Golden cross as a bullish signal
The golden cross formation indicates a strong bullish signal in the market, often attracting systematic and algorithmic buying power once the technical breakout is recognised. This sudden influx of volume can accelerate price appreciation as traders buy the newly established trend.
This signal is utilised as a foundational element within a golden cross trading strategy, helping traders establish clear entry points, set stop-loss levels below recent swing lows, and manage risk systematically. By trading in the direction of the crossover, investors align themselves with prevailing institutional capital flows.
It contrasts with its bearish counterpart, the death cross definition, which happens when the short-term moving average crosses below the long-term moving average. While the golden cross signals optimism and potential multi-month rallies, the death cross warns of accelerating downside pressure and potential bear market conditions.
Golden cross as a trading strategy
A golden cross trading strategy applies directly to the concept of golden cross trading by transforming a simple chart signal into an actionable, rule-based execution system. Rather than buying blindly the moment the crossover happens, a refined strategy incorporates secondary validation tools. This multi-layered approach helps traders avoid false breakouts and align entries with real institutional momentum.
Golden cross in stock trading
Golden cross analysis is a specific application within stock trading used extensively by equity investors to spot individual stock breakouts or broader index turnarounds. When major benchmarks like the S&P 500 form a golden cross, it often sparks broad market rallies and boosts overall risk-on sentiment among institutional fund managers.A golden cross on a major benchmark may be interpreted as evidence of an improving trend, although it does not establish that further gains will follow.
Traders use this pattern to identify potential upward trends in individual stocks or broader markets, filtering for equities that demonstrate strong fundamentals alongside their technical breakouts. Capturing these crossovers on daily or weekly charts allows stock investors to hold positions over several months to maximise capital appreciation.
Golden cross in day trading
The golden cross can also be applied as a specific strategy in day trading, where active traders adapt the pattern to intraday charts like 5-minute or 15-minute timeframes.
Day traders use this pattern on shorter time frames to capture intraday bullish momentum, aiming to gain quick price runs driven by sudden volume spikes or news catalysts. While intraday crossovers happen far more frequently, they require tight stop-loss management to protect against noise and false signals.
Explore day trading here.
Golden cross vs. death cross
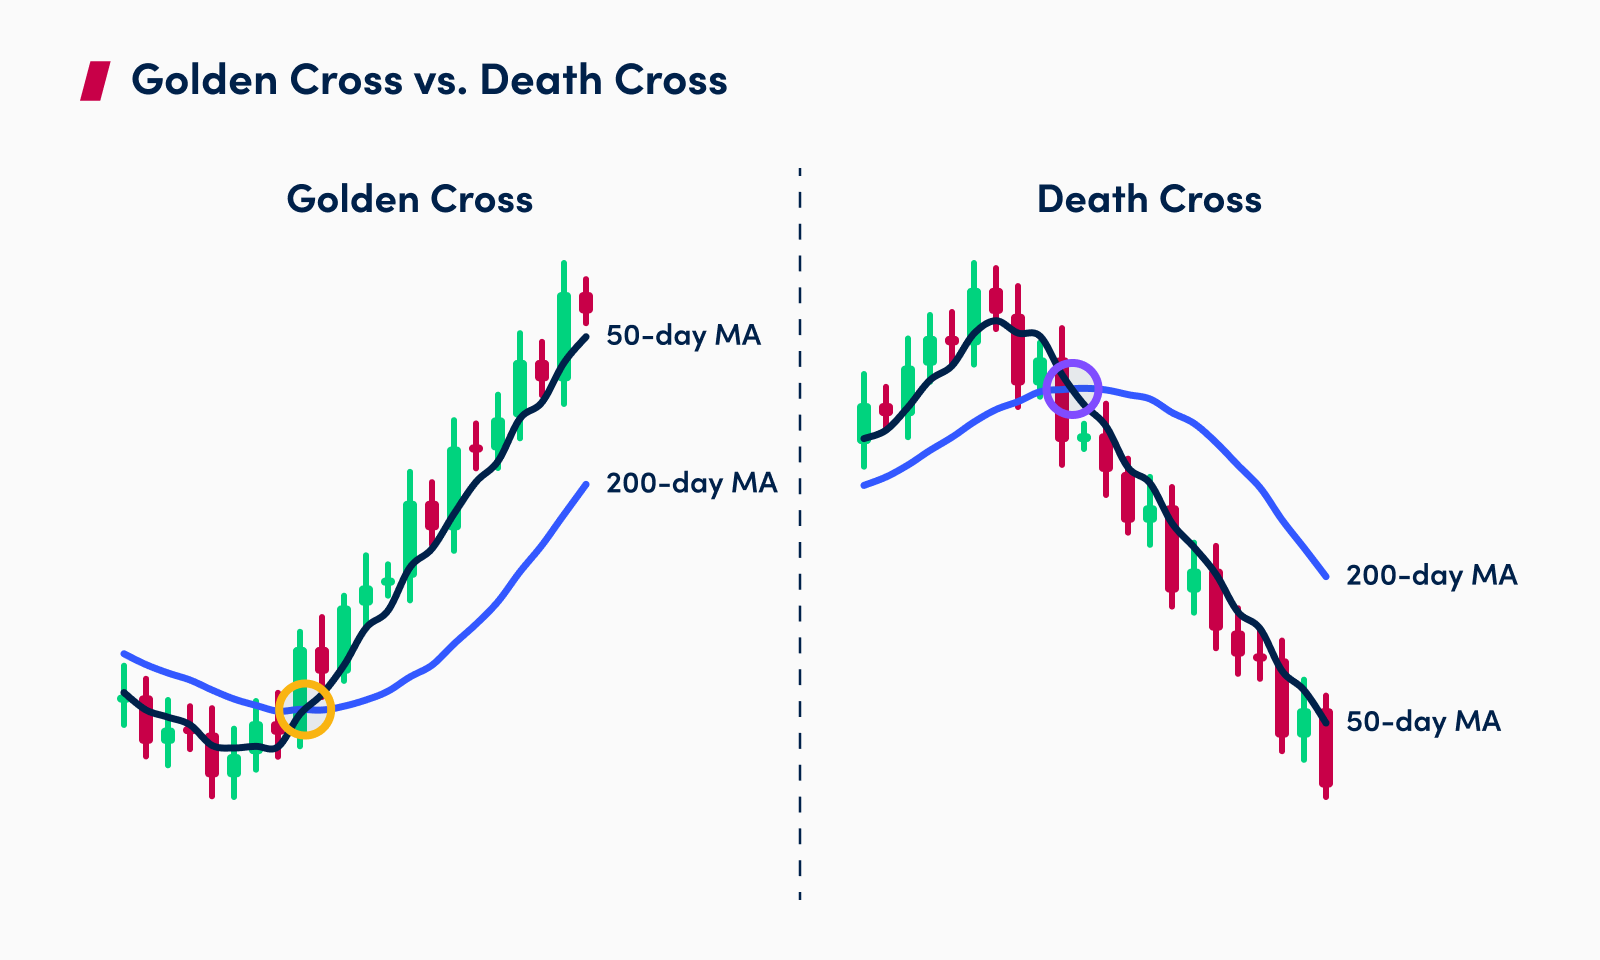
The death cross directly compares and contrasts with the golden cross definition, standing as its exact technical opposite on market charts. Where the golden cross signifies the potential beginning of a sustained bull market, the death cross serves as an early warning indicator that a market may be entering a prolonged structural decline or bear market phase.
Similar to the golden cross, the death cross involves the crossing of a shorter-term moving average below a longer-term moving average, but the directional trajectory is reversed, reflecting rapid downside price velocity that pulls the short-term line down through long-term support.
The limitations of the golden cross
It's important to acknowledge that there are specific limitations in relying only on the golden cross for market analysis. Because moving averages are built on historical price data, the golden cross is considered a lagging indicator. By the time the 50-day moving average successfully crosses above the 200-day moving average, a significant portion of the initial price rally may have already taken place, meaning that traders may enter after a substantial price advance and remain exposed to a reversal.
The gold cross should be treated as a trend-confirmation tool that should be embedded within a broader trading strategy.
The role of golden cross in technical analysis
Golden cross trading is a fundamental concept deeply embedded within the broader field of technical analysis, serving as a classic benchmark for trend-following methodologies. It provides a clean, visual representation of momentum shifting over time, making it a foundational lesson for chartists studying market structure.
Conclusion
The primary aim of understanding the golden cross is to support informed trading decisions by giving traders an objective, trend-following signal. By recognising when short-term momentum overtakes long-term averages, traders can gain valuable insight into potential trend reversals and market strength across various timeframes.
A well-formulated golden cross trading strategy specifically helps traders in making these decisions by establishing clear, rule-based execution parameters. Pairing the initial signal with risk management protocols, like trailing stop-losses, volume confirmation, and key support levels,combining the signal with position sizing and predefined exit rules can help traders manage risk, but does not eliminate the possibility of losses.
Combining the golden cross with technical tools like momentum oscillators or macro fundamental context transforms a simple moving average crossover into a disciplined trading framework.
FAQ
- How does the golden cross pattern specifically form with moving averages?
The golden cross pattern forms when a shorter-term moving average crosses above a longer-term moving average. This specific interaction of the two different moving averages is what defines the pattern and signals potential upward momentum.
- What is the main difference between a golden cross and a death cross?
The primary difference lies in the direction of the moving average crossover and the signal it provides. A golden cross indicates a bullish signal when the shorter-term average crosses above the longer-term, while a death cross signifies a bearish signal when the shorter-term average crosses below the longer-term average.
- Can the golden cross strategy be used across different trading styles?
Yes, it can be applied in traditional stock trading to identify broader trends and is also utilised in day trading on shorter time frames to capture intraday bullish movements.
- What should a trader be aware of regarding the limitations of the golden cross?
Traders should understand that the golden cross, like any technical indicator, has limitations. It's often a lagging indicator and can sometimes generate false signals.
The content here is for educational and informational purposes only. This material is not investment advice or a recommendation or suggestion of any investment strategy, and it does not provide investment advisory services. OANDA is not responsible for any investment decisions made based on this content. Investing involves the risk of a loss of capital. Past performance does not guarantee future results.
Latest blog posts:


Start trading now with fast account opening.
Sign-up now to trade the most active markets
Open account

