




NVIDIA Q3 earnings preview: Record expectations, rising risk & management stability

NVIDIA heads into its fiscal Q3 2027 earnings release with expectations of around $109 billion in revenue. Margins, cash generation, AI spending and an investigation involving CEO Jensen Huang will shape investor sentiment.
Key takeaways
- The US Dollar Index remains technically supported after retesting its 50-day moving average and reclaiming 101.80 despite softer yields and Fed repricing.
- AUD/USD, NZD/USD, EUR/USD and GBP/USD retain potential bearish technical structures.
- CHF/JPY is the main bullish cross, with a breakout above its 50-day moving average and stronger RSI momentum.
Five FX pairs you should be watching in November and why.
Democrats won both chambers in the 3 November 2026 US midterms, setting up divided government when the new Congress convenes on 3 January 2027.
The dollar initially fell, then drew haven demand as AI infrastructure and semiconductor stocks sold off on Thursday, 5 November 2026; the two-year US Treasury yields dropped 13 basis points for the week as of 6 November to 4.46% at the time of writing, breaking below the 50-day moving average, and the December Fed rate hike odds fell to about 70%, from around 80% on Wednesday, according to the CME FedWatch tool (see Fig. 1).
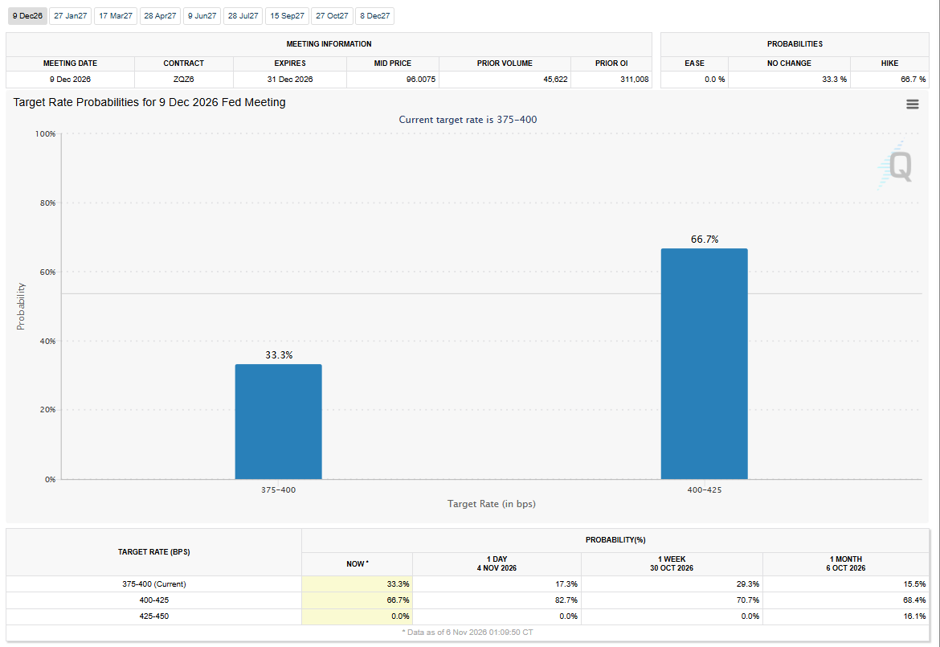
US Dollar Index remains on support
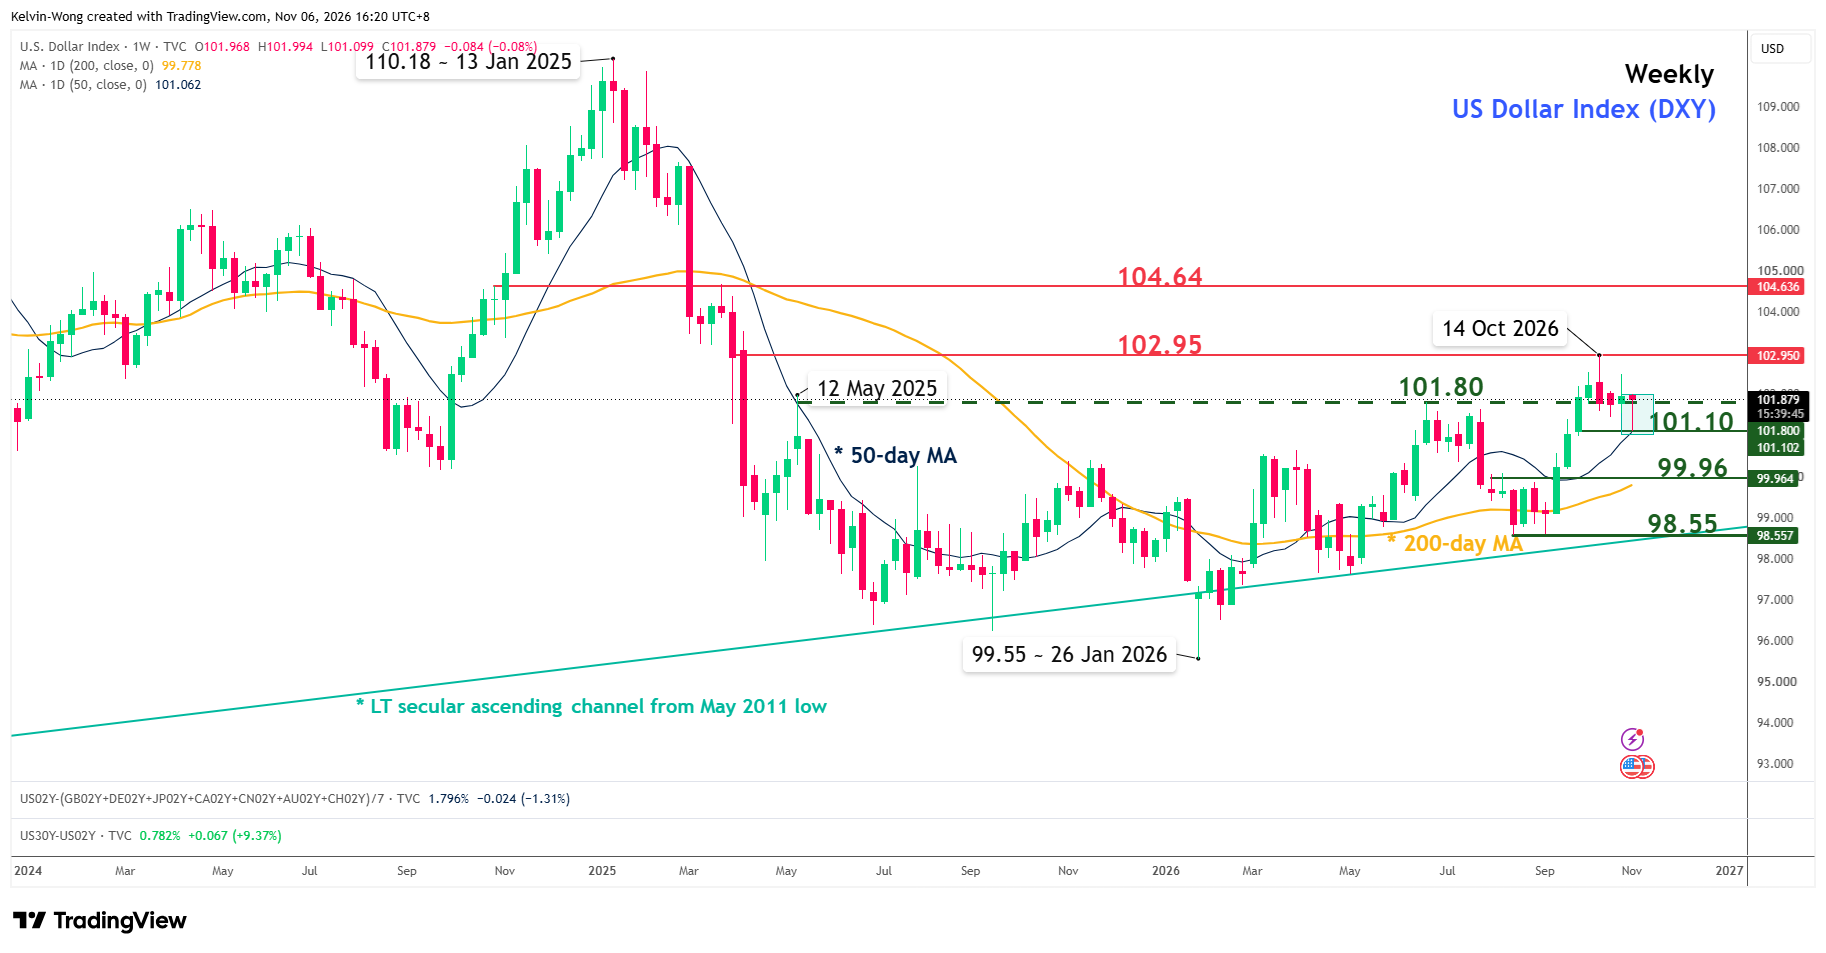
After a brief three-week pullback of 1.8% from the 52-week high of 102.95, the US Dollar Index retested the rising 50-day moving average, reintegrated back above a key major pullback support at 101.80 and formed an impending weekly bullish reversal “Hammer” candlestick pattern at the time of writing (see Fig. 2).
These observations suggest that a major bullish breakout scenario, detected during the week of 28 September 2026, from its prior 12-month range configuration remains intact.
Right now, let’s focus on 4 major USD pairs and a cross pair from a technical analysis perspective.
AUD/USD – Major bearish “Double Top” in motion
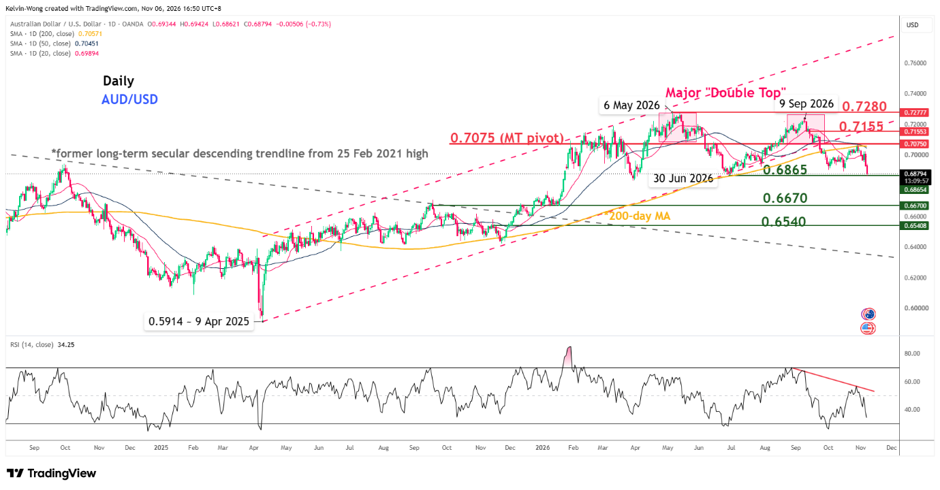
After AUD/USD failed to break above its current 52-week high of 0.7278 on 9 September 2026, its recent price action has formed a potential major bearish “Double Top” pattern (see Fig. 3).
In addition, AUD/USD has broken below the key 200-day moving average, with ongoing bearish momentum evident in its daily RSI.
Watch the 0.6865 neckline support of the “Double Top”; a bearish breakdown with a daily close below it exposes the next medium-term supports at 0.6670 and 0.6540.
However, a daily close above 0.7075 (also the 200-day moving average) puts the next medium-term resistance at 0.7155 in the first step.
NZD/USD – Medium-term bearish range breakdown below 50-day MA
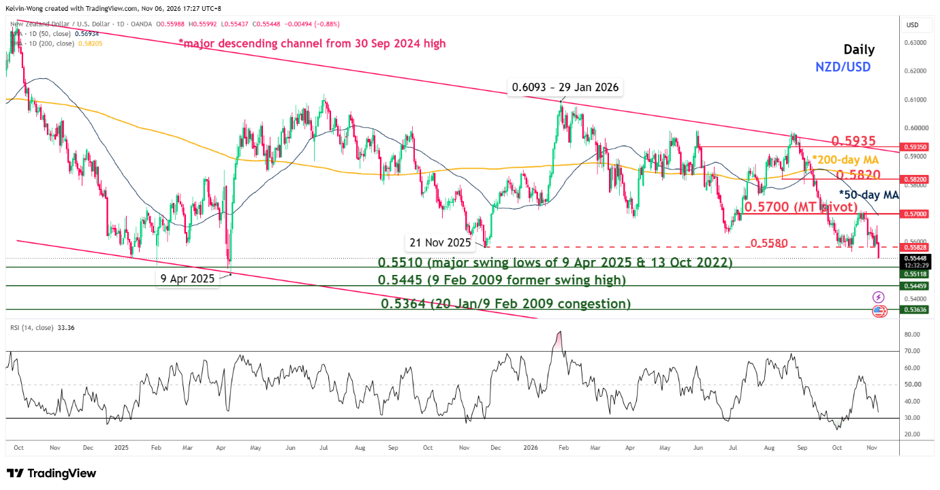
The NZD/USD staged a bearish exit (below 0.5580) on Friday, 6 November 2026, from a medium-term descending triangle range configuration that had been in place since 21 November 2025 (see Fig. 4).
Watch the 0.5700 key medium-term pivotal resistance; the next medium-term supports are at 0.5510, 0.5445, and 0.5364.
On the flip side, a daily close above 0.5700 exposes the next medium-term resistances at 0.5820 (also the 200-day moving average) and 0.5935 (upper boundary of the major descending channel from the 30 September 2024 high).
EUR/USD – Oscillating within a 9-month descending channel
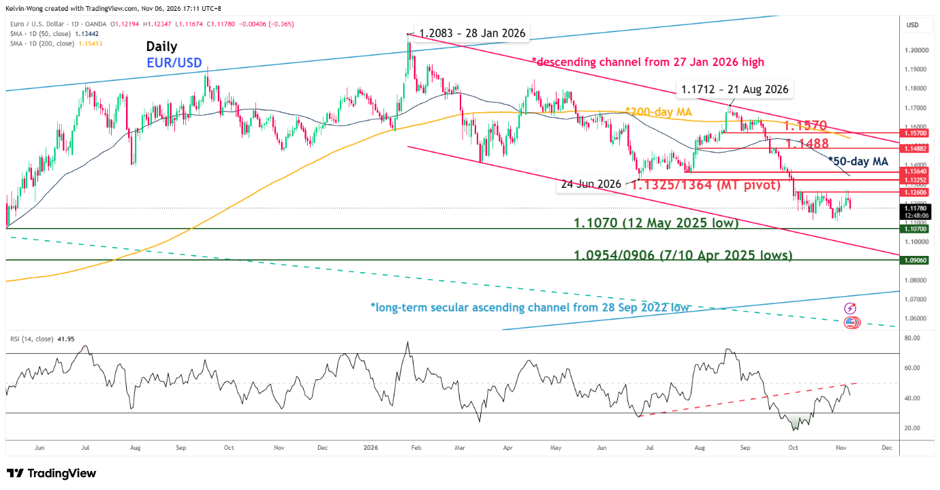
Despite a 3-week sideways movement since 14 October 2026, the broader trend for EUR/USD remains bearish, as price action remains within a medium-term (9-month) descending channel in place since the 28 January 2026 high of 1.2083 (see Fig. 5).
Watch the 1.1325/1364 medium-term pivotal resistance (also the 50-day moving average) on EUR/USD; a break below 1.1070 exposes the next medium-term support at 1.0954/0906.
On the other hand, a daily close above 1.1364, along with a clearance, sees the next medium-term resistances at 1.1488 and 1.1570.
GBP/USD – Bearish reaction at 200-day MA
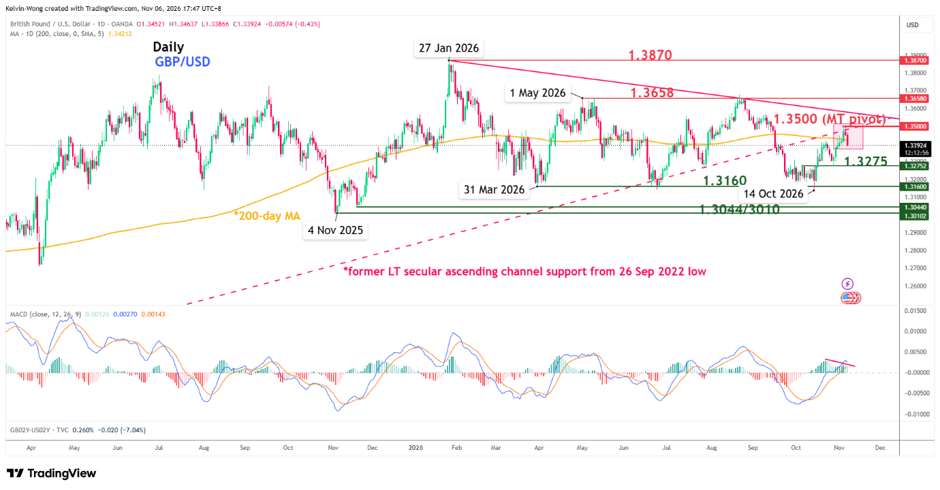
The recent rally of 2.8% seen in GBP/USD from the 14 October 2026 low of 1.3137 has stalled at the key 200-day moving average and the former long-term ascending channel support from the 26 September 2022 low, and staged a bearish reaction on Friday, 6 November 2026 (see Fig. 6).
In addition, the daily MACD Histogram has flashed a bearish divergence, suggesting a potential build-up of medium-term bearish momentum.
Watch the 1.3500 key medium-term pivotal resistance, with the next medium-term supports coming in at 1.3275 and 1.3160 (the range bottom of a medium-term descending triangle range configuration in place since the 27 January 2026 high).
However, a daily close above 1.3500 sees the next medium-term resistance levels at 1.3658 and 1.3870.
CHF/JPY – Bullish reversal from key support zone
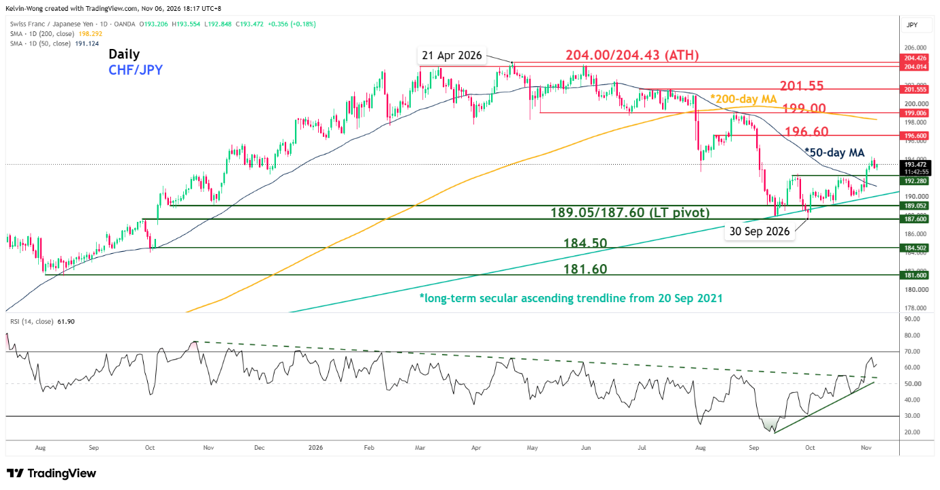
The 5-month decline of 8.2% in the CHF/JPY cross from its current all-time high area of 204.00/204.43, printed on 21 April 2026, stalled on 30 September 2026 at the long-term ascending trendline support, running from the 20 September 2021 low (see Fig. 7).
Recent CHF/JPY prices have staged a bullish breakout above the 50-day moving average, accompanied by a corresponding major bullish breakout in the daily RSI, indicating a potential build-up of medium-term bullish momentum.
Watch the 189.05/187.60 key long-term pivotal support zone, with the medium-term resistances at 196.60 and 199.00 (also the 200-day moving average).
On the other hand, a break and a daily close below 187.60 expose the next medium-term supports at 184.50 and 181.60.
The content here is for educational and informational purposes only. This material is not investment advice or a recommendation or suggestion of any investment strategy, and it does not provide investment advisory services. OANDA is not responsible for any investment decisions made based on this content. Investing involves the risk of a loss of capital. Past performance does not guarantee future results.
Latest blog posts:


Start trading now with fast account opening.
Sign-up now to trade the most active markets
Open account

