







Momentum trading

Momentum trading is a strategy that involves buying assets that are already rising and selling them before the trend reverses. Rather than looking for undervalued bargains, momentum traders ride existing market trends. They use price action, volume, and technical indicators like RSI and MACD to identify opportunities. The strategy can be applied across many liquid markets but carries significant risks, including sharp reversals and false signals. Discipline and risk management are essential.
If you have ever watched a stock surge higher and thought "I wish I had bought that," you already understand the basic appeal of momentum trading. Buy strength, sell weakness. Simple in concept, demanding in execution.
This guide explains what momentum trading is, how it works, the tools you need, and the risks you must manage.
Defining the strategy
Momentum trading is the practice of buying assets that are already rising and selling them as the trend begins to fade. The logic runs counter to traditional value investing. Rather than seeking cheap assets and waiting for the market to recognise their worth, momentum traders seek assets already moving strongly and ride that move for as long as it holds.
The core principle is often summarised as "buy high, sell higher." This is a simplification, not a literal rule, but it captures the mindset well. Think of it like surfing. You wait for a wave, paddle hard to catch it, and ride it until it breaks. Momentum trading is the same: identify a strong trend, enter the trade, and exit when momentum shows signs of fading.
This contrasts sharply with a buy-and-hold strategy, where investors purchase assets and hold them through market cycles regardless of short-term price action.
| Aspect | Momentum trading | Buy and hold |
Time horizon | Short to medium term (minutes to weeks) | Long term (years to decades) |
| Focus | Price action and technical indicators | Fundamentals and long-term value |
| Activity | Active, frequent entries and exits | Passive, minimal trading after purchase |
| Risk | Reversal and false signals | Market risk over the long term |
How momentum trading works
Identifying and capitalising on price momentum
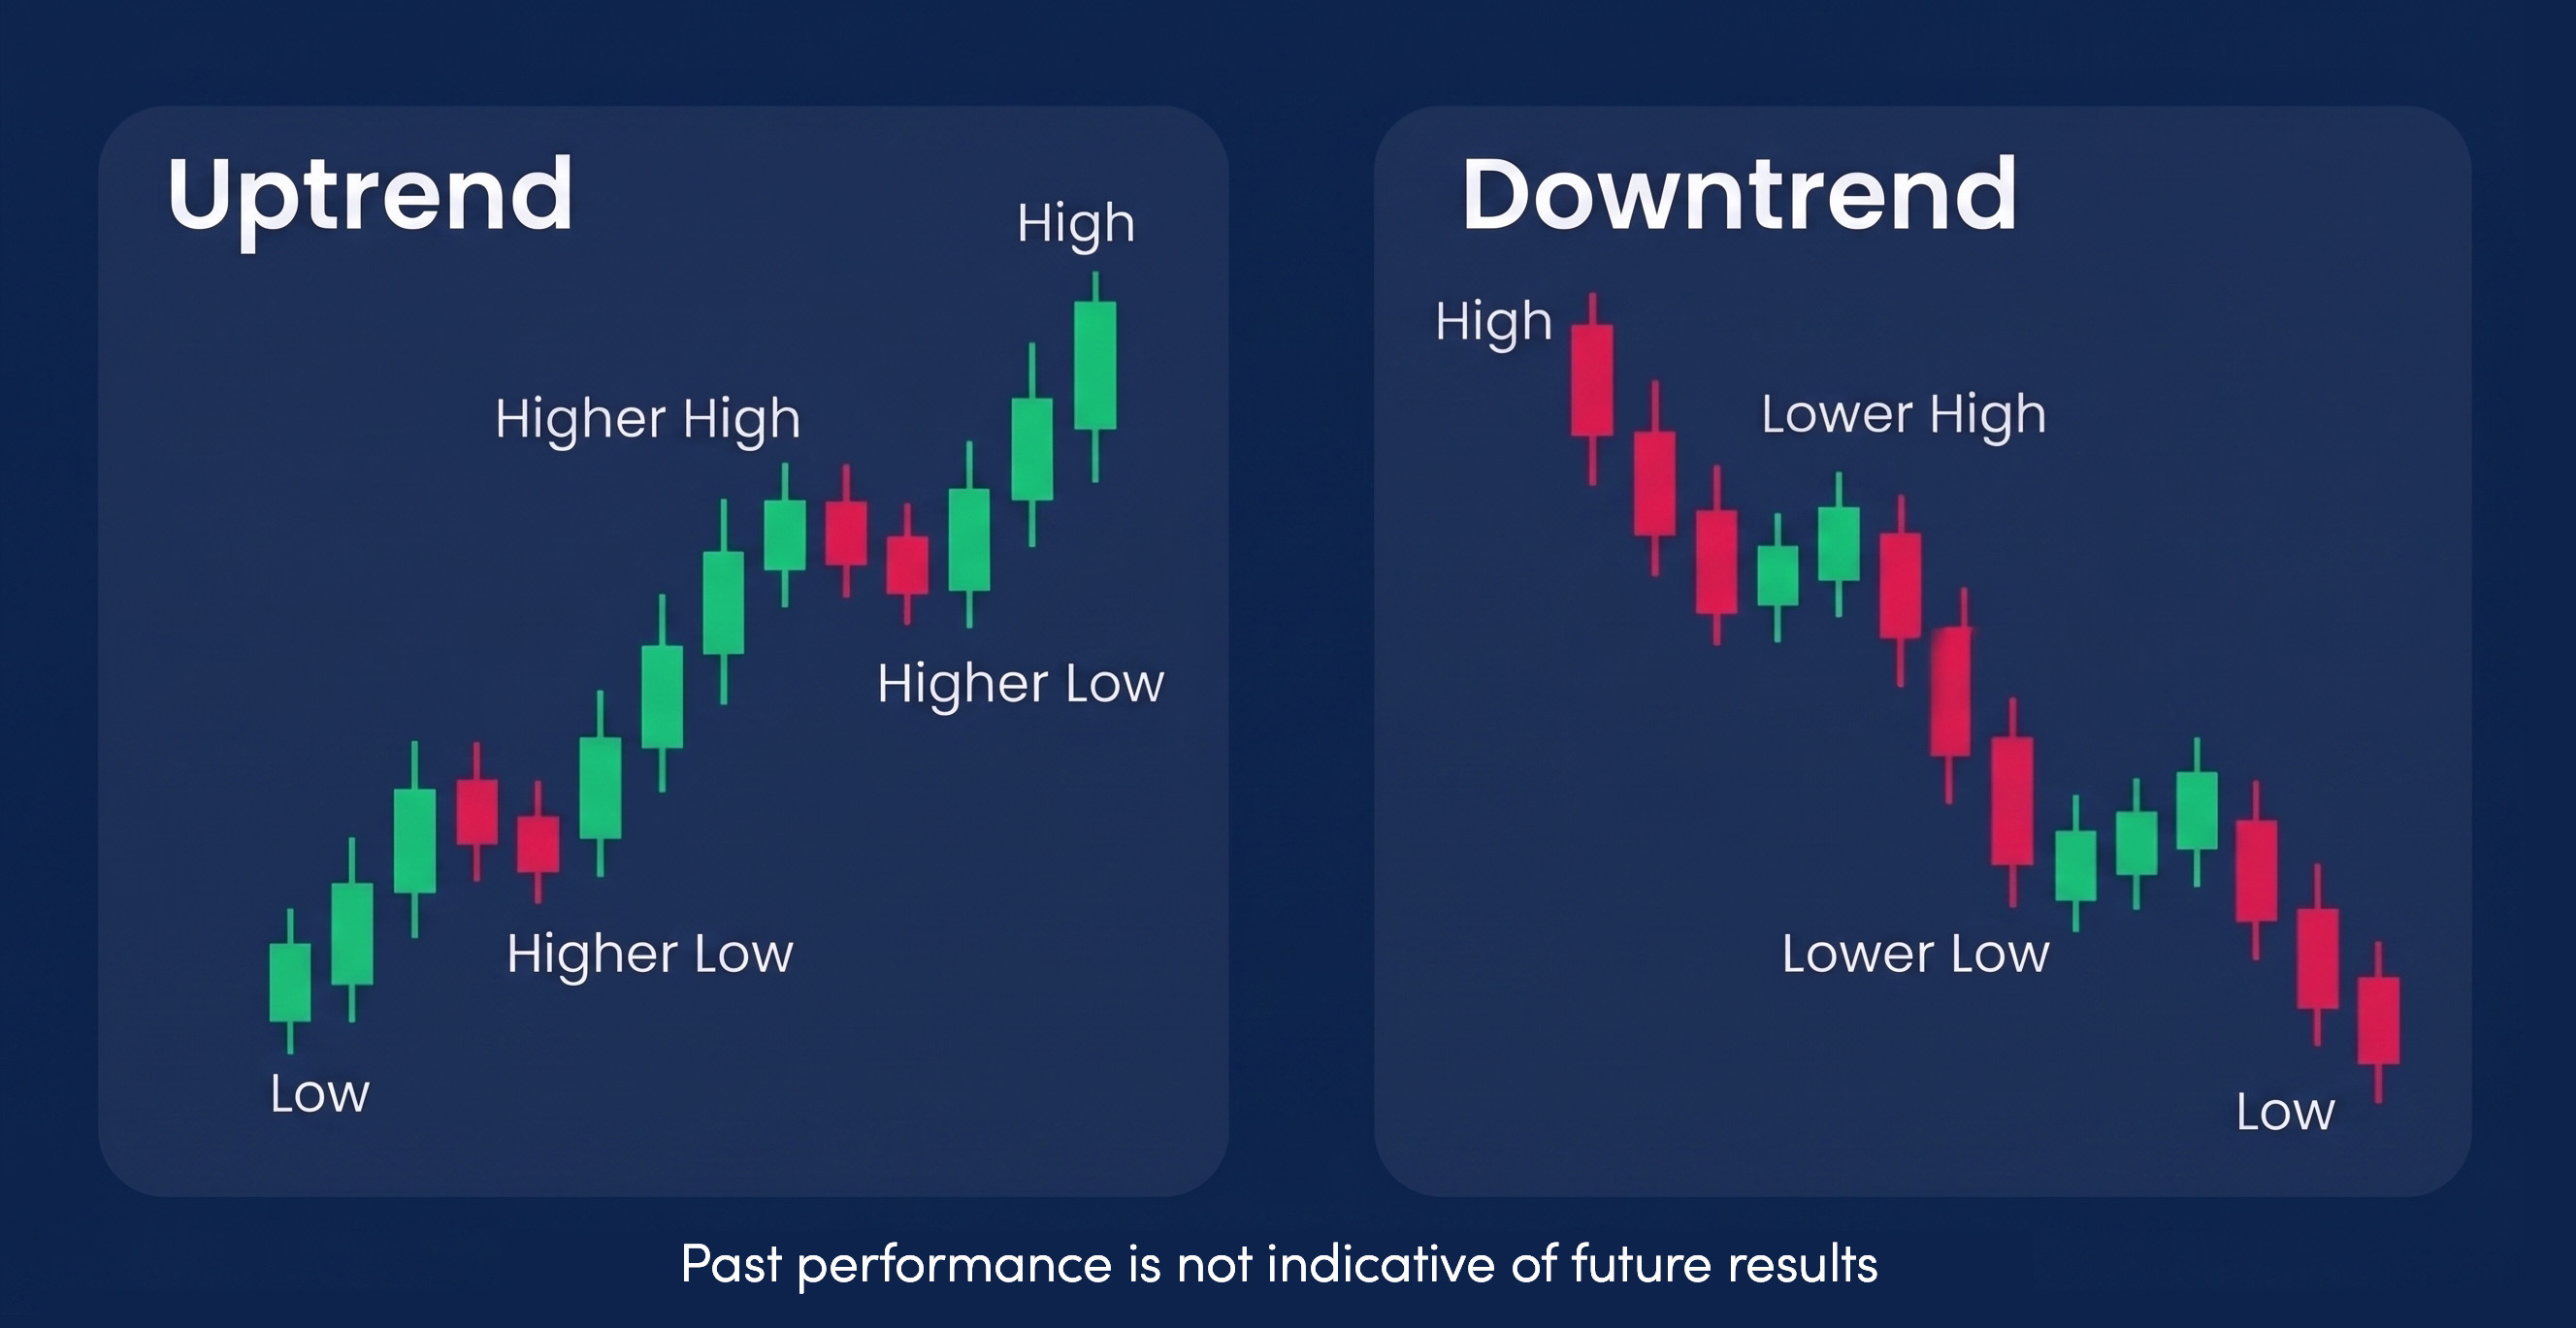
Momentum traders look for assets showing sustained directional movement: consistently higher highs and higher lows in an uptrend, or lower highs and lower lows in a downtrend. The entry is typically after the trend has established itself, once momentum is confirmed rather than at the very beginning of a move.
The exit is equally important. Traders exit when momentum shows signs of fading: a slowdown in price velocity, a reversal signal on an indicator, or a break in trend structure.
Key factors driving momentum
Several forces can initiate and sustain price momentum:
- Fear of missing out (FOMO). When an asset is rising rapidly, traders fear missing profits and jump in, pushing the price higher and reinforcing the trend.
- Earnings surprises and macro events. A company reporting significantly better results than expected can trigger a sustained re-rating. Similarly, interest rate decisions, inflation data, and geopolitical developments can create sustained directional moves across currencies, commodities, and indices- the same catalysts that form the basis of a news trending strategy.
- Sector and thematic narratives. When a powerful theme captures market attention, related assets can move in a sustained, correlated way driven purely by narrative momentum rather than fundamentals. Our guide on investing in Anthropic illustrates how narrative-driven momentum can shape investor behaviour around a theme.
Volume in trading: essential for liquidity
Volume is the confirmation signal in momentum trading. A price move on high volume carries conviction, meaning many participants are backing the direction. A move on thin volume is suspect and more likely to reverse.
Momentum traders watch volume at key moments: the initial breakout, any pullbacks within the trend, and the approach toward target levels. Declining volume as price approaches resistance is often an early warning that the move is running out of energy.
Opportunity and risk
Momentum trading can generate significant returns in a short timeframe when conditions are right. Strong trends, clear catalysts, and liquid markets create ideal environments.
But the risks are equally significant. Trends can reverse suddenly, particularly around unexpected news. Late entries are especially dangerous. The very characteristic that makes momentum trades attractive (fast-moving prices) is what makes them dangerous when direction changes.
Time frame of momentum trades: short-term focus
Time frame | Description |
Day trading | Positions held minutes to hours |
Swing trading | Positions held days to weeks |
Position trading | Positions held weeks to months |
Momentum trades typically require active monitoring. Leaving a position unmonitored is a common and costly mistake.
Momentum trading tools and strategies
Successful momentum trading relies on clear signals to confirm trend strength and timing:
- RSI (Relative Strength Index). RSI measures the speed and magnitude of recent price changes on a scale from 0 to 100. RSI is typically above 50 in a strong uptrend, with the 50 level often acting as a momentum regime divider. Momentum traders look for entries when RSI is rising strongly and exits when it begins to turn.
- MACD (Moving Average Convergence Divergence). MACD tracks the relationship between two moving averages. When the MACD line crosses above the signal line, it can suggest bullish momentum, though the location of the crossover relative to zero and the slope often matter more than the crossover alone.
- Moving averages. Many momentum traders use moving averages such as the 20-day and 50-day exponential moving averages. A stock holding above a rising moving average is often considered to be in an uptrend.
- VWAP (Volume-Weighted Average Price). An intraday indicator showing the average price a security has traded at throughout the day. Intraday momentum traders often look for assets to hold above VWAP during an uptrend. A dip to VWAP that finds support can be an entry signal.
For traders looking to systematise these approaches, algorithmic trading offers a way to automate entry and exit signals based on momentum indicators, removing emotion from the process.
Three common momentum setups:
- Breakout trading. Buy when price breaks above a key resistance level on high volume. Place the stop-loss below the breakout level.
- Pullback momentum (VWAP reclaim). The asset pulls back to VWAP during an intraday uptrend. Enter when price bounces off VWAP. Stop-loss sits just below VWAP.
- Flag pattern breakout. After a sharp price run, the asset consolidates on lower volume, forming a flag. Enter when price breaks above the flag's high. Stop-loss below the flag's low.
Risk management
Momentum trading without risk management is speculation.
- Always use stop-losses. Momentum can reverse without warning. Place stops below key support for longs, above resistance for shorts.
- Size positions appropriately. Risking around 1% to 2% of capital per trade is a commonly cited guideline to help keep losses manageable, though the right amount depends on your individual circumstances.
- Avoid chasing extended moves. Entering after a large move has already occurred significantly worsens the risk-reward ratio.
- Have a clear exit plan. Know your profit target and stop before entering. Momentum trades left unmanaged can turn winners into losers.
Summary
Momentum trading is a short-term, trend-following strategy built on a simple idea: assets that are moving tend to keep moving. It is not a profit formula. Success depends on identifying strong directional trends, confirming them with volume and technical indicators, and exiting when the trend shows signs of fading.
Key takeaways:
- Momentum trading means buying strength and selling weakness
- Volume and volatility are essential for confirming momentum moves
- Use indicators like RSI, MACD, moving averages, and VWAP
- Always use stop-losses and size positions appropriately
- False signals and sudden reversals are constant risks
Open a free demo account to practise momentum trading without risking real capital.
This article is for informational purposes only and does not constitute investment advice or a recommendation. CFDs are complex instruments and carry a high risk of rapid loss of capital due to leverage. Please ensure you understand the risks involved. Past performance is not indicative of future results.
Latest blog posts:


Start trading now with fast account opening.
Sign-up now to trade the most active markets
Open account

