




What is the Wyckoff Method?

Use the Wyckoff Method to read the intent behind market moves to get a clearer view of the market, and become a smarter trader.
The Wyckoff method is one of the most enduring systems of technical analysis in financial markets. By focusing on price action and volume rather than relying solely on lagging indicators, the Wyckoff framework helps traders interpret changes in supply and demand across different market conditions.
Wyckoff method definition
The Wyckoff Method is a comprehensive technical analysis approach that reveals market dynamics by focusing on the interconnected relationship between price movement, trading volume, and time. The Wyckoff Method is a technical analysis approach that examines the relationship between price action, trading volume and market structure over time. Rather than relying solely on mathematical indicators, it uses chart-based observations to assess the balance between supply and demand.
Richard D. Wyckoff, a pioneer of technical analysis, developed this methodology in the early 20th century.
The primary objective of the Wyckoff Method is to explain the underlying causes of price discovery rather than merely reacting to visual effects. Wyckoff analysis dissects the subtle balance between buying and selling forces that precedes major price expansions, meaning that it’s a robust analytical tool for modern financial markets.
Wyckoff Method in trading
The core purpose of the Wyckoff Method is to help traders identify price and volume patterns that may indicate accumulation or distribution by large market participants, often referred to as “smart money”. Large orders can affect market prices, so institutional investors often build or reduce positions gradually. Wyckoff analysis seeks to identify patterns consistent with this activity, although charts alone cannot confirm who is trading or why.
Traders utilise the Wyckoff framework to continuously evaluate the interplay of supply and demand, gauge the internal health of ongoing trends, and assess whether a market is primed for a sudden price expansion. By observing how price behaves during pullbacks and retests, a trader can tell whether supply is depleting or if demand is failing. This continuous assessment prevents traders from entering prematurely into ranges that require further consolidation.
What makes this method exceptional is its universal application across numerous liquid asset classes, ranging from traditional equities and commodities to foreign exchange pairs and digital assets. On platforms tailored for active retail traders like OANDA, Wyckoff principles apply directly to forex currency pairs and index derivatives. Understanding these principles helps traders seamlessly align their execution strategies alongside dominant market forces.
When applying the Wyckoff Method to spot forex, remember that platforms typically display tick volume, which counts price updates rather than the amount traded. Forex has no consolidated market-wide volume feed. Currency futures, by contrast, provide actual traded volume for contracts on the relevant exchange, although this does not represent the entire forex market.
The three fundamental laws
The Wyckoff Method is built on three analytical principles, traditionally referred to as laws: supply and demand, effort versus result, and cause and effect. Traders use these principles to interpret price and volume behaviour and develop scenarios for potential market moves.
1. Law of supply and demand
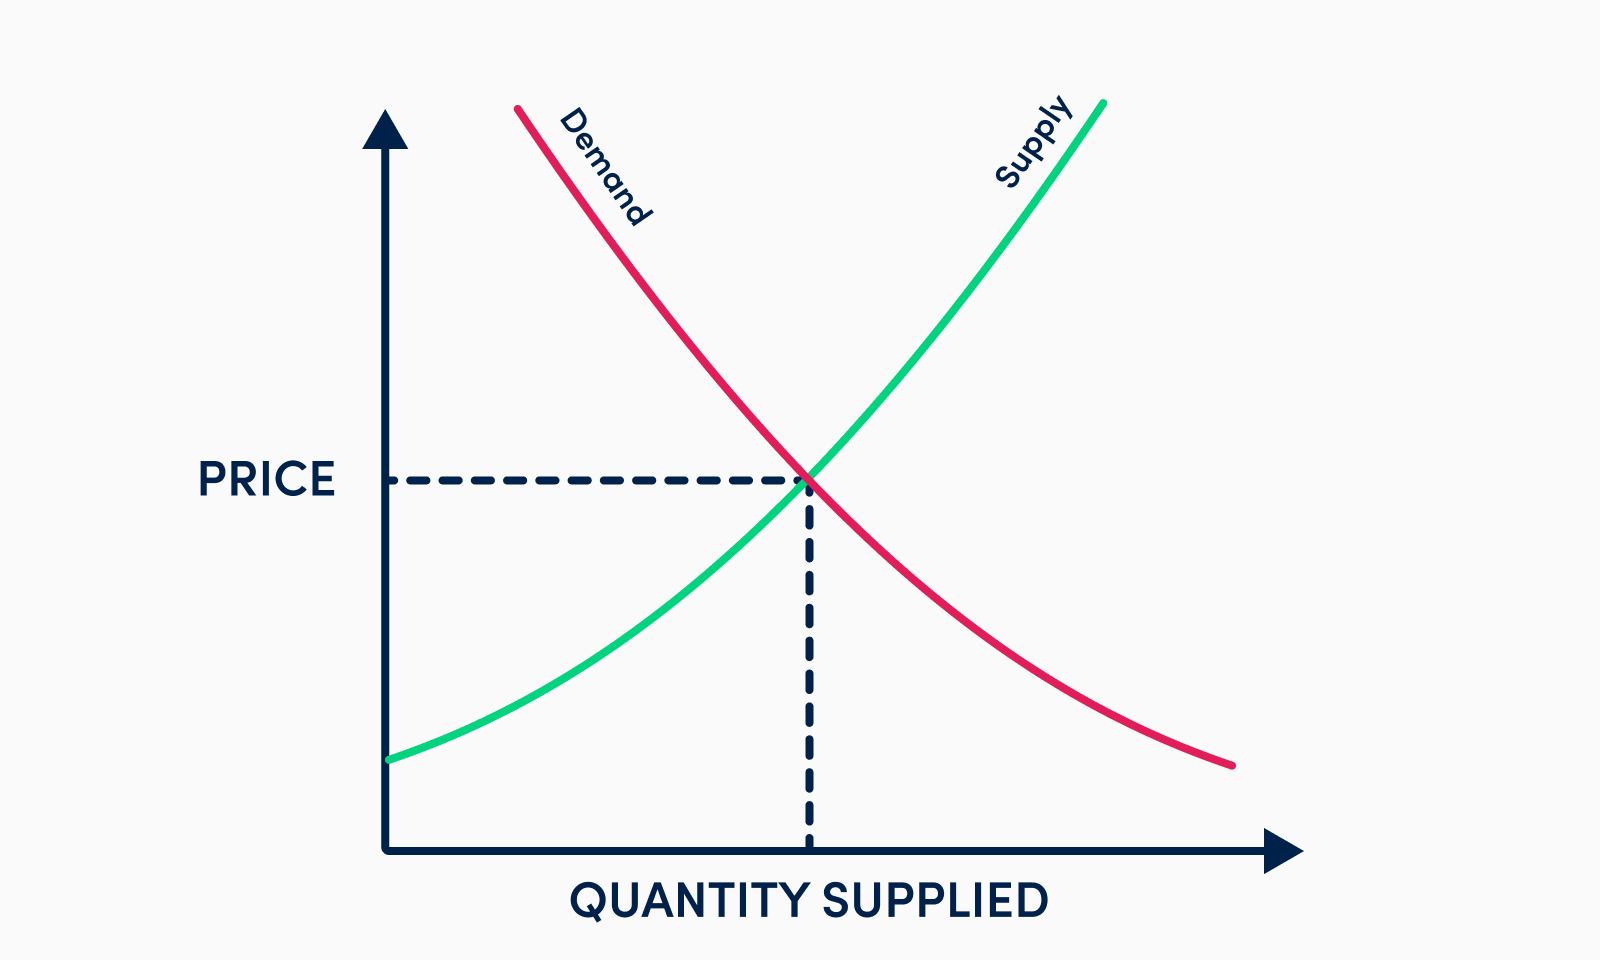
The law of supply and demand links price direction to the balance between buying and selling pressure. Stronger buying pressure tends to push prices higher, while stronger selling pressure tends to push them lower. Traders assess this balance by comparing price movements, the high-to-low range of price bars and trading volume.
2. Law of effort vs. result
The law of effort versus result compares trading volume, representing “effort”, with price movement, representing “result”. High volume accompanied by limited price movement may suggest that opposing orders are absorbing buying or selling pressure. The interpretation depends on the surrounding trend, the location within the trading range and subsequent price action.
3. Law of cause and effect
The law of cause and effect asserts that for a major price move (the effect) to happen, a proportionate period of preparation and position-building (the cause) must precede it. Within the Wyckoff framework, a prolonged period of horizontal price consolidation represents the construction of a "cause," while the subsequent directional trend expansion represents the ultimate "effect." This law highlights that market behavior is rarely accidental, establishing that current price trends are the direct physical consequence of prior institutional preparation.
The Composite Man
To simplify the complex dynamics of financial markets, the Wyckoff Method introduces the concept of the "Composite Man"- a figure that unifies all major institutional players, market makers, and large fund operators into a single, highly strategic entity. Wyckoff advised traders to view all price fluctuations as if they were orchestrated by this single mind. Traders are strongly encouraged to "think like the Composite Man" by analysing every price movement through the perspective of institutional order execution.
Instead of reacting emotionally to sudden price spikes or news headlines, a Wyckoff analyst asks how a large institution with millions of dollars to deploy would position itself without driving market prices against its own execution goals. Traders who study the Composite Man learn to trade in harmony with smart money operations.
Understanding Wyckoff market cycles
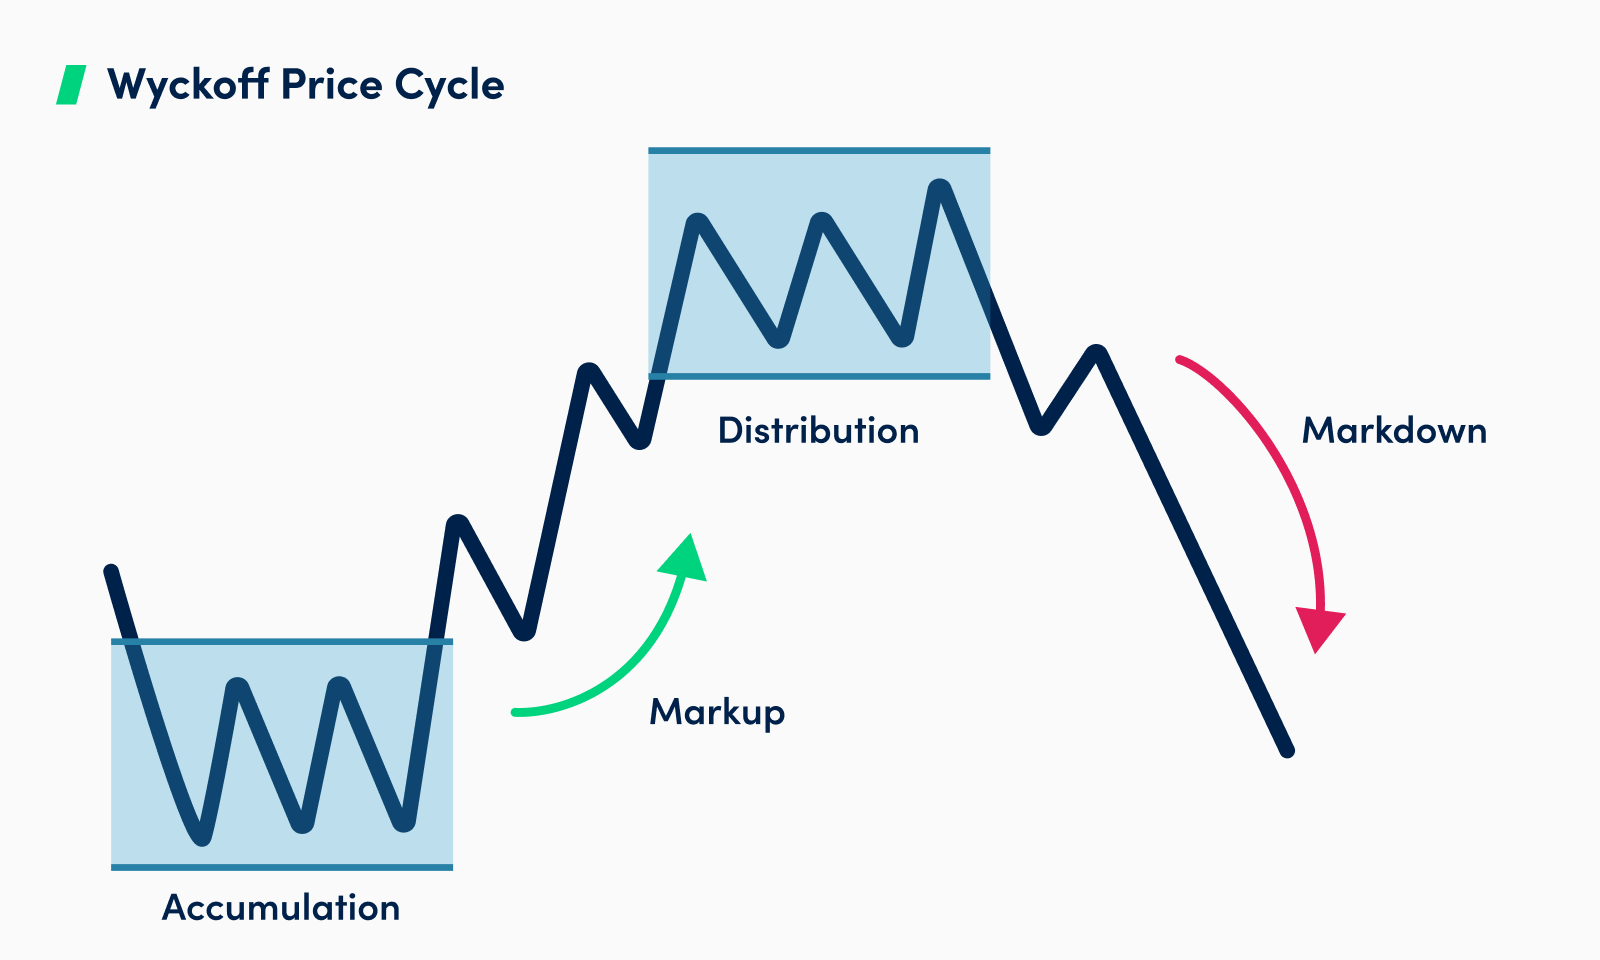
The Wyckoff Method outlines a continuous market cycle that liquid assets routinely progress through, driven primarily by the strategic operations of institutional operators. This continuous cycle consists of four distinct structural phases:
- Accumulation
- Markup
- Distribution
- Markdown
Mastering these four phases lets traders select execution strategies that match the market environment. Instead of applying a single static strategy across all market conditions, a Wyckoff trader shifts seamlessly between range-bound absorption setups during consolidation phases and trend-following breakout executions during active trend expansions.
1. Accumulation phase
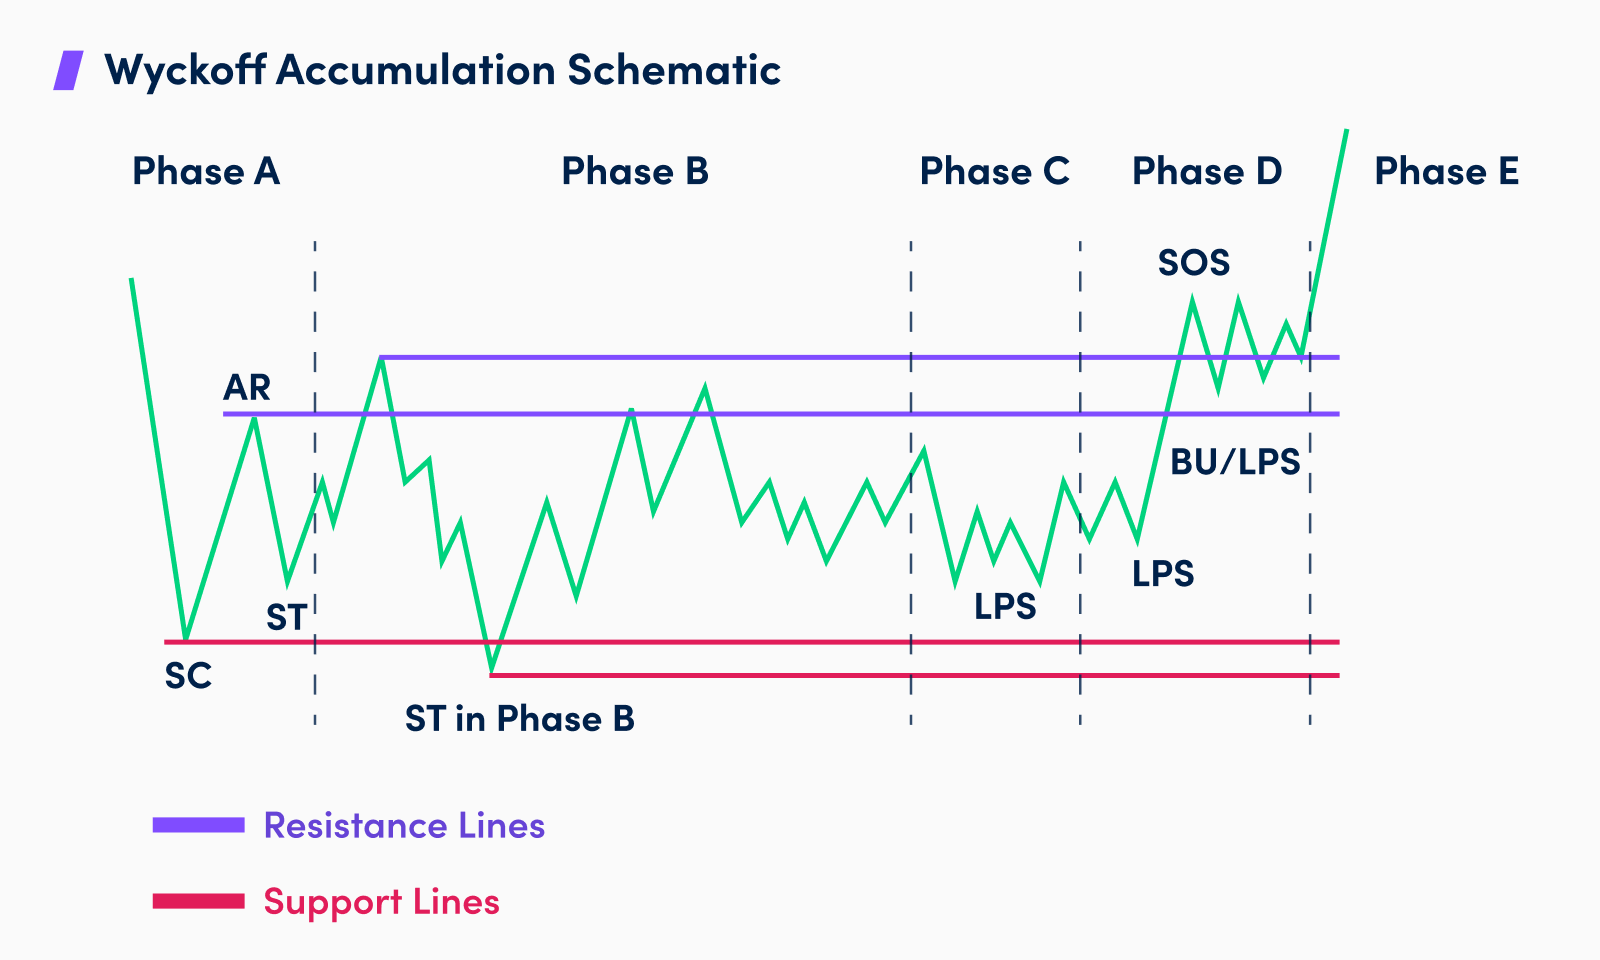
The accumulation phase develops after a prolonged downtrend, during this period, smart money quietly absorbs floating supply from panicked retail sellers who are liquidating positions at depressed valuations. The primary objective for institutional operators during accumulation is to lock in massive position volume at wholesale prices without alerting the broader public. Once available supply is fully absorbed within the range, the market becomes structurally imbalanced toward demand, laying the foundation for the subsequent markup trend.
2. Markup phase
The markup phase begins immediately following the successful completion of an accumulation phase, representing a sustained upward price expansion. During this transition, overall market demand heavily outweighs diminishing floating supply, allowing relatively small buying orders to rapidly propel prices higher through previous resistance zones.
Traders utilising Wyckoff strategies tend to enter long positions during early-stage breakouts or on initial low-volume pullbacks as the market transitions out of accumulation into markup. This approach positions traders alongside institutional momentum with defined risk parameters.
3. Distribution phase
The distribution phase emerges following an extended upward trend, forming the structural range where institutional operators offload their accumulated holdings back to the public. Driven by widespread retail optimism, public demand reaches a peak. Large operators utilise this abundant buying liquidity to sell off massive position blocks without immediately crashing the market price.
Within the Wyckoff framework, this phase is interpreted as a period in which large holders reduce positions into strong demand. If selling pressure gains the upper hand and support fails, a markdown phase may follow.
4. Markdown phase
This phase may feature wider downward price bars, increased volume during declines and weaker corrective rallies, although these characteristics are not present in every downtrend.
Traders using Wyckoff principles aim to leave lingering long positions or initiate short positions as the range transitions from distribution into markdown.Recognising this structural shift may help traders manage downside exposure or assess potential short positions, although false signals and trading losses remain possible.
Practical application of the Wyckoff Method
Applying the Wyckoff Method involves assessing the broader trend, identifying a potential trading range and comparing price behaviour with available volume data. Traders then look for evidence supporting an accumulation or distribution scenario, define an entry trigger and identify the point at which that interpretation would be invalidated. Position sizing, transaction costs and the possibility of a false breakout should be considered before entering a trade.
FAQ
- How does the Composite Man concept help in trading decisions?
The Composite Man concept helps traders analyse market movements from the perspective of large institutional players. By understanding their phases of accumulation and distribution, traders can align their positions with these dominant forces, aiming to buy when institutions are accumulating and sell when they are distributing.
- What are the key differences between accumulation and distribution phases?
Both accumulation and distribution phases involve sideways price action within a trading range. But, accumulation happens after a downtrend as institutions buy to prepare for a markup, while distribution happen after an uptrend as institutions sell to prepare for a markdown. Their internal schematics and volume characteristics also differ.
- Can the Wyckoff Method be used for short-term trading?
Yes, short-term traders can use Wyckoff analysis on intraday charts to identify accumulation or distribution patterns for quick entries and exits.
- Why is volume analysis so critical in the Wyckoff Method?
It represents the "effort" expended by traders. When combined with price action ("result"), it helps reveal the underlying strength or weakness of buying and selling pressure. Divergences between effort and result can signal upcoming changes in trend or market phase.
- What role do Wyckoff schematics play in practical application?
Wyckoff schematics provide visual templates for the events and tests occurring within accumulation and distribution ranges. By recognising these patterns, traders can anticipate market turning points, validate market phases, and identify potential entry and exit points with greater confidence.
The content here is for educational and informational purposes only. This material is not investment advice or a recommendation or suggestion of any investment strategy, and it does not provide investment advisory services. OANDA is not responsible for any investment decisions made based on this content. Investing involves the risk of a loss of capital. Past performance does not guarantee future results.
Latest blog posts:


Start trading now with fast account opening.
Sign-up now to trade the most active markets
Open account

