


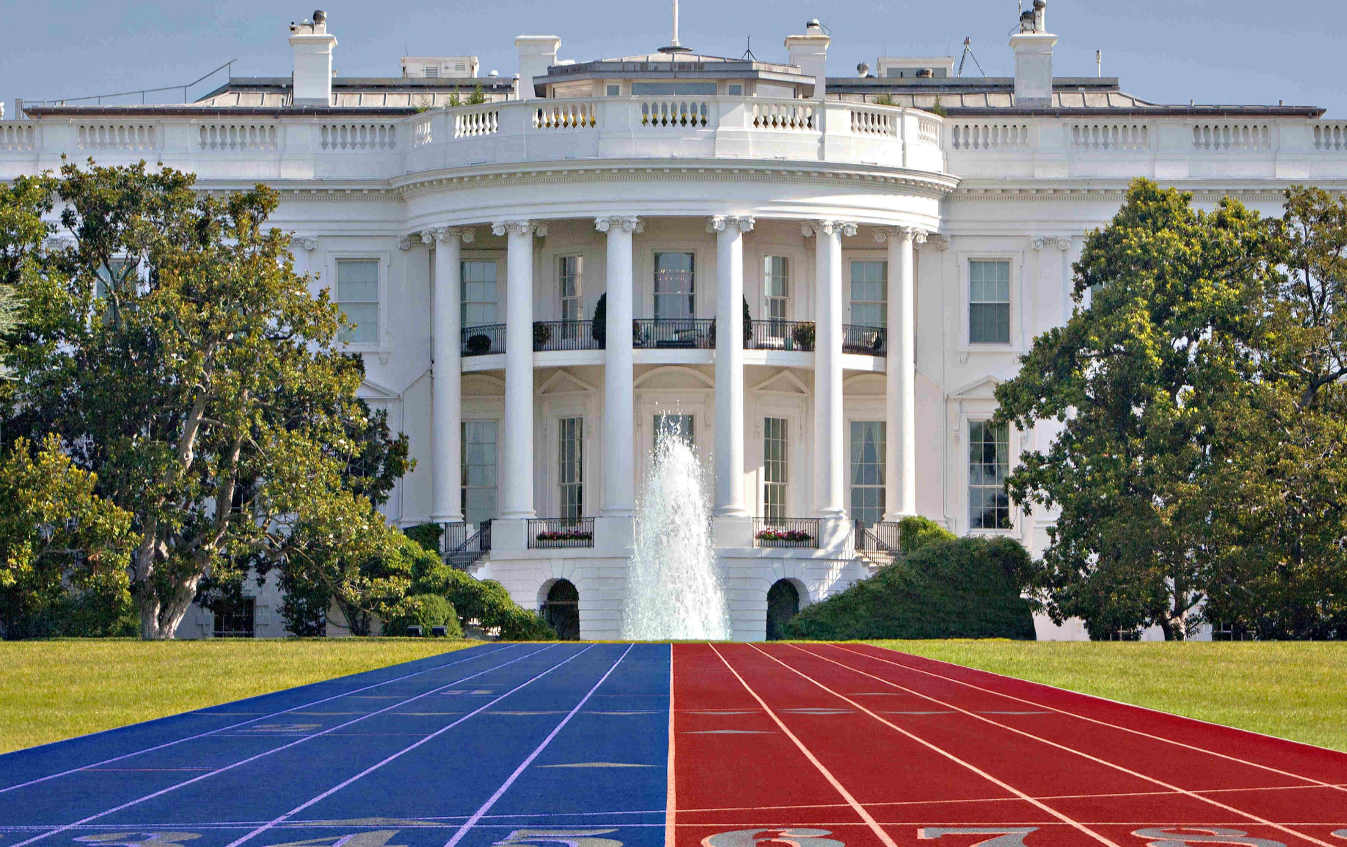

Midterm elections & tariffs: EUR/USD, USD/CAD, and USD/MXN outlook

An in-depth technical analysis and macroeconomic review of major foreign exchange pairs—EUR/USD, USD/CAD, and USD/MXN—as trade policy recalibrations and tariff structures shape market dynamics ahead of the October 2026 U.S. midterm elections.
Key takeaways
- EUR/USD broke below its 1.1280 pivot amid active 15% U.S.–EU baseline tariffs and ongoing metal-duty pressures[1] ahead of the midterms.
- USD/CAD trades near the 1.4250 resistance ceiling as elevated U.S.–Canada sectoral tariffs disrupt bilateral trade flows[2].
- USD/MXN tests support near 16.82 within an inverted Head and Shoulders pattern, reflecting the stabilization of 10–15% tariff rates under Section 122[1].
As the United States approaches the pivotal October 2026 midterm elections, trade policy and potential tariff recalibrations continue to influence cross-border capital flows and market sentiment. However, macro fundamentals—including underlying economic conditions, monetary policy stance, interest rate differentials, and central bank decisions—remain the primary long-term drivers shaping currency exchange rates. While baseline reciprocal rates and trade shifts make for prominent headlines, monetary policy trajectories continue to anchor broader currency valuations. For traders and strategists, these policy shifts interact with compelling technical setups across major pairs, including EUR/USD, USD/CAD, and USD/MXN. Examining key chart formations, momentum indicators, and structural support and resistance levels alongside interest rate expectations provides essential clarity for navigating foreign exchange price action ahead of the vote.
U.S.–Europe trade policy and tariffs
Throughout 2025, U.S. tariff policy toward Europe underwent significant shifts, beginning on April 2 (“Liberation Day”) with an initial 20% reciprocal tariff rate, a 10% baseline for non-EU European nations, and a 25% national security duty on European automobiles and auto parts. Following a 90-day pause in April to facilitate negotiations and a mid-year doubling of Section 232 steel and aluminum tariffs, Washington and Brussels established a bilateral framework in August that settled general U.S. tariffs at 15% (capping duties on pharmaceuticals, semiconductors, and lumber at 15%). Heading into the October 2026 midterms, this 15% baseline framework—supplemented by persistent 50% metal tariffs above quota limits and 25% heavy vehicle duties—remains the active governing structure[1] [3] [4].
EUR/USD monthly chart technical analysis
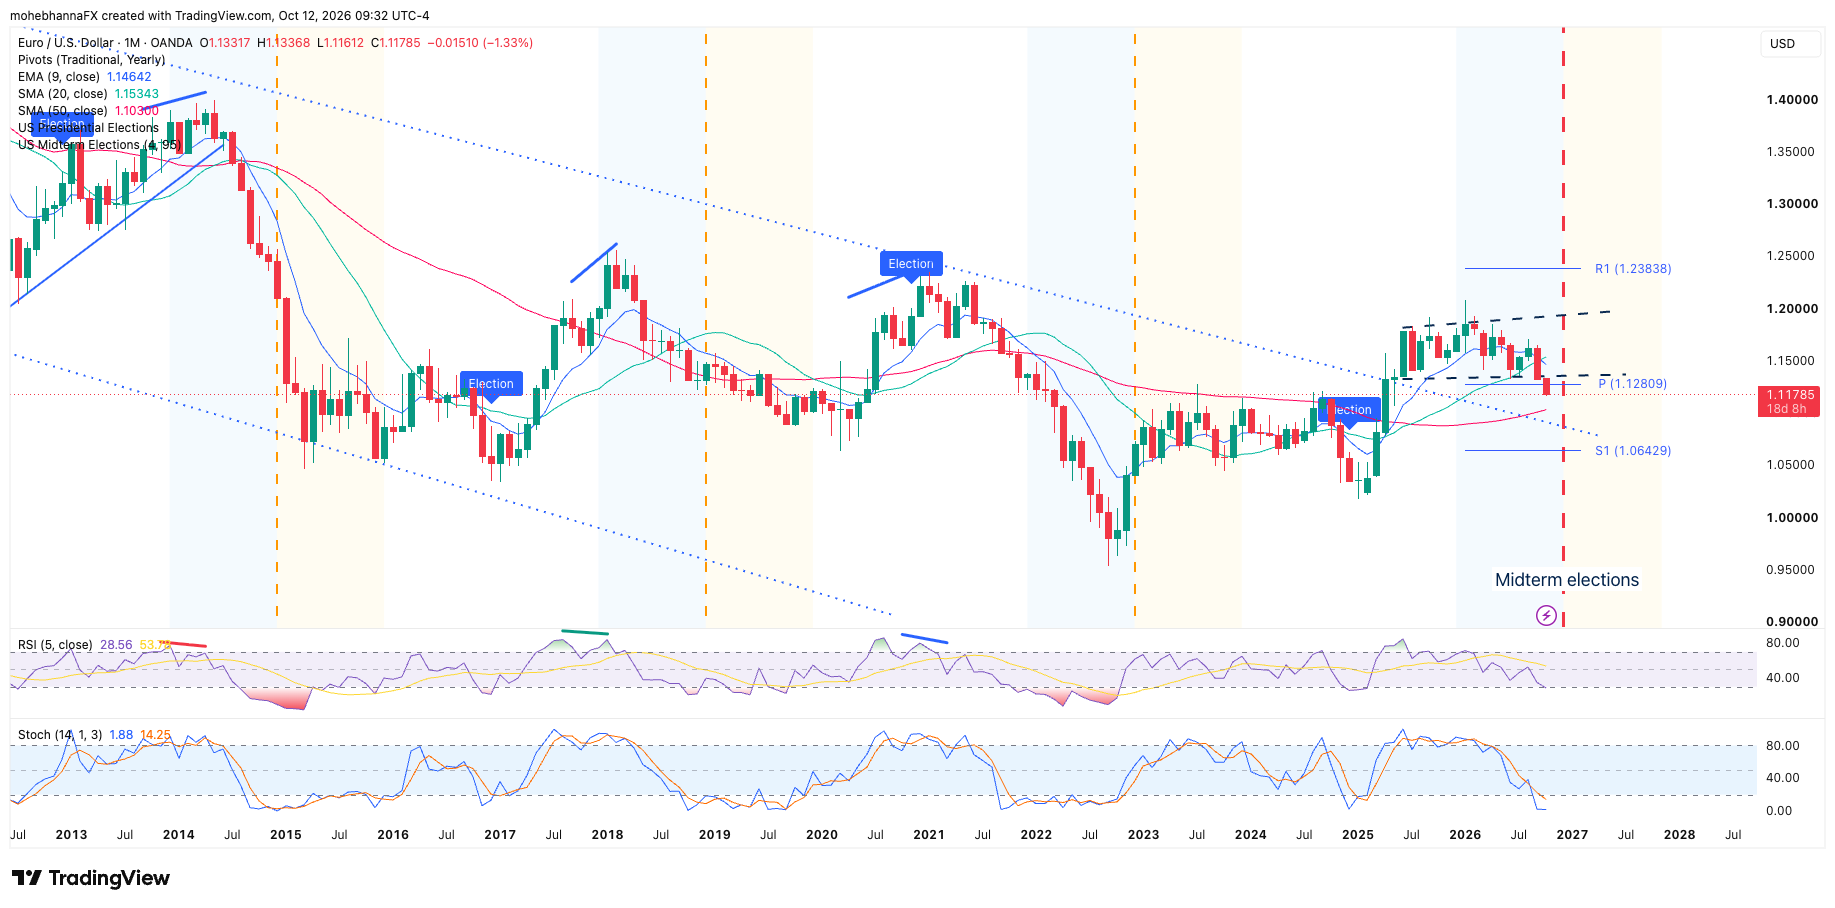
- As of 2008, EUR/USD has been trading within a descending channel, as marked by the downward-sloping dotted blue lines on the chart. In mid-2025, EUR/USD broke above the upper border of the descending channel formation and continued to trade sideways within the range of 1.1280 to 1.1800 as marked by the dashed black lines on the chart.
- This month, October 2026, price action broke below the lower boundary of the sideways price action and the annual pivot point of 1.1280; however, the October monthly close has yet to be determined.
- EURUSD price action broke below its fast and intermediate SMA9 and SMA20. A second intermediate SMA50 represents a dynamic support level below price action near the 1.1000 range.
- Fast RSI 5 is in line with price action and is currently at its oversold levels.
- The stochastic indicator remains in line with price action. The %K line broke below the %D line and is currently below its oversold levels.
U.S.–Canada trade policy and tariffs
Between February 2025 and October 2026, U.S. trade policy toward Canada shifted dramatically from emergency duties to targeted tariffs ranging from 25% to 50% on key sectors such as automobiles, metals, and agricultural goods, following various tariff pauses, national security escalations, Supreme Court rulings, and Section 338 invocations. Heading into the midterms, bilateral trade remains severely depressed as lingering sectoral duties and retaliatory Canadian tariffs largely supersede USMCA preferential terms[1] [3].
USD/CAD monthly chart technical analysis
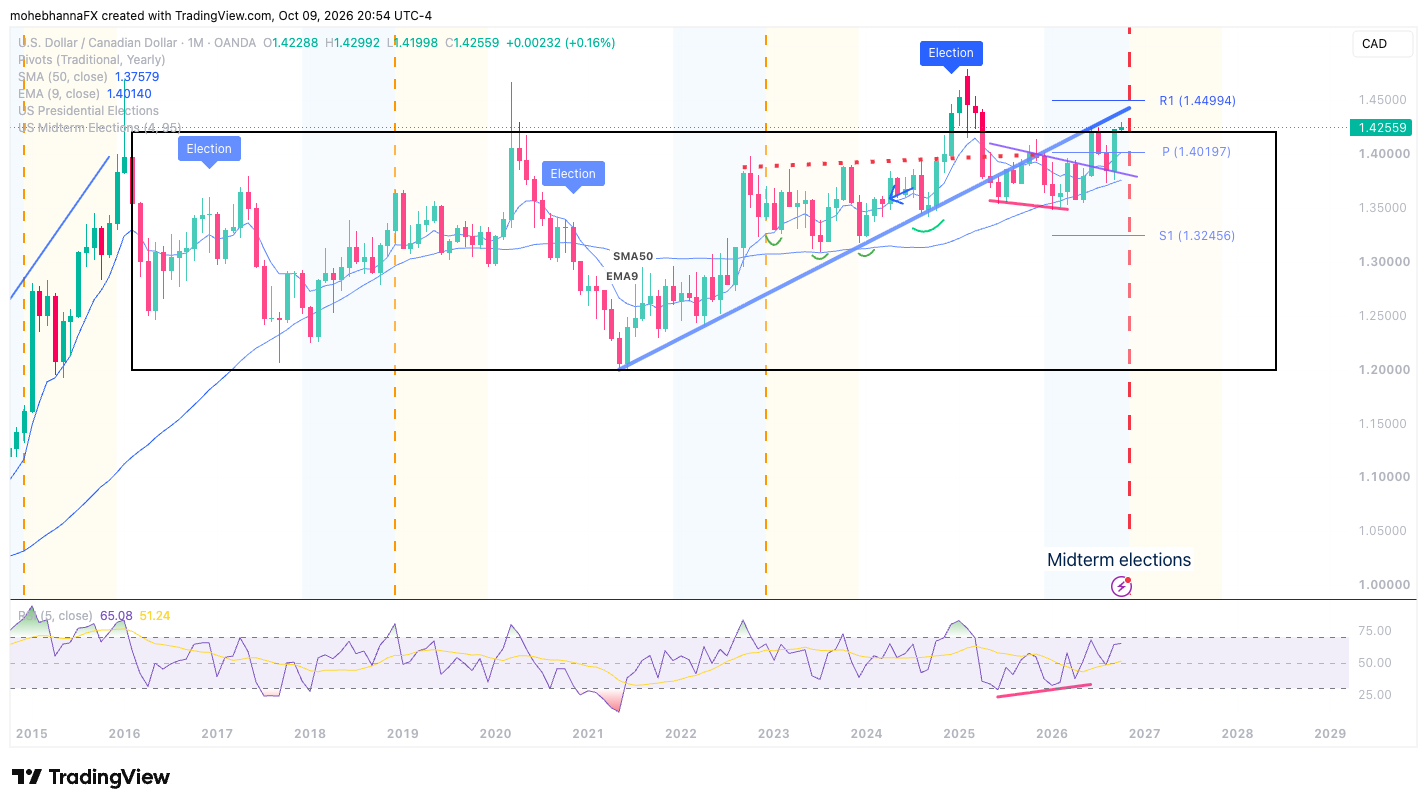
- From 2016 to 2026, USD/CAD traded sideways within the 1.2000-1.4000 range. Price action continued to find support and resistance within the pattern borders, except for the period between the 2024 US elections and the tariffs Liberation Day in April of 2025, as marked by the black-sided rectangle on the chart.
- In May of 2021, price action began an uptrend, as marked by the blue line on the chart. In May of 2025, price action broke below the uptrend and completed multiple pullbacks, finding resistance below the extension of the blue uptrend line. Currently, price action is trading around the upper boundary of the sideways range, near level 1.4250.
- The annual resistance level, R1 1.4499, lies above price action, the same price level seen during the 2024 US presidential election.
- A confluence of support lies below price action, represented by the annual PP of 1.4019, in the intersection with the fast EMA9.
- The lagging RSI 5 remains in line with price action and is currently approaching its overbought level of 70.
U.S.– Mexico trade policy and tariffs
Between February 2025 and October 2026, U.S. tariffs on Mexican imports evolved through emergency declarations[5] [6], USMCA-compliant exemptions[7], and national security duties on metals, before the Supreme Court invalidated emergency IEEPA-based tariffs in early 2026[8]. Transitioning to Section 122 duties and USMCA component rules, average non-qualifying Mexican tariff rates stabilized around 10% to 15% leading into the midterms[1] [3].
USD/MXN monthly chart technical analysis
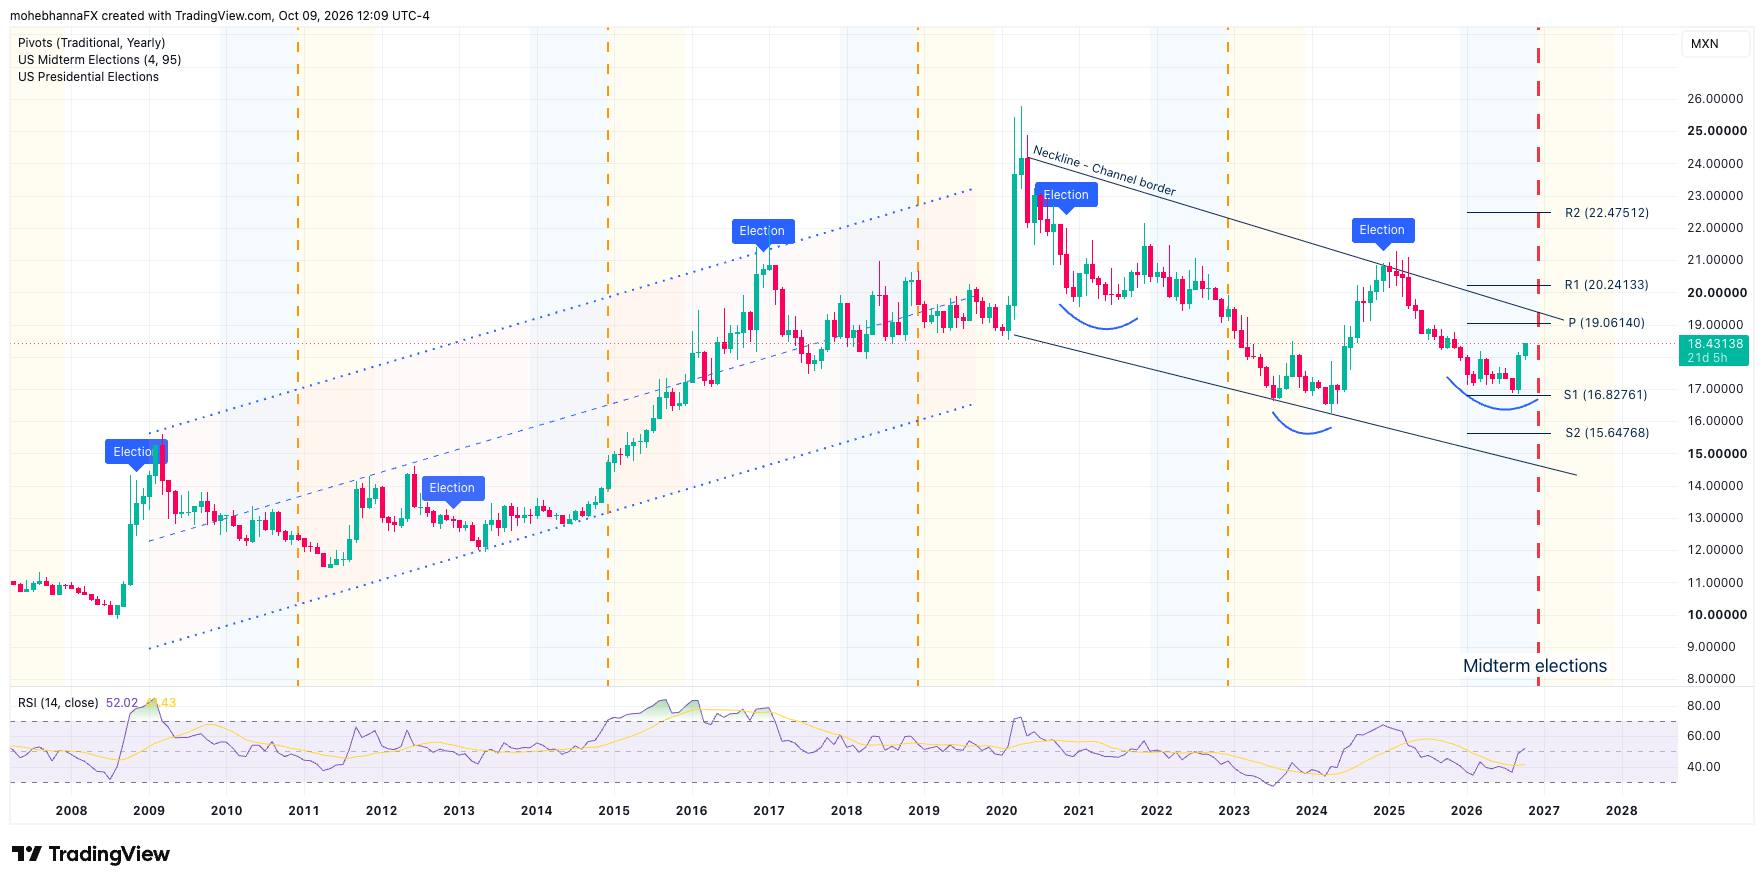
- Looking at the macro structure on the USD/MXN monthly chart, price action moved within a long-term ascending channel bounded by the dotted blue lines between 2008 and 2020.
- In early 2020, price action began trading within a descending formation, as marked by the down-sloping black lines on the chart. The descending formation could be a falling wedge formation for the ascending Channel mentioned earlier. Future price action around the channel boundaries may provide more clarity.
- Within the descending channel, price action indicates a potential inverted Head and Shoulders (H&S) pattern currently forming. The pattern’s neckline aligns with the upper boundary of the descending formation. It intersects with the annual pivot point (PP) at 19.06, creating a key confluence of resistance above current price levels.
- A confluence of support lies below price action, represented by the annual S1 of 16.82, where price action has previously found support several times since 2015. The H&S right shoulder is currently finding support above this level.
- RSI14 remains in line with price action, currently near its neutral level of 50.
Conclusion
Heading into the October 2026 U.S. midterm elections, cross-currency price dynamics across major foreign exchange pairs remain tightly bound to evolving trade policy and tariff frameworks. For EUR/USD, the breakdown below the 1.1280 pivot level under active 15% U.S.–EU baseline tariffs[3] underscores sustained bearish momentum, with technical attention shifting toward dynamic support near the 1.1000 handle. Conversely, USD/CAD continues to test key resistance near 1.4250 as elevated bilateral sectoral tariffs suppress trade flows, leaving the pair anchored within its multi-year range between support at 1.4019 and overhead resistance at 1.4499. Meanwhile, USD/MXN exhibits structural consolidation above its 16.82 support baseline, where an emerging inverted Head and Shoulders structure points to pivotal technical resistance at its 19.06 neckline. As political headlines and trade recalibrations unfold, market participants will monitor critical technical thresholds and momentum indicators across all three pairs to gauge whether the long-term trend will continue or reverse ahead of the polls.
Abbreviation list:
EMA: Exponential moving average
SMA: Simple moving average
RSI: Relative strength index
% K: Fast stochastic
%D: Slow stochastic
MACD: Moving average convergence divergence
Pivot point: PP
Support: S
Resistance: R
Footnotes
[1] https://www.congress.gov/crs-product/IN12519 ↩ ↩2 ↩3 ↩4 ↩5
[2] https://globalnews.ca/news/12089828/donald-trump-tariffs-exports-august/ ↩
[3] https://www.congress.gov/crs-product/R48549 ↩ ↩2 ↩3 ↩4
[4] https://www.csis.org/analysis/liberation-day-tariffs-explained ↩
[5] https://www.whitehouse.gov/fact-sheets/2025/02/fact-sheet-president-donald-j-trump-imposes-tariffs-on-imports-from-canada-mexico-and-china/ ↩
[6] https://tetakawi.com/blog/mexico-tariffs-2026-what-manufacturers-actually-need-to-know/ ↩
[7] https://www.dallasfed.org/research/economics/2026/0804 ↩
[8] https://www.everycrsreport.com/reports/R49481.html ↩
The content here is for educational and informational purposes only. This material is not investment advice or a recommendation or suggestion of any investment strategy, and it does not provide investment advisory services. OANDA is not responsible for any investment decisions made based on this content. Investing involves the risk of a loss of capital. Past performance does not guarantee future results.
Latest blog posts:
.jpg.webp?itok=_3bEL9q1)


Start trading now with fast account opening.
Sign-up now to trade the most active markets
Open account

