







MT5 API + AI: Automate price data, charting & CSV exports

Now that your local trading engine is fully configured and online.
So it’s time to transition from theory to practice by exploring the lifeblood of any trading strategy – market data. Building directly on the environment you established in our previous MT5 API + AI set up guide, this article will teach you how to effortlessly command Claude Code to handle complex data tasks using nothing but plain English.
By the time you finish reading, you will be able to:
- retrieve real-time prices for any currency pair or CFD instrument,
- fetch deep historical candlestick data across any timeframe you choose,
- visualize that raw information as clean, technical price charts.
There are no new programs to install or complex environment variables to configure; your only job is to describe what you want to see, and let your AI developer transform your words into actionable market insights.
Retrieving real-time prices
Let's start with the simplest operation: connecting to MT5 and fetching the current price.
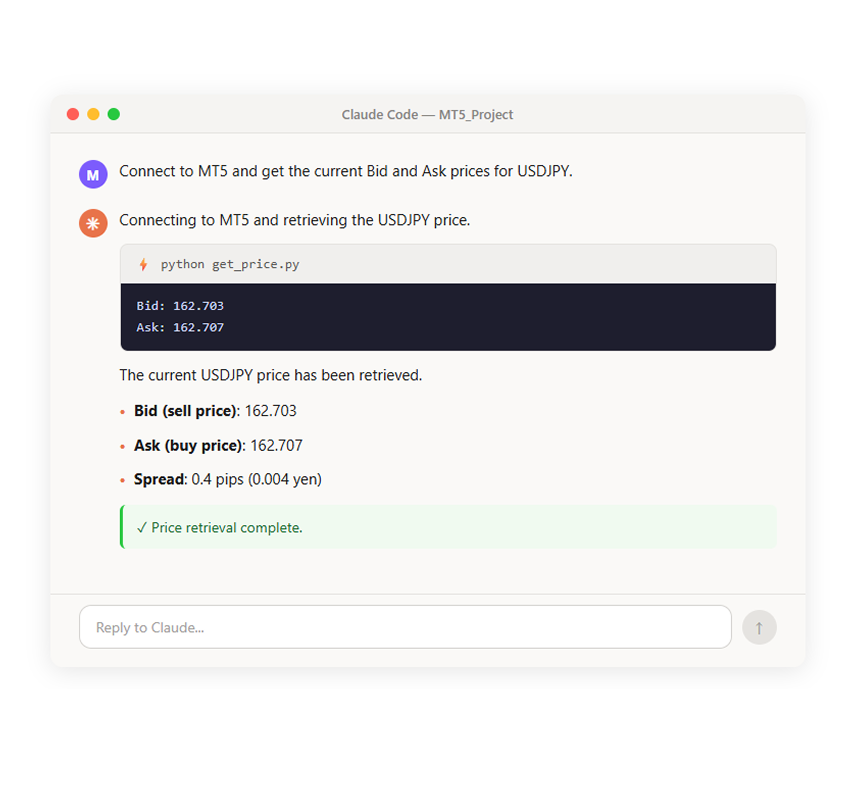
The Bid is the price at which you can sell an asset, while the Ask is the price at which you can buy it. The difference between these two rates is called the spread, which essentially represents your transaction cost for entering the trade.
Getting prices for multiple instruments at once
You can also retrieve prices for multiple instruments in a single request.
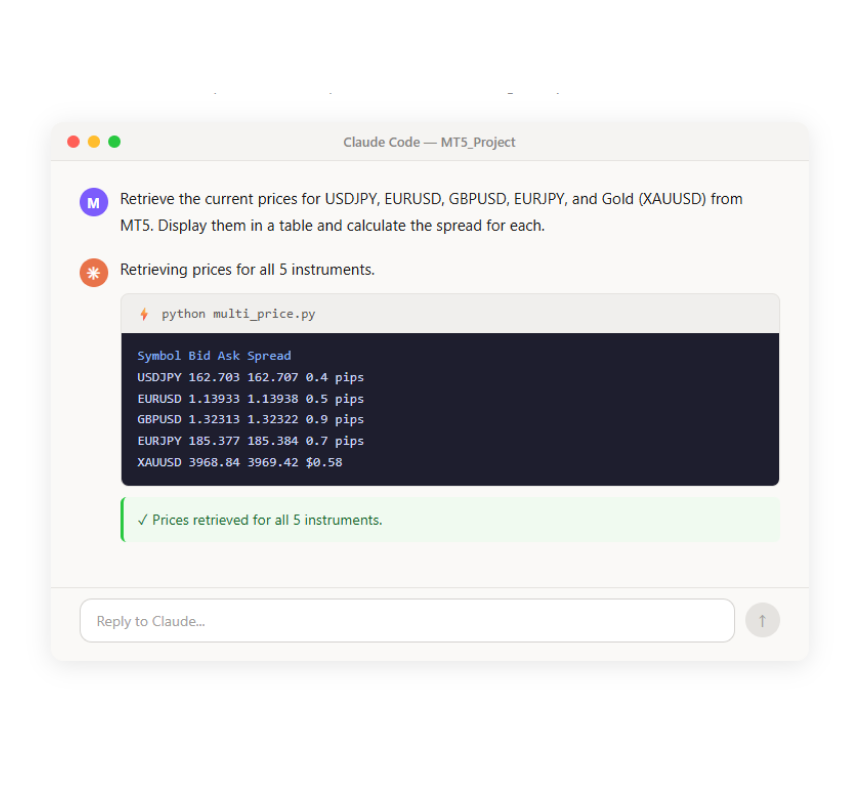
As shown by including "Gold" in the prompt, this approach works for CFD indices as well as FX pairs. Any instrument available in MT5 can be queried this way, including stock indices and crude oil.
Retrieving historical candlestick data
Beyond real-time prices, you can also retrieve historical price data (candlesticks). This is the essential data needed for technical analysis and backtesting.
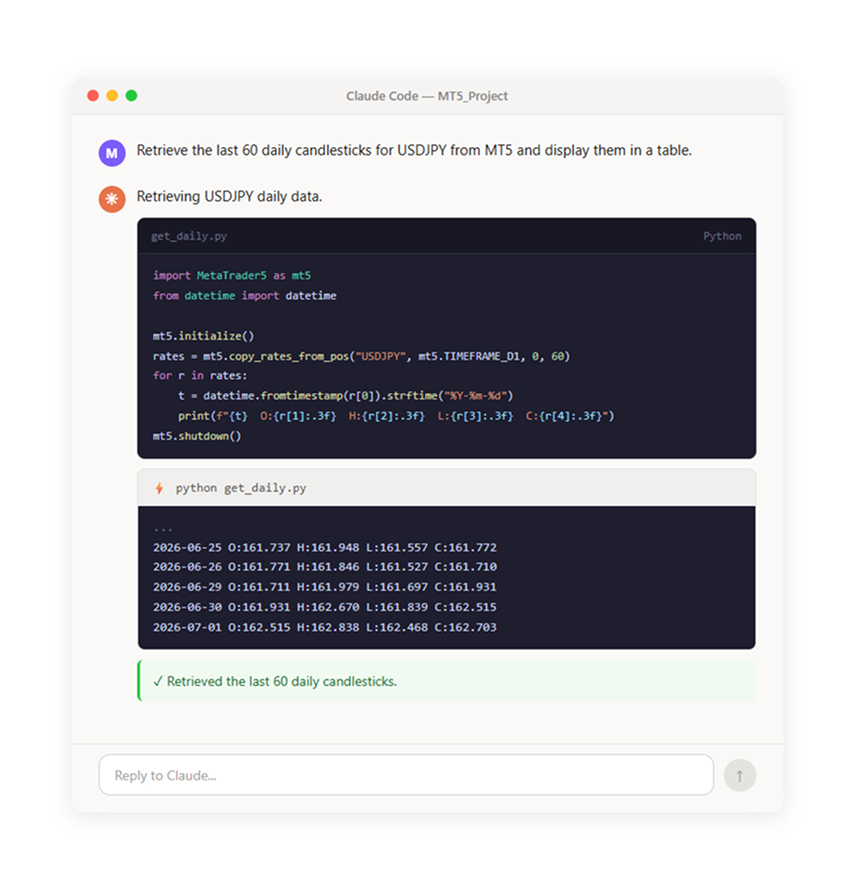
To clarify, you can absolutely list those six data points using bullet points to make them pop out visually and read effortlessly!
Every single candlestick on a chart condenses market activity into a clean, visual snapshot built from six essential data points:
- Time – The exact starting moment of the candlestick period.
- Open & Close – The very first and the final price recorded during that timeframe.
- High & Low – The absolute peak and the lowest bottom prices the market touched.
- Volume – The tick volume, showing exactly how many price changes occurred.
Changing the timeframe
You can retrieve data at various timeframes beyond daily. Simply change the wording in your prompt and Claude Code automatically handles it.
| How to specify | Timeframe |
| "1-minute" | M1 |
| "5-minute" | M5 |
| "15-minute" | M15 |
| "30-minute" | M30 |
| "1-hour" | H1 |
| "4-hour" | H4 |
| "daily" | D1 |
| "weekly" | W1 |
| "monthly" | MN1 |
For example, you can say "Get the last 100 H1 candles for USDJPY" or "Show me the 5-minute chart." Just change the timeframe in your prompt. You can also specify a date range, such as "Get daily data from January 1 to June 30, 2025."
Visualizing data as charts
Raw numbers alone can make it hard to get a feel for how the market has moved. Let's visualize the retrieved data as charts.
A candlestick chart with moving averages and volume can be created in a single prompt.
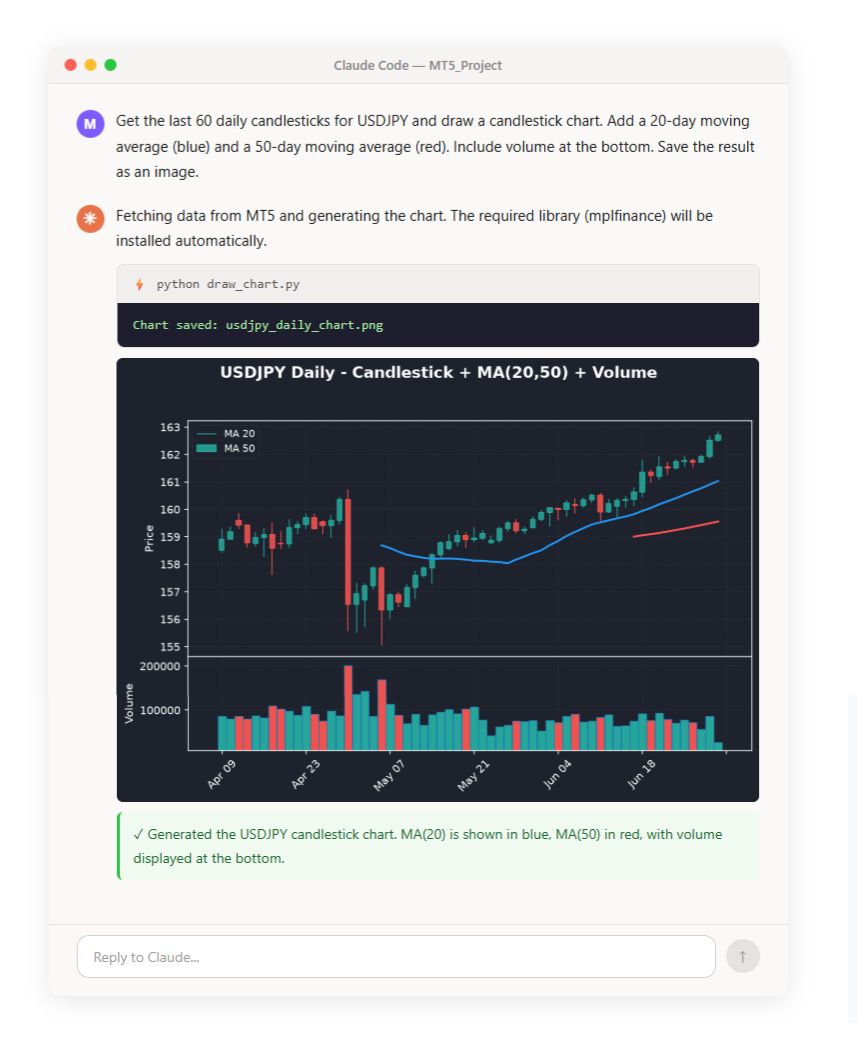
Detailed specifications like "moving averages in blue and red" or "include volume" are applied simply by stating them in plain language. You can also give iterative instructions like "add XX to the previous chart."
Comparing multiple instruments
The MT5 API lets you retrieve data for multiple instruments simultaneously. Let's use that capability to create a comparison chart.
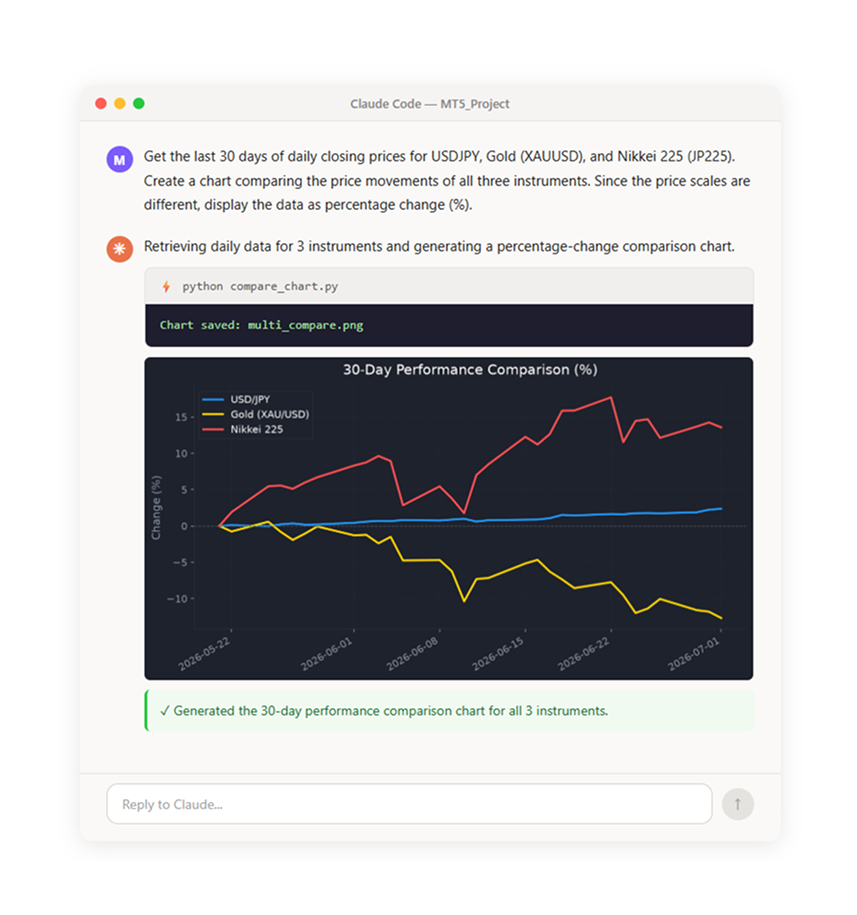
Prompt tips: When you include context-aware guidance like "since the price scales are different, display as percentage change," the AI produces a more appropriate visualization. Learning to add these kinds of details will greatly expand what you can accomplish.
Saving data to a file
The retrieved data can also be saved as a CSV file, ready to use in Excel or Google Sheets.
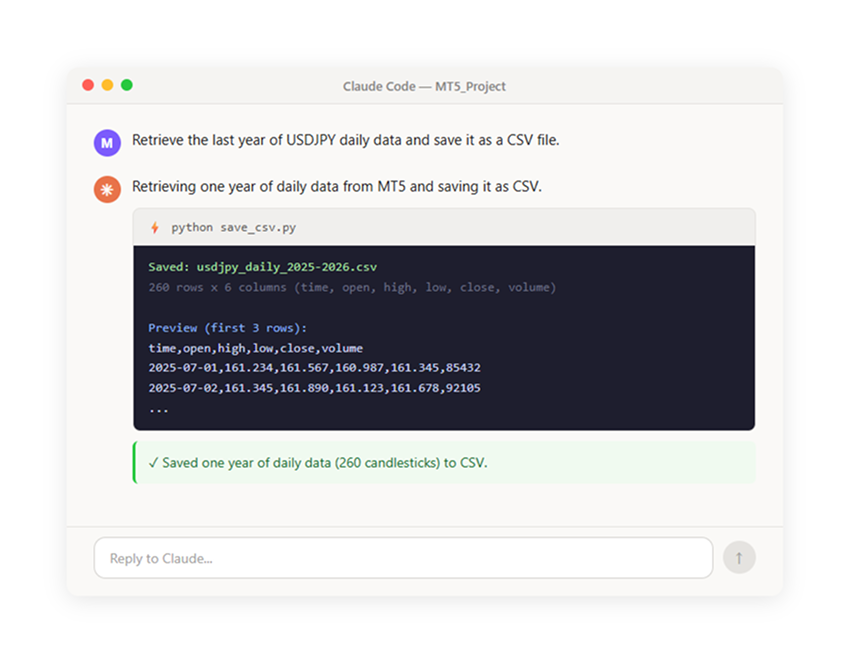
The saved CSV file can be opened in Excel, imported into Google Sheets, or used for further analysis however you like.
Summary of prompts used in this article
Here is a recap of all the instructions given to Claude Code throughout this article. Every task was accomplished using natural language alone, without writing a single line of code.
| Task | Example prompt |
| Single instrument price | "Get the current bid and ask for EURGBP" |
| Multi-instrument listing | "Get prices for 5 instruments and display them in a table" |
| Candlestick data retrieval | "Get the last 100 H1 candles" |
| Timeframe change | "daily" / "5-minute" |
| Date range specification | "From January 1 to June 30, 2025" |
| Chart generation | "Draw a candlestick chart" |
| Adding indicators | "Add 20-day and 50-day moving averages" |
| Instrument comparison | "Compare the price movements of EURGBP and Gold" |
| File export | "Save as a CSV file" |
Summary
In this article, we accomplished the following entirely through natural-language instructions to Claude Code:
- Real-time price retrieval (single and multiple instruments)
- Historical candlestick data retrieval (with timeframe and date range selection)
- Chart visualization (candlestick charts, moving averages, volume)
- Multi-instrument comparison charts
- CSV file export
Without writing a single line of code, we were able to freely retrieve data from the MT5 API and prepare it for analysis.
In the next article, "Auto Trading EA Guide," we will move on to building trading logic. We will walk through how to tell the AI "buy under these conditions and sell under those conditions," and use it to build an automated trading system.
This article is for informational purposes only and does not constitute investment advice or a recommendation. CFDs are complex instruments and carry a high risk of rapid loss of capital due to leverage. Please ensure you understand the risks involved. Past performance is not indicative of future results.
Latest blog posts:


Start trading now with fast account opening.
Sign-up now to trade the most active markets
Open account

