




Meta Q3 earnings preview: Can AI returns justify surging infrastructure spending?

Meta’s Q3 results will test whether rapid AI infrastructure investment can translate into stronger monetisation and earnings growth without putting excessive pressure on margins and cash flow.
Key takeaways
- Advertising remains Meta’s core earnings engine, but investors increasingly want evidence that AI tools can lift monetisation and justify rapidly rising infrastructure spending.
- Capex, margins and free cash flow are the key risks, especially if management signals another sizeable increase in AI-related spending heading into 2027.
- Technically, 653.17 is the key support, while a break above 734.84 may reopen the path towards 777.60/793.70.
Ahead of Wednesday’s Q3 2026 earnings, Meta Platforms (META) faces a critical test of whether its artificial intelligence (AI) investments are generating sufficient returns to justify surging infrastructure spending and maintain its valuation premium.
Meta is scheduled to release its results after the US market closes on Wednesday, 21 October 2026, followed by its earnings conference call at 4:30 pm Eastern Time.1
Meta’s shares have retreated by 2.82% since the start of October through 19 October 2026, reflecting broader weakness in AI-related technology stocks, and Meta also underperformed several of its “Magnificent Seven” peers such as Alphabet (+1.76%), Apple (+3.82%), Tesla (+3.94%), Microsoft (+4.04%), and Amazon (+5.73%) (see Fig. 1).
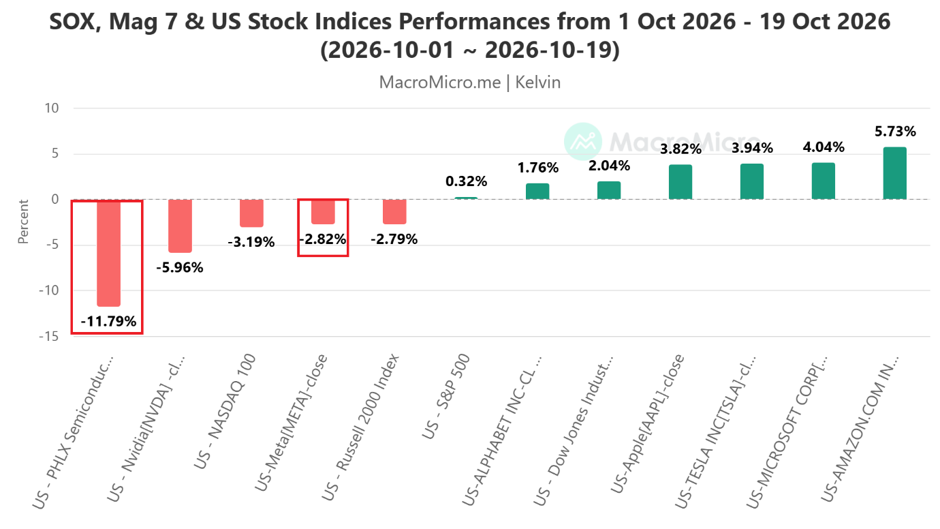
Investors are now increasingly questioning whether rising capital expenditure will translate into sustainable earnings growth. The pullback follows mounting concerns over AI infrastructure financing, with semiconductor stocks also coming under selling pressure.
The street is expecting a 23.6% year-on-year increase in Meta’s Q3 revenue to US$63.34 billion and Q3 earnings per share of US$6.53.2
In addition, options markets are pricing in roughly a ±7.1% earnings move, below Meta’s 10-year average peak earnings-day move of ±10.4%, suggesting a smaller-than-normal reaction.3
Against this backdrop, Meta’s earnings reaction will likely hinge on advertising revenue growth, AI monetisation, operating margins, 2027 capital expenditure guidance and free cash flow.
Let’s now highlight seven fundamental factors that traders should be watching.
1. Advertising revenue growth: the core earnings driver
Meta’s advertising business, encompassing Facebook, Instagram, Reels and its other platforms, remains the principal source of revenue and cash generation.
Q3 consensus revenue of US$63.34 billion represents approximately 23.6% year-on-year growth, close to the upper end of management’s US$61 billion-US$64 billion guidance range.4
Traders will focus on whether AI-powered advertising tools are improving recommendation quality, ad targeting and conversion rates sufficiently to support higher advertising prices and impressions.
2. AI monetisation: can Meta convert investment into revenue?
Meta’s AI monetisation strategy is increasingly important to its valuation, especially following the launch of its Muse AI assistant and continued investment in advertising automation.
Reports indicate that Muse has attracted more than two million daily users, although demonstrating meaningful revenue conversion remains a key challenge.5
The market will monitor user adoption, potential subscription or commercialisation models, enterprise demand and the extent to which AI improvements contribute to the existing advertising business.
3. Capital expenditure: the biggest valuation risk
Based on current guidance mentioned in the Q2 2026 earnings results release in July, Meta’s full-year 2026 capital expenditure guidance is US$130 billion-US$145 billion, including finance lease principal payments, an increase in the lower end of the prior guided spending range of US$125 billion-US$145 billion, as it builds out AI computing infrastructure and data-centre capacity.4
Importantly, the market is no longer focused solely on whether demand for AI infrastructure remains strong. Investors increasingly want evidence that the returns on these investments can justify their financing and operating costs.
S&P Global has recently highlighted growing concerns over hyperscaler AI-related financing commitments and the sustainability of infrastructure investments.6
4. Operating margins and expense growth: profitability under pressure
Meta has guided full-year 2026 operating expenses of US$165 billion-US$169 billion, reflecting higher infrastructure costs, AI-related research and development, and legal expenses.4
The critical issue is whether strong advertising revenue can continue to generate sufficient operating leverage to absorb these costs.
Management previously indicated that full-year 2026 operating income should exceed 2025 levels. Traders will assess whether that outlook remains achievable and, more importantly, how much further operating costs could increase in 2027.
5. Free cash flow: sustainability of the AI investment cycle
Free cash flow is emerging as one of the most important indicators of Meta’s financial flexibility.
Despite strong advertising profitability, Meta’s substantial capital expenditure commitments could continue to absorb an increasing share of operating cash flow.
Investors will be looking for signs that operating cash flow growth can eventually outpace infrastructure investment, allowing Meta to maintain its shareholder returns without compromising its AI ambitions.
6. Forward guidance: the most potentially important post-earnings catalyst
Management’s fourth-quarter revenue outlook and preliminary 2027 spending expectations may have a greater influence on share-price performance than the reported Q3 numbers.
Traders will focus on whether advertising demand remains resilient heading into the year-end holiday season and whether Meta can maintain its growth trajectory amid higher infrastructure costs.
7. Market positioning and the broader AI sell-off
Meta’s results arrive at a sensitive juncture for US technology stocks.
The Nasdaq 100 and semiconductor sector have recently experienced significant weakness amid concerns over elevated AI infrastructure spending and the sustainability of the investment cycle.7
Share-price implication: A stronger-than-expected earnings release could attract renewed buying interest in Meta and the wider AI-related technology sector. However, disappointing guidance could accelerate selling pressure, particularly if investors view Meta’s spending trajectory as further evidence of weakening returns on AI investment.
Fundamental bottom line: what matters most for traders
The market is increasingly distinguishing between companies benefiting from AI investment and those generating measurable financial returns from it.
For Meta, advertising remains the earnings engine, while AI infrastructure spending is the principal valuation risk.
The most bullish outcome would combine stronger advertising revenue, resilient operating margins and convincing evidence that AI adoption is translating into higher monetisation, without another substantial increase in projected expenditure.
Conversely, even an earnings beat may fail to support the share if management signals accelerating AI costs, weaker free cash flow or limited revenue visibility into 2027.
Let’s now focus on the multi-month outlook of Meta and key levels to watch from a technical analysis perspective.
Technical analysis: Positive follow-through after bullish breakout from 13-month descending range
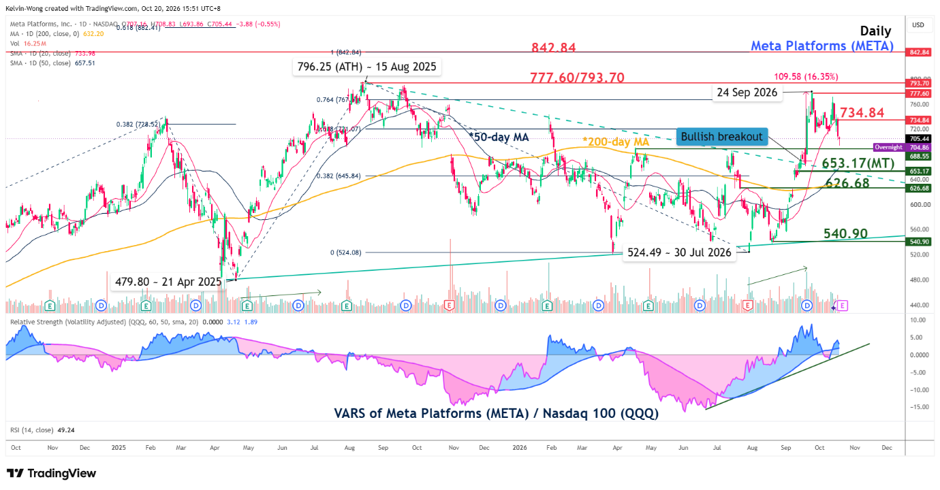
The price action of Meta staged a bullish breakout on 15 September 2026 from a four-week descending range, running from its current all-time high of 796.25, printed on 15 August 2025.
Thereafter, Meta rallied 16.3% to a 12-month high of 777.60 on 24 September 2026, then staged an 11% pullback while holding above its 50-day moving average in October.
The recent multi-month up move from the 30 July 2026 low to the 24 September 2026 high has been accompanied by higher-than-average volume relative to the prior multi-month rally of 21 April 2025 to 15 August 2025, suggesting that the bulls are likely in control (see Fig. 2).
The volatility-adjusted relative strength (VARS) of Meta against the Nasdaq 100 exchange-traded fund (QQQ) has trended upwards since 23 June 2026 and has remained above the centreline since 12 October 2026, a condition for further potential outperformance of Meta over the Nasdaq 100.
Watch the 653.17 key medium-term pivotal support (also the 50-day moving average) to maintain Meta’s potential multi-month uptrend phase. A clearance above 734.84 intermediate resistance (also the 20-day moving average) sees the medium-term resistance zone of 777.60/793.70 in the first step.
However, failure to hold and a daily close below 653.17 negate the bullish tone, suggesting a potential slide towards the key 200-day moving average, which acts as the next support at 626.68; a break below it would expose the major support of 540.90.
Footnotes
2. https://www.marketbeat.com/earnings/reports/2026-10-21-facebook-inc-stock
3. https://earnings-watcher.com/wiki/meta-earnings-october-2026
5. https://www.businessinsider.com/meta-muse-agentic-ai-capex-q3-earnings-2026-10
7. https://www.ft.com/content/7c2e889e-2eb5-4c62-821b-1a7f88c13d05
The content here is for educational and informational purposes only. This material is not investment advice or a recommendation or suggestion of any investment strategy, and it does not provide investment advisory services. OANDA is not responsible for any investment decisions made based on this content. Investing involves the risk of a loss of capital. Past performance does not guarantee future results.
Latest blog posts:


Start trading now with fast account opening.
Sign-up now to trade the most active markets
Open account

