As traders, we should remember that financial markets are often correlated, with each instrument trading relative to another. As a result, having the right TradingView chart layout can help ensure these market correlations are identified. Read on.
Introduction
When trading, it is crucial to remain informed as to what is happening across a broad range of markets, regardless of what instrument you are focussing on to trade. This is especially important when acknowledging that most instruments, if not all, correlate to a certain degree with the price action of others. Find out more about market correlations.
In this article, we will go over some examples of intermarket analysis utilizing TradingView charts, which allow us to create multiple and different types of chart layouts depending on a trader’s individual needs. We will also discuss the logic behind each layout and what exactly we are looking for.
As a prerequisite when setting up different Intermarket analysis charts layouts, all charts should share the same timeframe, display the same amount of history, and have the same chart type for each layout (candlestick, bar chart, line chart, etc.). We can always zoom in or out just by selecting a chart and scrolling to see more historical data if needed.
Forex Pairs View
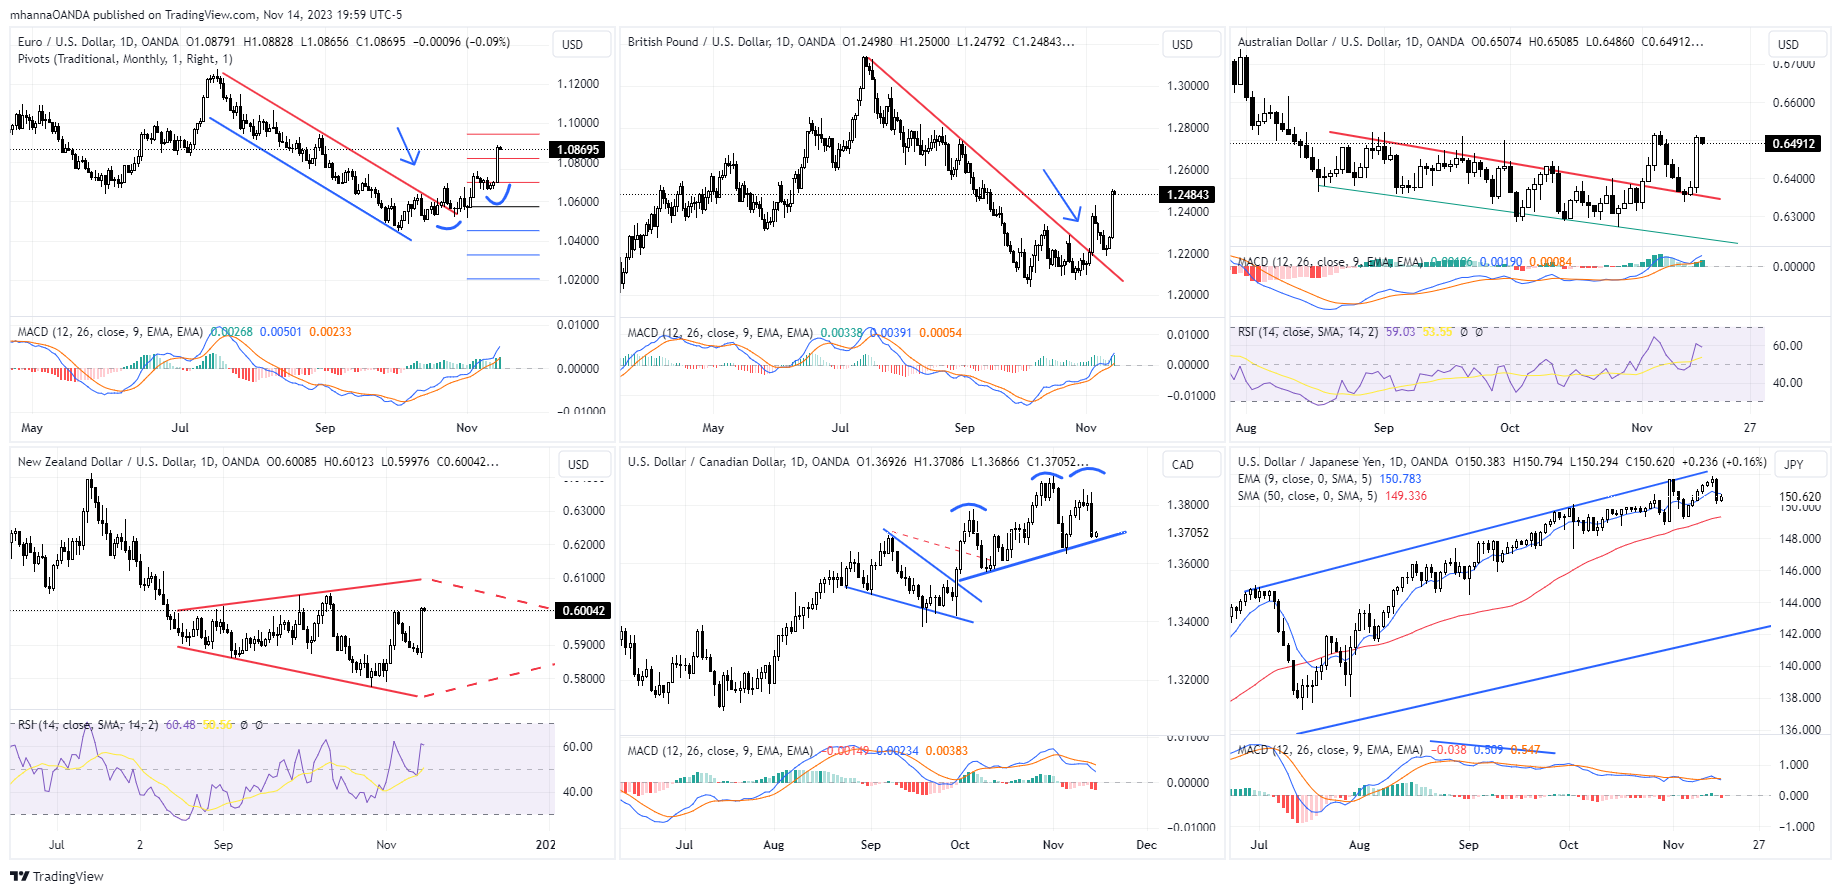
The first view to look at will be that of the major forex pairs. This allows us to compare price action for the major pairs at a glance, as well as helping us to understand how different currency pairs are fluctuating against the US Dollar. For example, the Euro and the British Pound have a high correlation and tend to move in the same direction against the dollar. However, that’s not always the case, as sometimes we can see the two currencies move at a different pace or even in the opposite direction. This also allows us to spot discrepancies, if any.
Another example is the Australian Dollar and the New Zealand Dollar. Both currencies have a very high correlation to each other due to many factors, including but not limited to international trade, the geographical location of both economies, and their proximity to Asian markets, including China and Japan.
A trader may also include a few basic indicators and possibly apply any trendline drawings if applicable; for example, the above Forex Pairs View view has MACD (Moving Average Convergence Divergence) applied to all charts, and it also has RSI applied only to commodity currencies. The collective view can help a trader in different ways, in selecting which instrument has a better risk to reward ratio or maybe looking for RSI to be at a specific level at the same time on AUD/USD and NZD/USD to improve their odds.
Applying trendlines, Fibonacci levels, or any trader’s pattern that they are following on a chart can also add an advantage. For example, on the above charts, we can see EUR/USD and GBP/USD both in a downtrend; both currencies are highly correlated but not perfectly. We can also see commodity currency pairs, AUD/USD and NZD/USD trading within a sideways pattern, signalling indecision and a potential breakout or a range trading pattern.
There is more to see, however. USD/CAD has a pennant formation and is possibly attempting a flag/pennant pattern; both are considered continuation patterns and offer traders the ability to identify potential major price changes.
Australian and New Zealand dollars are also considered commodity currencies along with the Canadian dollar. The three pairs' collective view helps us as traders see how commodity currencies' price action is against the dollar.
The last chart on the bottom right is mainly to gauge market risk. For many reasons, the Japanese yen is considered a safe haven that traders can flock to at times of uncertainty, and therefore we should always keep an eye out for USD/JPY, even if we are not trading the pair.
This chart also provides more insights. We can see USD/JPY in a decent uptrend since January 2023; the trend is steep, reflecting a strong uptrend; however, the price has deviated far from its drawn trendline and its MA50 and EMA9; we can also spot a negative divergence between price action and the coiling up MACD indicator.
Commodities View
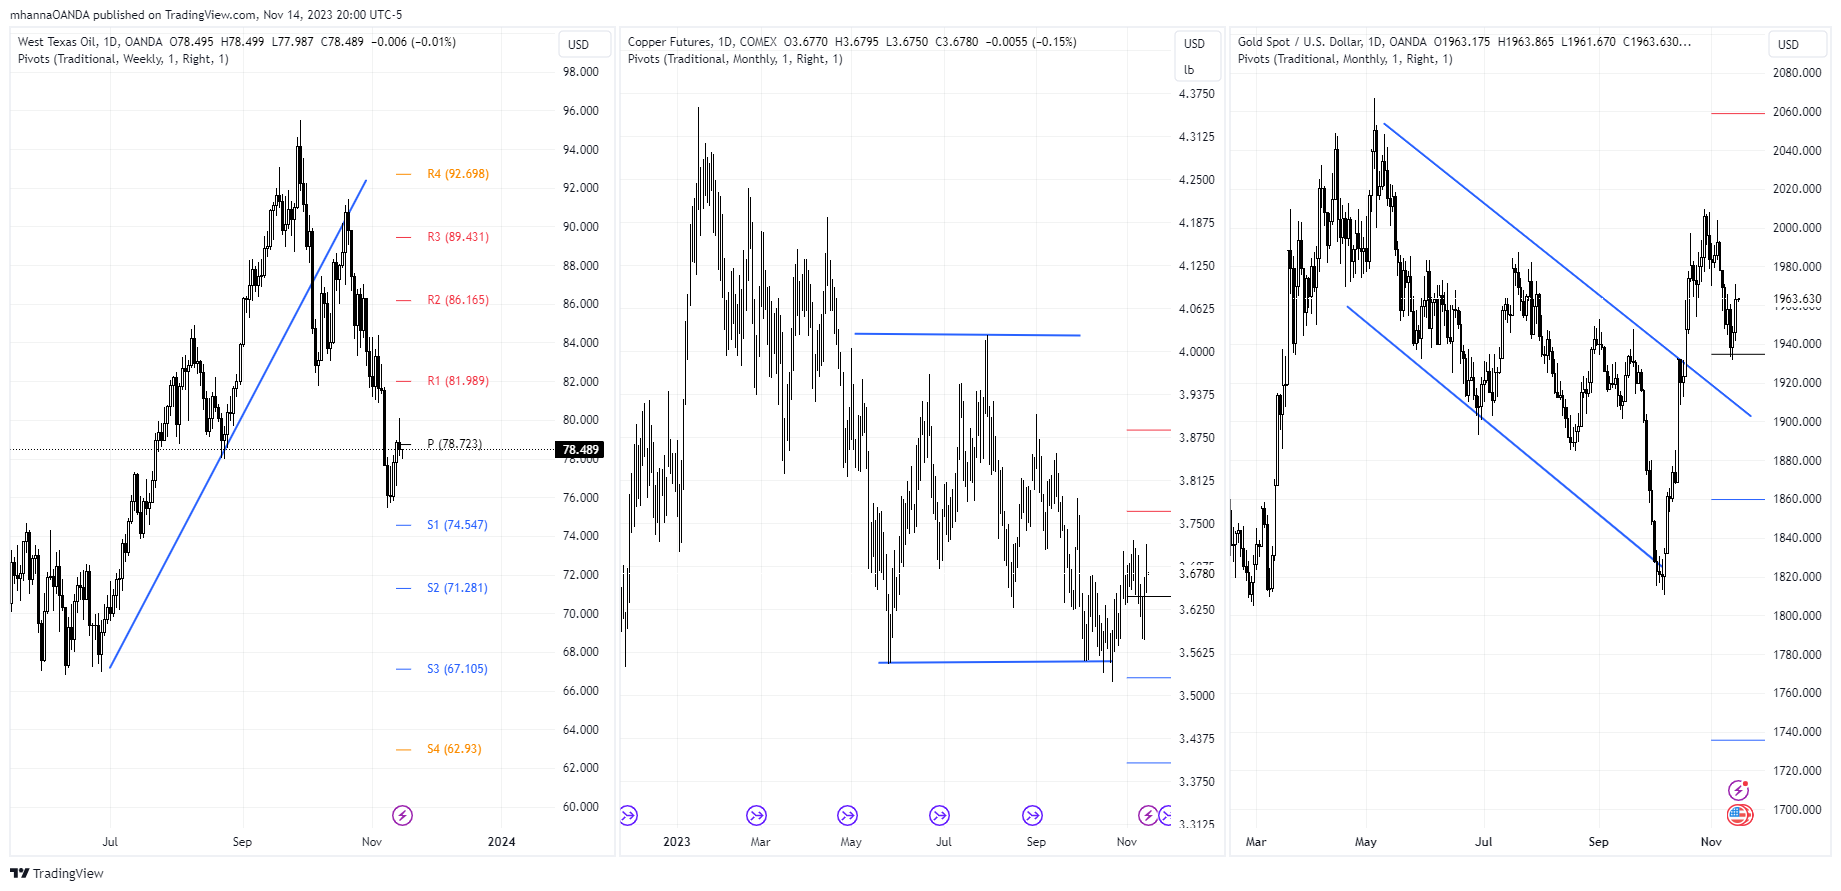
The second view to consider will be that of the overall commodities view, as commodity price action can give us an overview of two important economic factors: growth and inflation.
When an economy is growing, it is usually accompanied by higher demand for commodities, which is usually reflected in higher prices. It doesn’t stop there, as the respective currency correlated to a specific commodity tends to follow suit. Examples can be the correlation between the Canadian dollar and crude oil or the New Zealand dollar and copper.
Higher commodities prices are also a main driver of high inflation, the commodities layout view allows us to see the overall price action for major commodities which allows us to narrow down the cause of price changes whether it is due to inflation that affects the commodity market as a whole or due to a reason related to a specific commodity by itself.
On the above commodity view charts, we can see that oil prices rose sharply, mostly due to Saudi Arabia’s and Russia’s decisions to lower production in an attempt by oil producers to maintain higher oil prices. We can also see that the price is now at a resistance level, which we can monitor. The copper futures chart shows price action is below its pivot point and is also within a potential trading range.
Bonds and Interest Rates
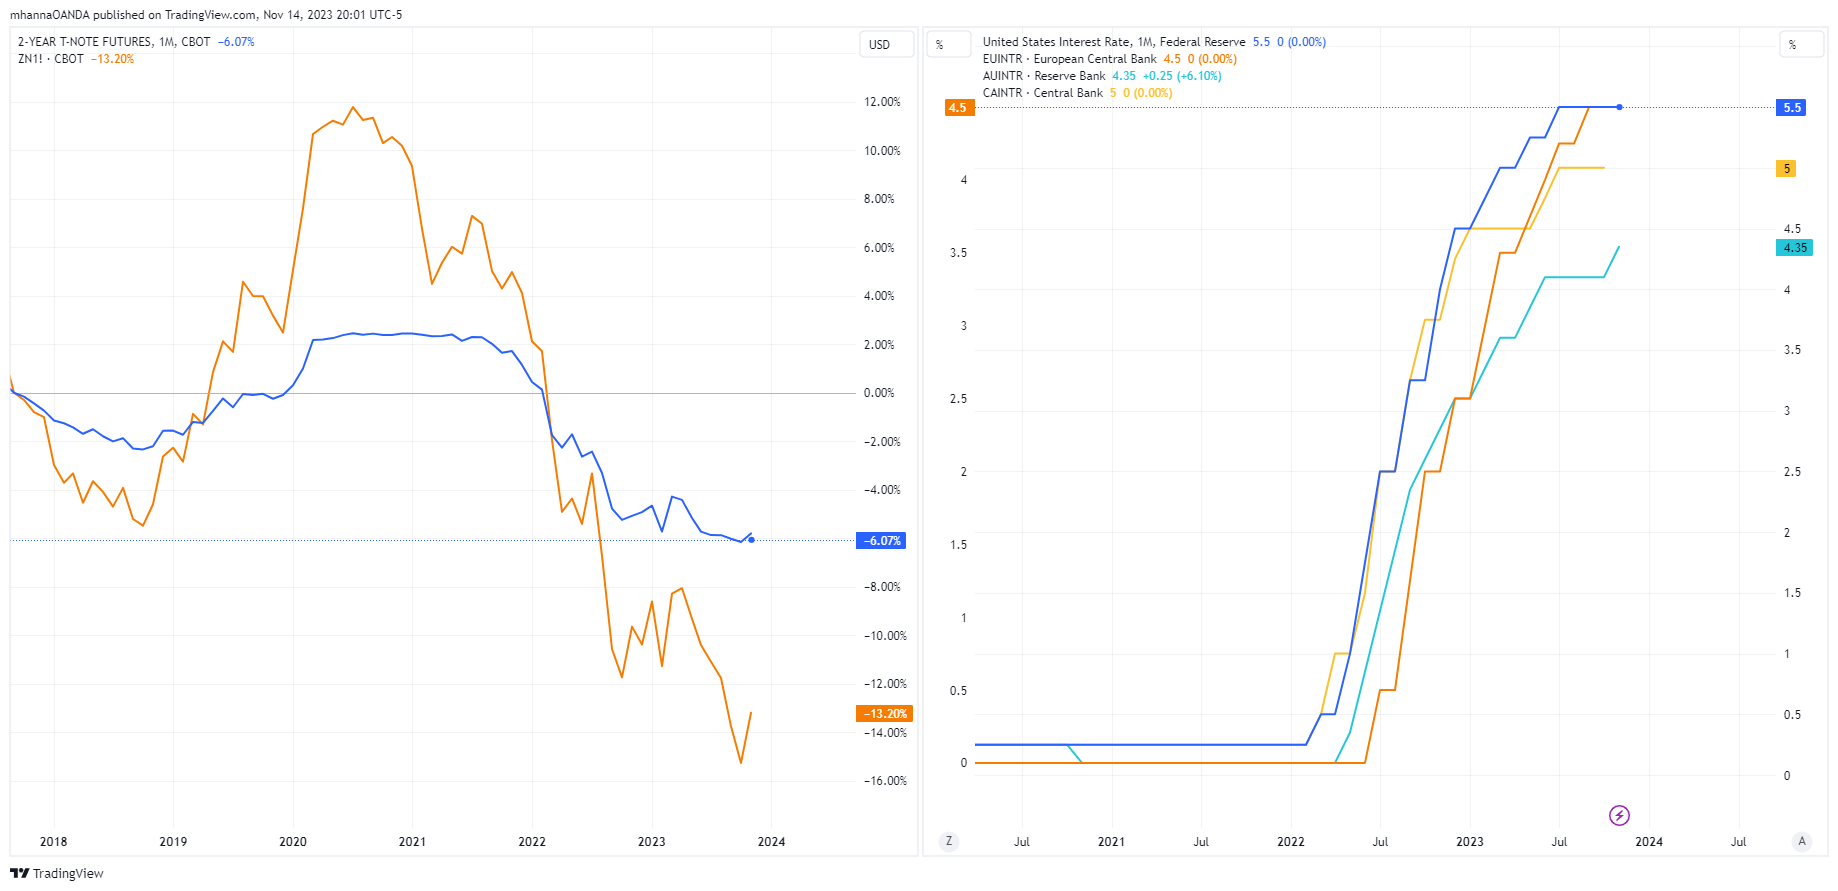
We may end up not using this view as much as the others because it may take longer to see changes; however, a trader needs to be aware of the current interest rates for major currencies as well as a general understanding of what's happening in the bond market. This view should be reviewed periodically.
This view is divided into 2 charts. The first chart on the left shows two commonly followed bond durations, the 2-year and the 10-year T-notes.
The second chart on the right is for the current interest rates for major currencies, which helps us understand how different central banks around the world are managing interest rates.
The bond price action is crucial at times of interest rate changes, which we have been living through for a while and possibly still have more to go through. Bonds have a negative correlation to interest rates, and therefore their price declines as interest rates rise and vice versa.
The view also allows us to compare price action for different bond maturity durations, enabling us to see how investors are assuming risk in the short, mid, and long terms. In some cases, in the bond markets, we can see that investors are ahead of the FED in interest rate expectations.
Stock market indices
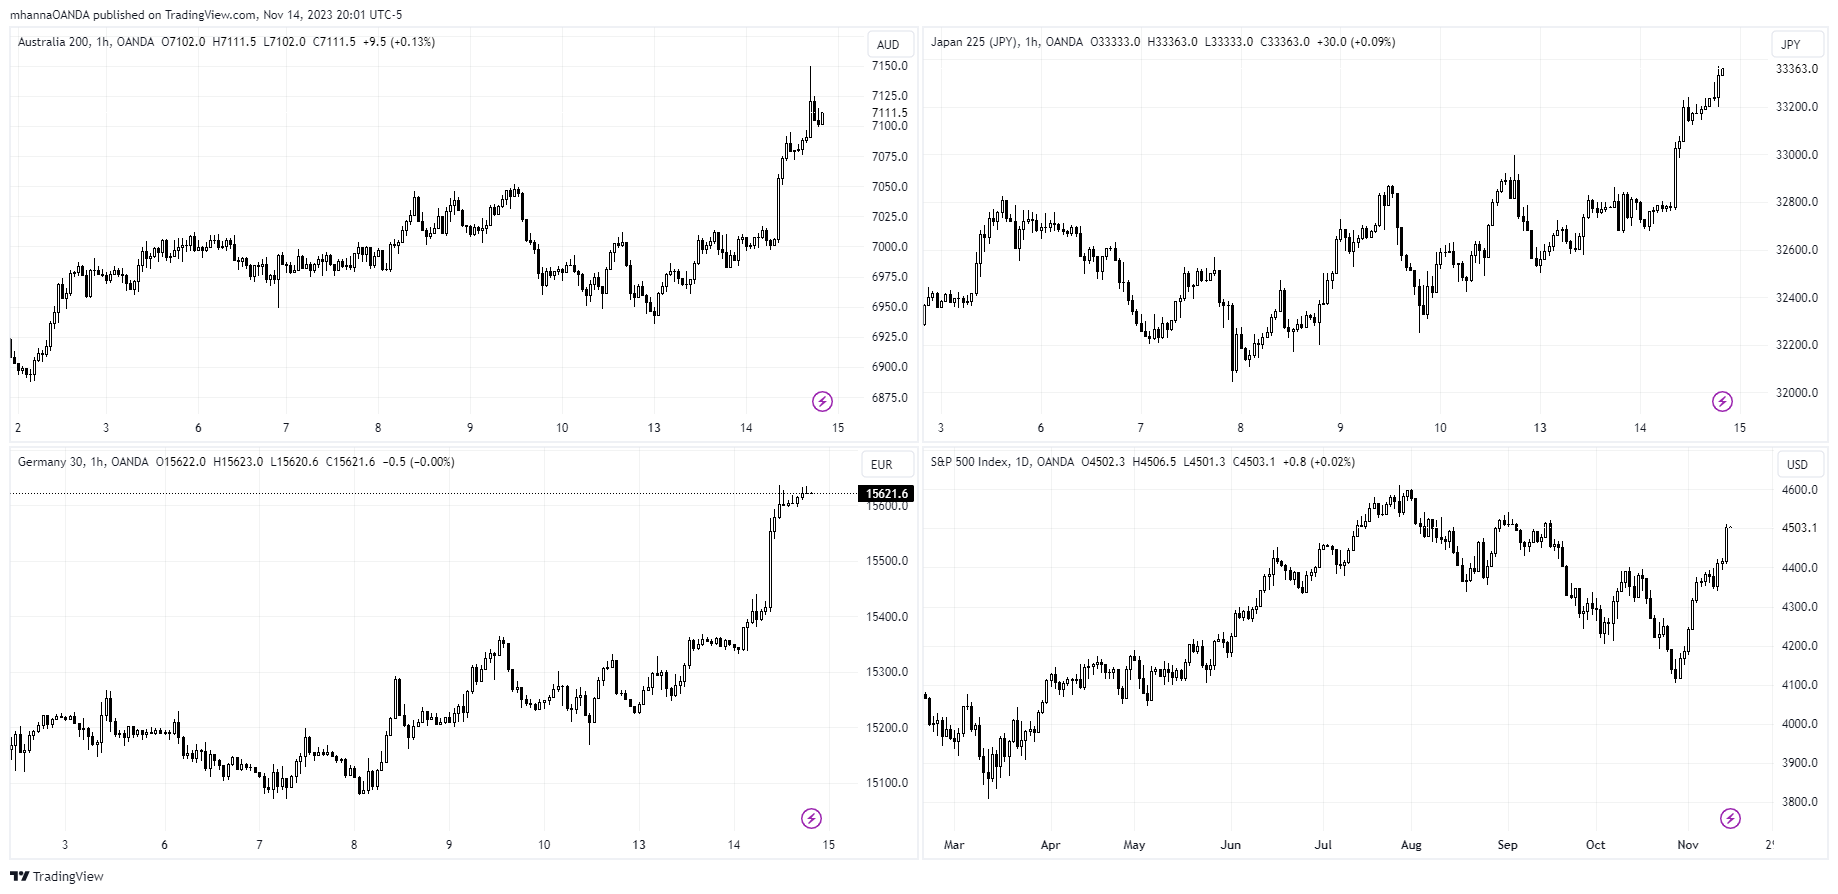
Stock market indices have a strong correlation to each other as well as to different currency pairs; the correlation may change over time, but it is always there. Many of us have witnessed or even traded before at times of fear. At some point, when investors or traders are under pressure to liquidate their stock market investments, the opposite is also true. When investors or traders see opportunities in the market, the same correlation is in place. It is also worth noting that FX markets trade around the clock, 24 hours a day, 5 days a week, while stock markets are only open for a limited and timed trading session during the day, which differs between countries.
The above chart includes four major stock market indices, offering traders a 24-hour stock market view as each falls in a different time zone. Investors' behavior in Asia can sometimes be an early indication of what behavior to expect when the US markets open. In this case, it might make more sense to see price action on shorter time frames.
Cryptos
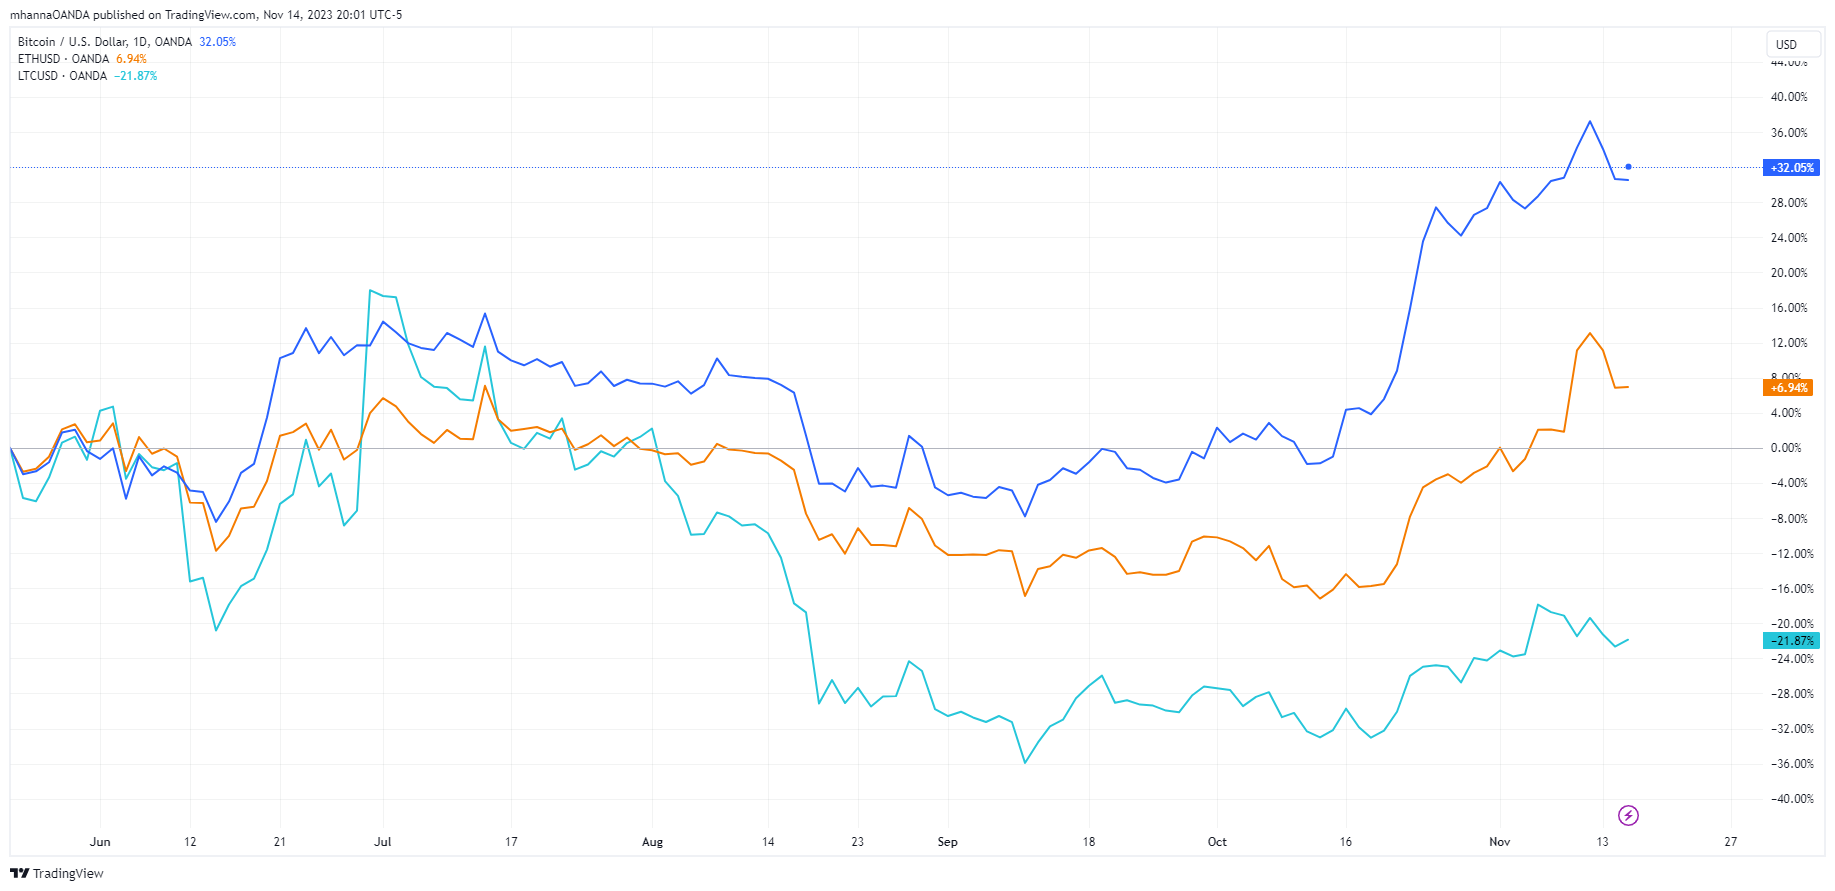
Cryptocurrencies are a different asset class, and for some, it's a means of exchange or a form of money; however, in many cases, cryptos trade in a similar manner as stocks do. This can be due to the way cryptos are constructed, as they are heavily dependent on the individuals and the strength of the ledger behind them.
Crypto price action can help traders measure market risk appetite at a specific time or during a specific event. Cryptos are also available for trading 24/7, enabling traders to always be informed of what is happening in the crypto markets. A chart layout with a few major cryptos applied to it should provide an overall view of the crypto markets and help us isolate price action affecting the crypto markets as a whole from price changes related to only a specific cryptocurrency.
Combined views
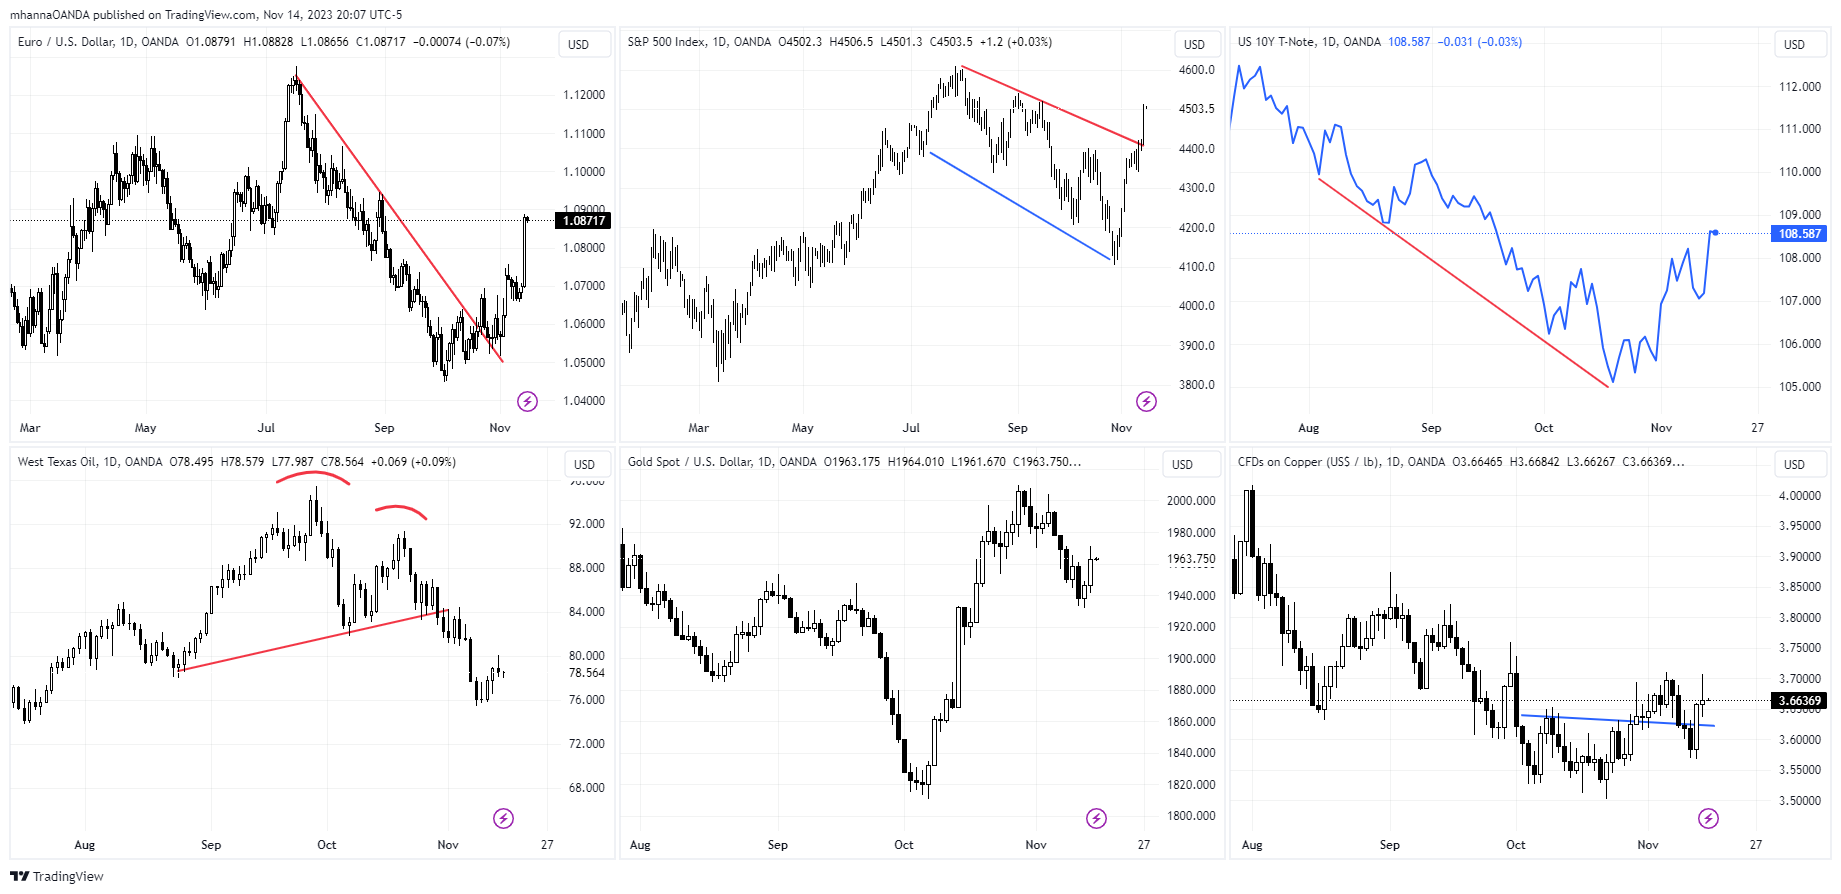
Some traders may opt for a summarized version of all the above into one combined view; the view may contain a sample of each market or of the most important ones, therefore combining all the information into one summarized view. Choosing a sample from each market will depend on a trader’s individual needs and which currencies they are trading. An example can be that if a trader is following EUR/USD, a sample from each market can be S&P, 10-year notes, oil, gold, and copper, along with the currency being traded, EURUSD. In our example, this created a summary using 1 layout with 6 charts.
A trader may also consider creating multiple combined views where each view serves a specific purpose, which can help in planning their trades.
Conclusion
Technical analysis is not meant to be complicated, and traders don't have to use all the available trading tools or utilize every possible technical analysis approach. Focus should instead be shifted to not only knowing when to use each approach but also having the powerful tools available at any given time - like the ones available at OANDA.
Take advantage of powerful analysis tools, tight spreads on forex pairs, and low commissions on crypto trades. Find out more about trading with OANDA.
It's important to remember that financial markets are correlated; an incident affecting a specific market that happens across the globe will have an impact on other markets globally, and traders will react to it everywhere.
Disclaimer
This article is for general information purposes only, not to be considered a recommendation or financial advice. Past performance is not indicative of future results.
Opinions are the author's; not necessarily that of OANDA Corporation or any of its affiliates, subsidiaries, officers or directors.
Leveraged trading in foreign currency contracts or other off-exchange products on margin carries a high level of risk and is not suitable for everyone. We advise you to carefully consider whether trading is appropriate for you in light of your personal circumstances. You may lose more than you invest. We recommend that you seek independent financial advice and ensure you fully understand the risks involved before trading.
OANDA CORPORATION IS A MEMBER OF NFA AND IS SUBJECT TO NFA'S REGULATORY OVERSIGHT AND EXAMINATIONS. HOWEVER, YOU SHOULD BE AWARE THAT NFA DOES NOT HAVE REGULATORY OVERSIGHT AUTHORITY OVER UNDERLYING OR SPOT VIRTUAL CURRENCY PRODUCTS OR TRANSACTIONS OR VIRTUAL CURRENCY EXCHANGES, CUSTODIANS OR MARKETS.
Trading in digital assets, including cryptocurrencies, is especially risky and is only for individuals with a high risk tolerance and the financial ability to sustain losses. OANDA Corporation is not party to any transactions in digital assets and does not custody digital assets on your behalf. All digital asset transactions occur on the Paxos Trust Company exchange. Any positions in digital assets are custodied solely with Paxos and held in an account in your name outside of OANDA Corporation. Digital assets held with Paxos are not protected by SIPC. Paxos is not an NFA member and is not subject to the NFA’s regulatory oversight and examinations.


