The MACD is a momentum-based trend indicator used to identify trending phases, trend change, and momentum in the price actions of a financial instrument.
The three components of the MACD
The MACD, or Moving Average Convergence/Divergence indicator, is a popular indicator used in technical analysis. The indicator was first created in the late 1970s by Gerald Appel.
In this article, we discuss several short-term trading applications using the MACD indicator in conjunction with other technical analysis tools.
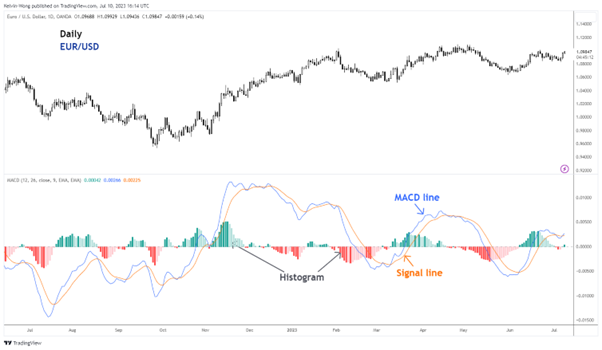
Moving Average Convergence/Divergence (MACD) is calculated by subtracting the 26-period exponential moving average (EMA) from the 12-period EMA. The resulting line is called the MACD line. A 9-period EMA of the MACD line is then plotted as a signal line. Overall, there are three key components of the MACD:
- MACD line (the difference between the 12-period EMA & 26-period EMA)
- Signal line or smoothing line (9-period EMA of the MACD line)
- Histogram (the distance between the MACD line & Signal line)
How can the MACD indicator be used in trading?
The MACD indicator can be used in a variety of ways, but some of the most common include:
Identifying trend conditions
A bullish trend condition can be indicated by a rising MACD line above the zero centreline. In contrast, a declining MACD line below the zero centreline suggests a bearish trend condition.
Identifying trend changes
The MACD line can be used to identify trend changes by looking for crossovers between the MACD line and the signal line. A crossover from below the signal line to above the signal line is a bullish signal, while a crossover from above the signal line to below the signal line is a bearish signal.
Identifying divergences
Divergences are a technical analysis pattern that can signal a potential price action reversal through the easing of momentum. A bullish divergence occurs when the MACD line makes a higher low than the previous low below the centreline, in contrast with the price of the financial instrument that has continued to make a lower low. A bearish divergence occurs when the MACD line makes a lower high than the previous high above the centreline, while the price of the financial instrument has continued to trade higher.
Short-term trend-following and countertrend trading set-ups
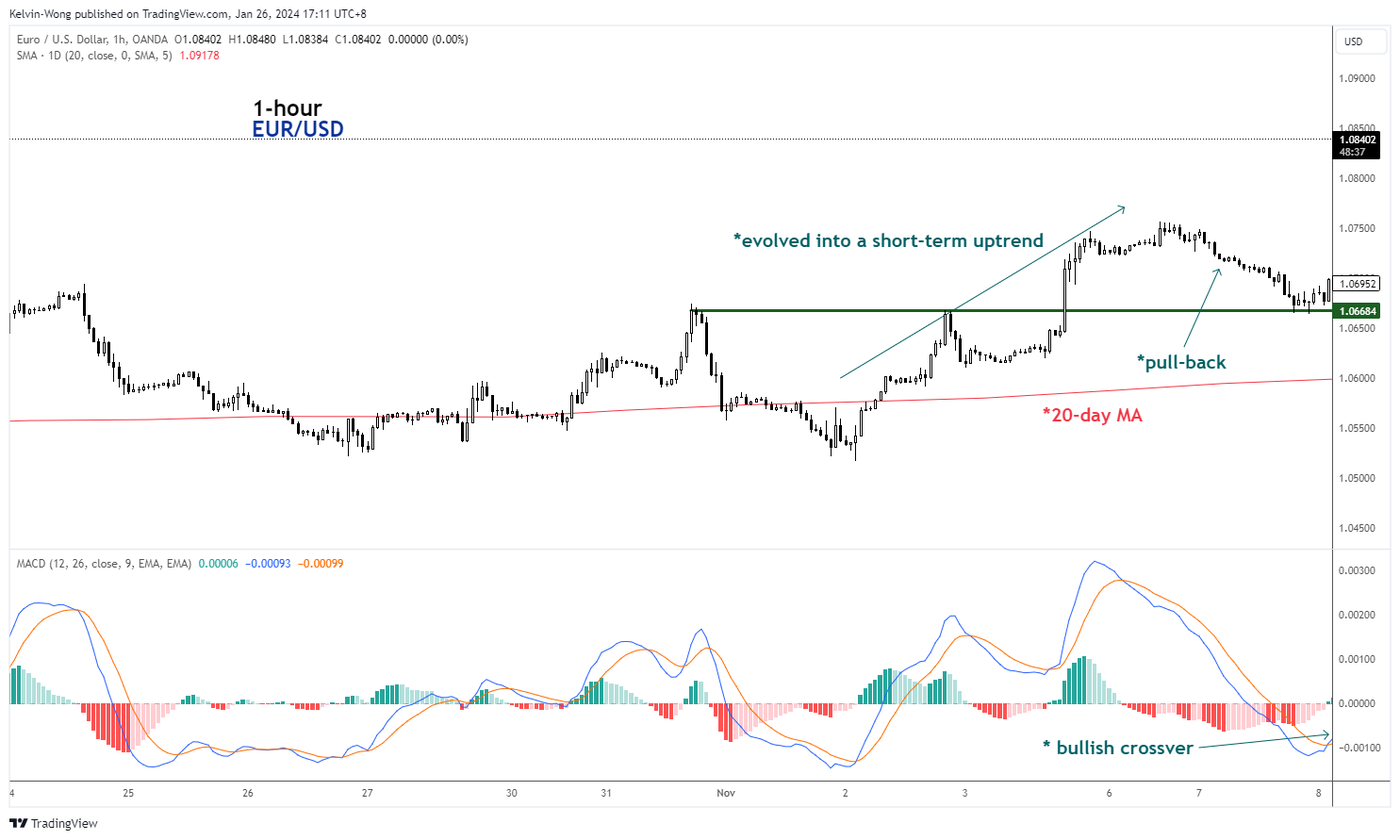
The price actions of the EUR/USD have evolved into a short-term uptrend phase from the 2 November 2023 low to the 6 November 2023 high, reinforced by a reintegration back above the 20-day moving average and a bullish breakout above 1.0668 resistance.
For a bullish trend-following trading set-up, we will ideally want the price actions to stage a pull-back towards support to obtain a better reward-risk ratio and wait for a bullish signal to occur before putting in an entry; an indication that potential bullish momentum has resurfaced.
In this example, the EUR/USD has pull-backed subsequently after 6 November 2023 and hit the 1.0668 former resistance now turns to pull-back support on 7 November 2023.
Thereafter, we will wait for a bullish signal to appear via the MACD indicator, and a bullish crossover was flashed out on 8 November 2023 at 2.00 am (UTC + 8) hourly period which suggests a potential revival of the bullish trend condition. A bullish entry can be initiated at the next opening hour period.
Price actions of EUR/USD have managed to rally higher after 6 days from the bullish entry as it broke above the former minor swing of 1.0757 high on 14 November 2023.
The price actions of the EUR/USD have evolved into a short-term downtrend phase from the 10 August 2023 low to the 18 August 2023 low as it traded below the 20-day moving average and was reinforced later by a bearish breakdown below 1.0935 support.
For a bearish trend-following trading set-up, we will ideally want the price actions to stage a snap-back towards resistance to obtain a better reward-risk ratio and wait for a bearish signal to occur before putting in an entry.
In this example, the EUR/USD has snap-backed subsequently after 18 August 2023 and almost hit the 1.0935 former support now turns snap-back resistance on 22 August 2023.
Thereafter, we will wait for a bearish signal to appear via the MACD indicator, and a bearish crossover was flashed out on 22 August 2023 at 6.00 pm (UTC + 8) hourly period which suggests a potential revival of the bearish trend condition. A bearish entry can be initiated at the next opening hour period.
Price actions of EUR/USD have managed to trade lower after 1 day from the bearish entry as it broke below the former minor swing low of 1.0845 on 23 August 2023.
The short-term downtrend of the EUR/USD has been reinforced after its price actions staged a bearish breakdown below its 20-day moving average on 4 December 2023 and subsequently shaped a series of “lower lows”.
On 12 December 2023 at 2.00 am (UTC + 8) hourly period, it managed to stage a bounce right above its recent minor swing low of 1.0724. In addition, the MACD line has flashed out a bullish divergence condition below the centreline which suggests a potential easing of the downside momentum of the ongoing short-term downtrend phase.
The odds now have increased for a bullish countertrend rebound set-up opportunity for the price actions of EUR/USD to potentially stage a mean reversion towards its 20-day moving average now acting as a resistance at around 1.0870.
A bullish entry can be initiated at the next opening hour period after the first bullish candle. Thereafter, the price actions of EUR/USD managed to stage the expected bullish countertrend rebound and hit the 20-day moving average (resistance) two days later on 4 December 2023.
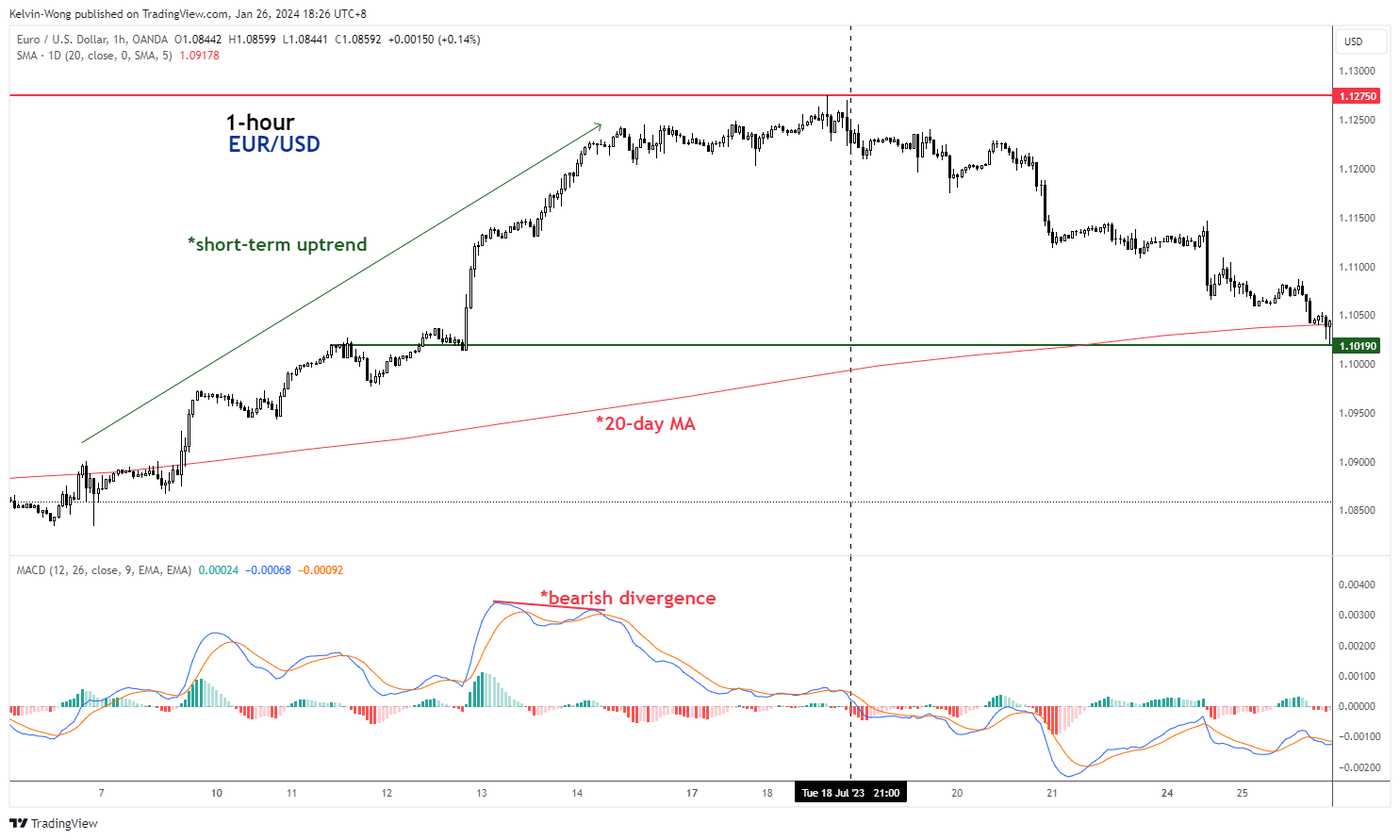
The EUR/USD has evolved into a short-term uptrend phase after a clearance above the 20-day moving average on 7 July 2023 and subsequently shaped a series of “higher highs.”
On 18 July 2023 at 8.00 pm (UTC + 8) hourly period, it managed to stage a retreat right below its recent minor swing high of 1.1275. In addition, the MACD line has flashed out a bearish divergence condition above the centreline which suggests a potential easing of the upside momentum of the ongoing short-term uptrend phase.
The odds now have increased for a bearish countertrend decline set-up opportunity for the price actions of EUR/USD to potentially stage a mean reversion towards its 20-day moving average now acting as a support at around 1.1019.
A bearish entry can be initiated at the next opening hour period after the first bearish candle. Thereafter, the price actions of EUR/USD managed to stage the expected bearish countertrend decline and hit the 20-day moving average (support) seven days later on 25 July 2023.
Disclaimer
This article is for general information purposes only, not to be considered a recommendation or financial advice. Past performance is not indicative of future results.
Opinions are the author's; not necessarily that of OANDA Corporation or any of its affiliates, subsidiaries, officers or directors.
Leveraged trading in foreign currency contracts or other off-exchange products on margin carries a high level of risk and is not suitable for everyone. We advise you to carefully consider whether trading is appropriate for you in light of your personal circumstances. You may lose more than you invest. We recommend that you seek independent financial advice and ensure you fully understand the risks involved before trading.


