Comparing Biden and Trump in terms of economic metrics: how can their previous performance be judged? In this article, we discuss six metrics that can be helpful when navigating the successes of these two previous presidents of the United States of America. Read more.
Introduction
The 2024 US Election Day is fast approaching, and US voters may end up having to face the same choice again between Donald Trump and Joe Biden.
Voters can make their choice based on different factors, including but not limited to, economic growth, immigration, and foreign policies; however, the state of the economy and its growth often tend to be at the forefront of voters' minds when making their final choice.
Voters can also assess economic growth differently depending on how they measure it; some may use economic indicators such as GDP growth or inflation, while others may look at US dollar status or the equity markets for clues on which president’s economy performed better.
Although government policies play a significant role in economic growth, they are also heavily affected by factors that may not be politically related. The US economy is mainly driven by consumer spending, the interest rate environment, monetary policy, exports, imports, and global competition, to name a few.
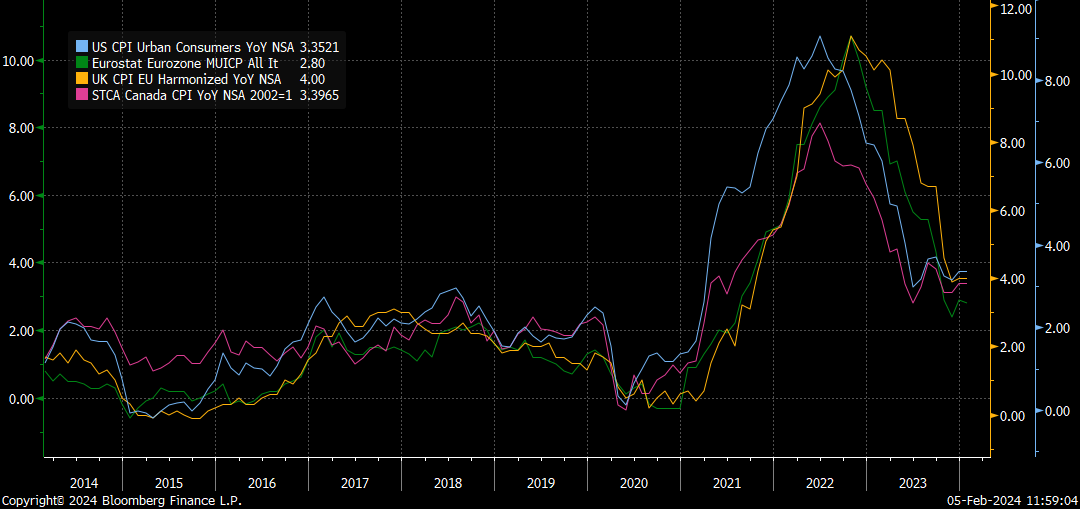
Any presidency may encounter different challenges; an example would be how US economic growth dropped during Trump’s last year of office and recovered shortly after COVID-19. The same was true for Biden’s presidency, as disruptions to raw materials and global supply chains heavily affected inflation in the US and globally; the chart below compares US inflation to other major global economies as an example.
Each presidency also faced different and unique economic challenges. Trump went through a period of historic low interest rates and a once-in-a-lifetime pandemic; on the other hand, the Biden administration encountered a high interest rate environment, global inflation, and two wars.
The economic conditions surrounding each presidency created unique opportunities for traders who incorporated fundamental Analysis into their trading strategies. We will highlight examples of how particular market instruments reacted to the two presidencies during their election week and throughout the entire four-year term.
2016 - Donald Trump
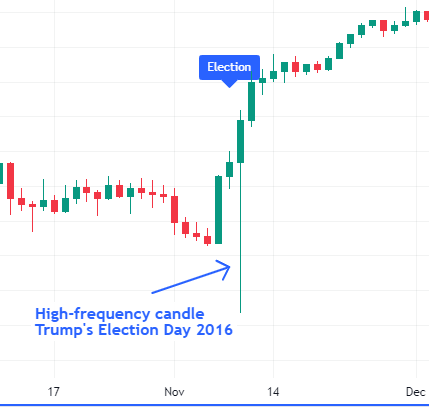
Before election day in 2016, Trump promised voters many economic changes, including tax cuts, import tariffs on Chinese products, and revising and renewing trade agreements between the US and other nations, including major trading partners such as Canada and Mexico. Donald Trump's economic plans led some traders to fear that the changes may lead to unchartered territory and unforeseen outcomes. The chart below is for the Dow Jones Industrial Average; on election day, the fear led some traders to sell, thus pushing prices down by almost 4.7%, and shortly after Trump was announced as the winner, it rose back up by 6.75% within the same day. Markets resumed their uptrend after shrugging off those fears.
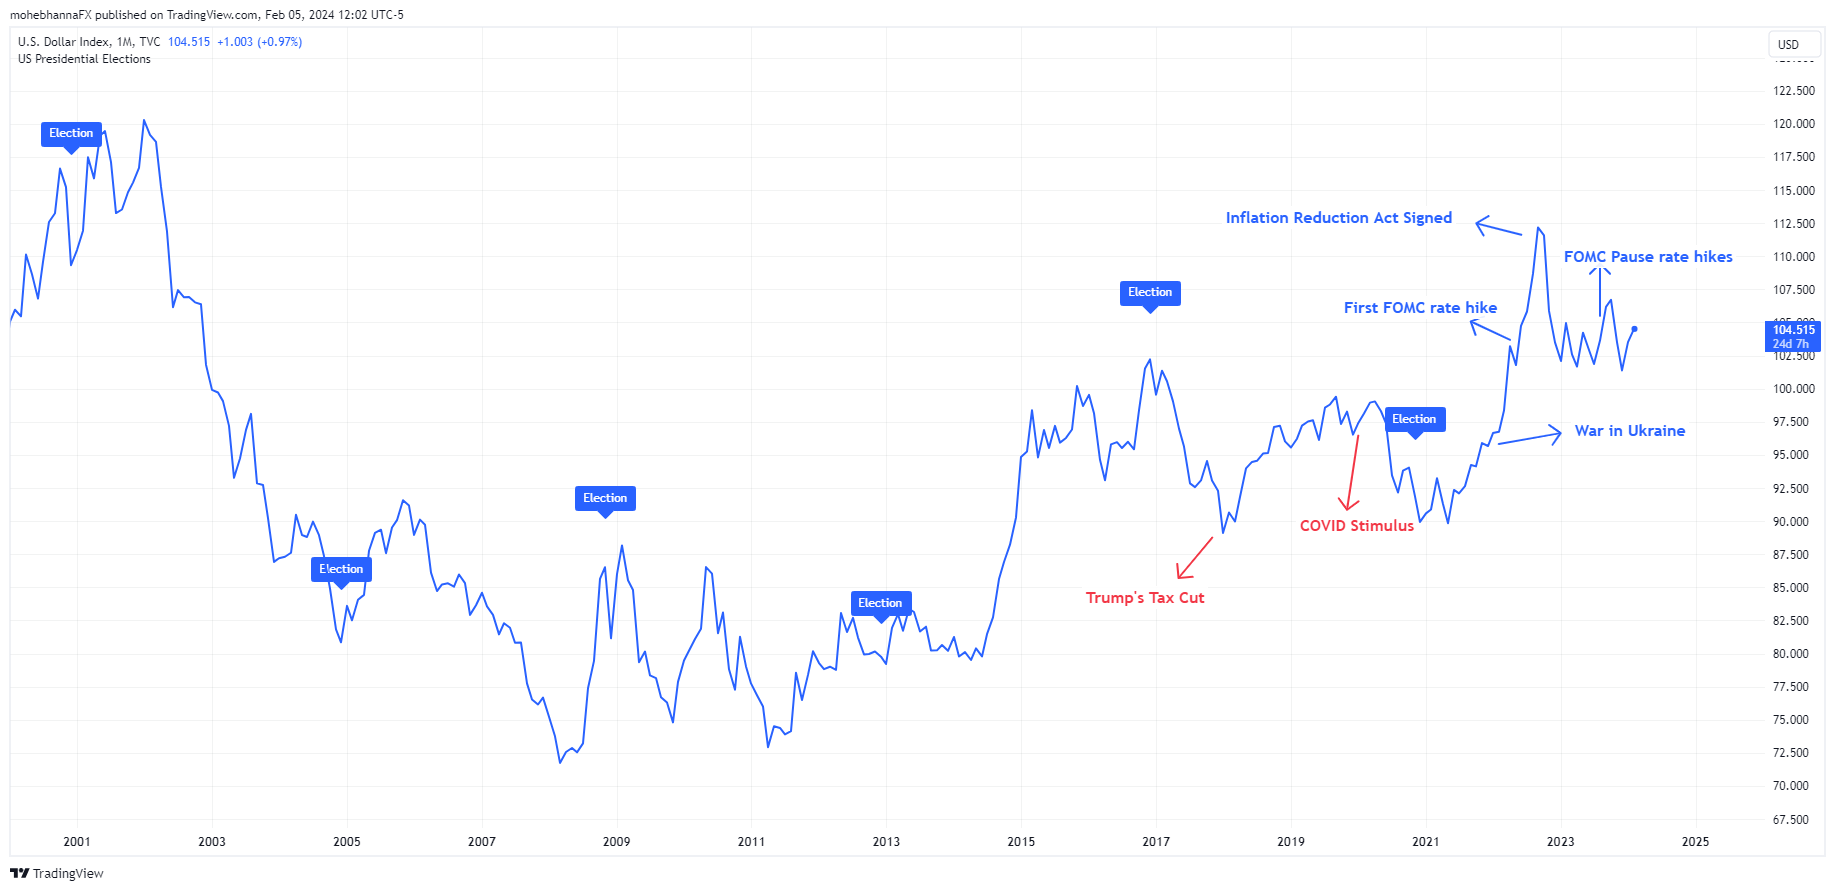
As for Trump’s presidency duration, an example can be the Trump’s Tax Cuts and Jobs Act, which had an inflationary impact on the US Economy; tax cuts are known to have an inflationary effect as they increase the demand for products, and one way to avoid that is to have a corresponding cut in Government spending which hasn’t happened. This led to a surge in the US Dollar as traders included it in their inflation expectation and interest rate hikes on the US Dollar, which eventually led to a higher USD against other currencies.
2020 – Joe Biden
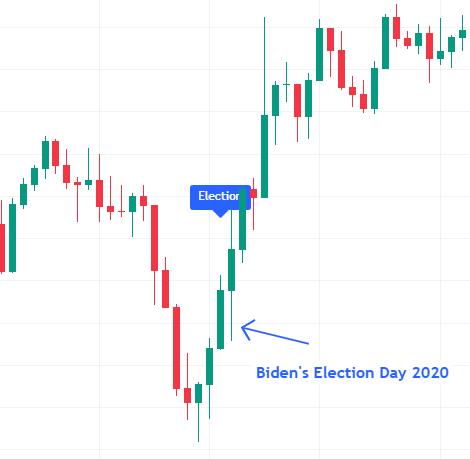
The Pandemic shadowed Biden’s election day in 2020; markets declined earlier in the year and were recovering after the COVID-19 Stimulus. The month before the election, the Dow Jones Industrial Average fell by almost 10%. As Election Day approached, it increased by nearly 15%, thus reflecting the same volatility seen during Trump's Election Day but over a more extended period. And again, markets resumed their uptrend after shrugging off the fears.
As for Biden’s presidency duration, an example can be the Inflation Reduction Act, which, as the name implies, aims to reduce Inflation, which began to fall in mid-2022, thus leading to DXY declining nearly 15% over five months.
We also highlighted a few of the most important economic indicators and their progress during both administrations; the charts are set from 2008 so we can understand them and have reference points for an overall view and additional comparison options.
Election and Gross Domestic Product (GDP)
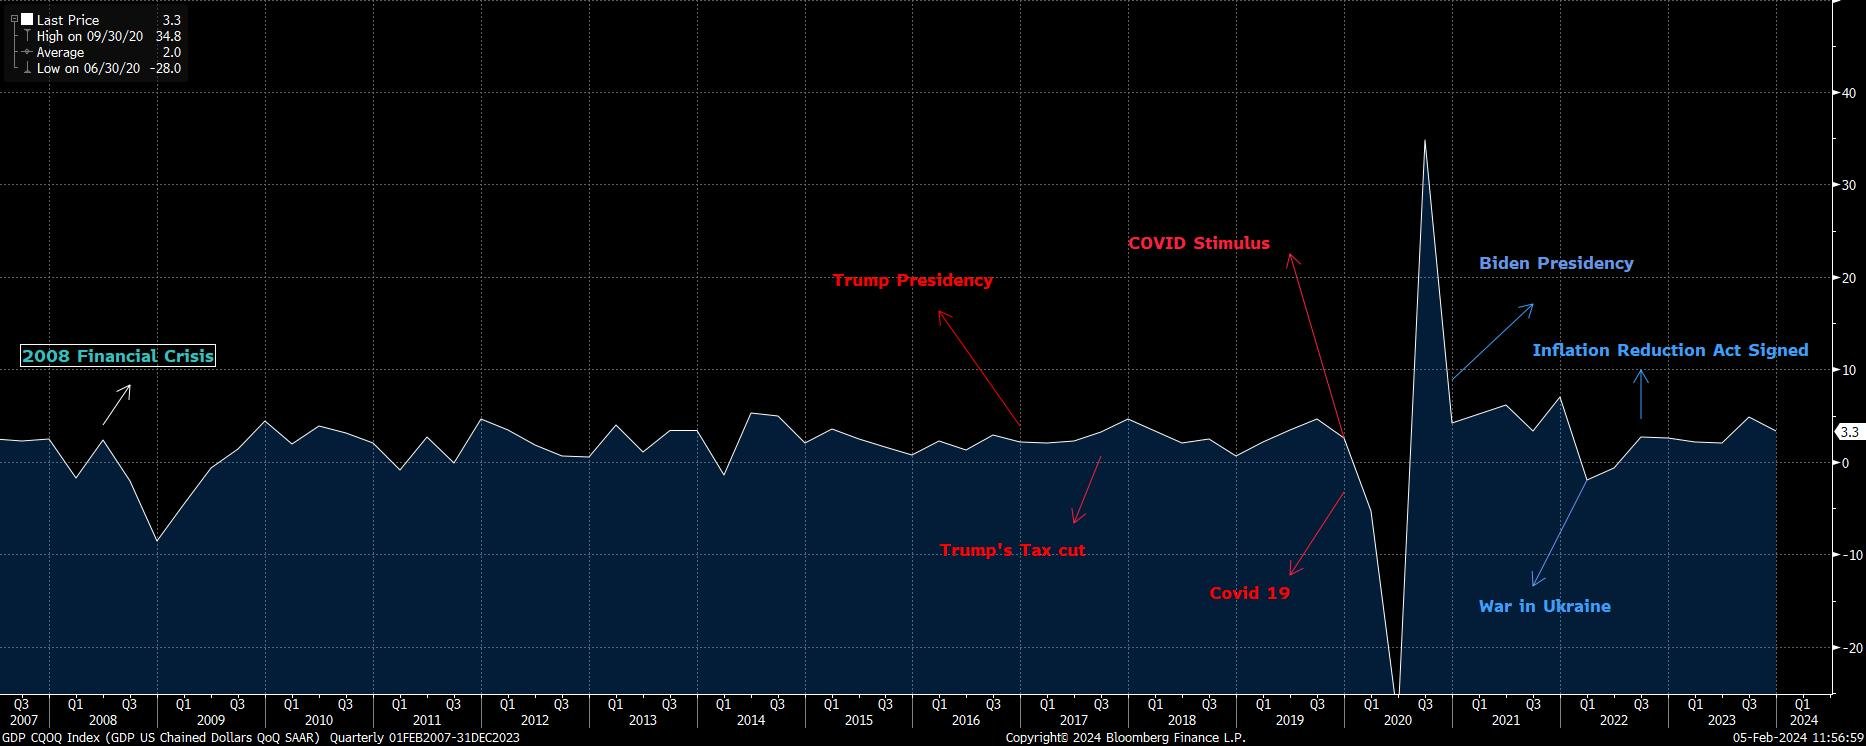
The Trump presidency witnessed steady Gross Domestic Product (GDP) growth and economic expansion; the policies implemented by the administration, including the Tax Cuts and Jobs Act of 2017, deregulation, and government spending, kept a positive GDP during the presidency aside from a the period in which the initial outbreak of COVID was affecting world economies, which can be considered an exception. The administration also implemented tariffs on China, which had a mixed impact on various sectors of the economy.
On the other hand, Biden’s presidency started with the pandemic effect, a historical surge followed by a historical decline, taking GDP back to its pre-pandemic average growth levels.
GDP continued to grow during the Biden administration, except for three months in early 2022, when GDP dropped from a peak of 7% to -2%. The drop preceded the war in Ukraine and the first FOMC rate hike.
Shortly after, GDP growth resumed and returned to its average growth range, which currently reads 3.3%.
Infrastructure investments, the American Rescue Plan Act, and the many fiscal policies implemented by the administration are considered the main factors in determining GDP growth performance under President Biden.
How the different presidents impacted Inflation
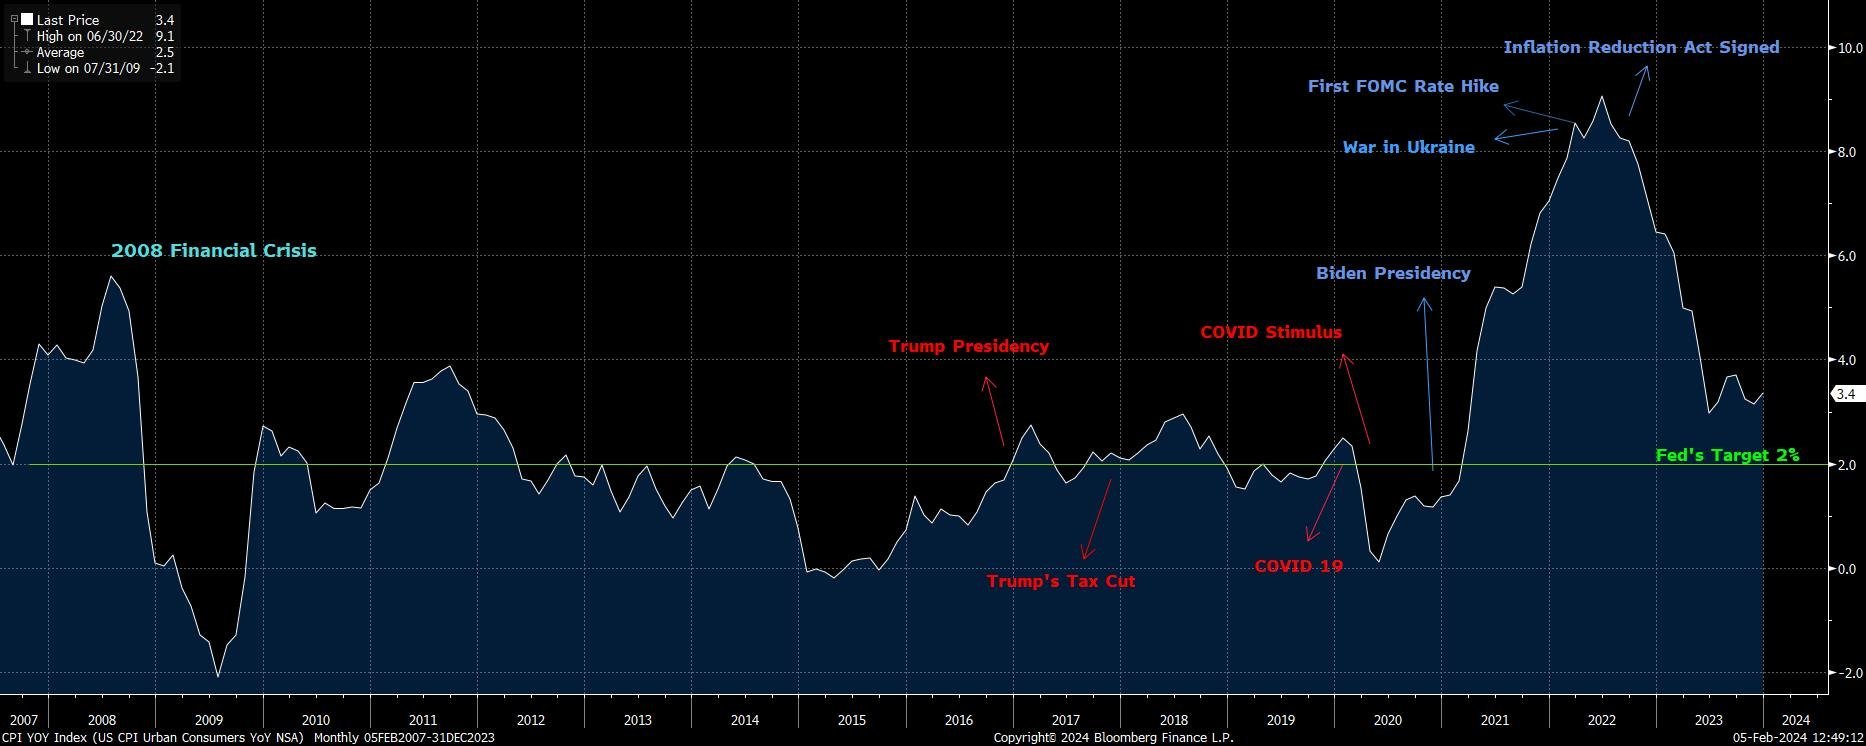
The above chart highlights how the Consumer Price Index (CPI), an inflation measure, performed from 2006 until January 2024.
Inflation during most of Trump’s presidency remained near the 2% target rate most of the time; notwithstanding a few minor spikes above 2% that took place; the most noticeable of them was shortly after the Trump Tax Cuts, where the CPI reached 3%, which shortly corrected back to the 2% target.
During Trump’s last year of presidency, COVID-19 began, and inflation dropped significantly due to economic inactivity early in the pandemic. The FOMC had to cut interest rates down considerably to 0% to avoid a recession.
However, as the COVID stimulus bill intended to help American households and businesses during the pandemic was signed by the Trump administration and went into effect in early 2020, inflation gradually rose.
As for Biden’s presidency, the pandemic effects remained, the COVID stimulus continued, and Biden’s presidency faced a shortage in raw materials needed for manufacturing and supply chain disruptions resulting from the pandemic. These factors and others led to a significant inflation spike, reaching historic levels.
The conflict in Ukraine also impacted inflation, although it didn’t last long. A spike in oil prices at the beginning of the war contributed to the later part of the inflation peak. During Biden's presidency, the Inflation Reduction Act of 2022 aimed to reduce inflation in the long term by possibly reducing the federal government budget deficit, lowering some prescription drug prices, investing in domestic energy production, and promoting clean energy.
As inflation peaked in early 2022, the Federal Open Market Committee (FOMC) raised interest rates 11 times in two years, bringing inflation closer to the Fed’s target rate of 2%. The current inflation rate is 3.4%, and the markets remain divided over the Fed’s rate cuts path for 2024, the final year of the current Biden’s term.
Post election impact on employment - Job Openings
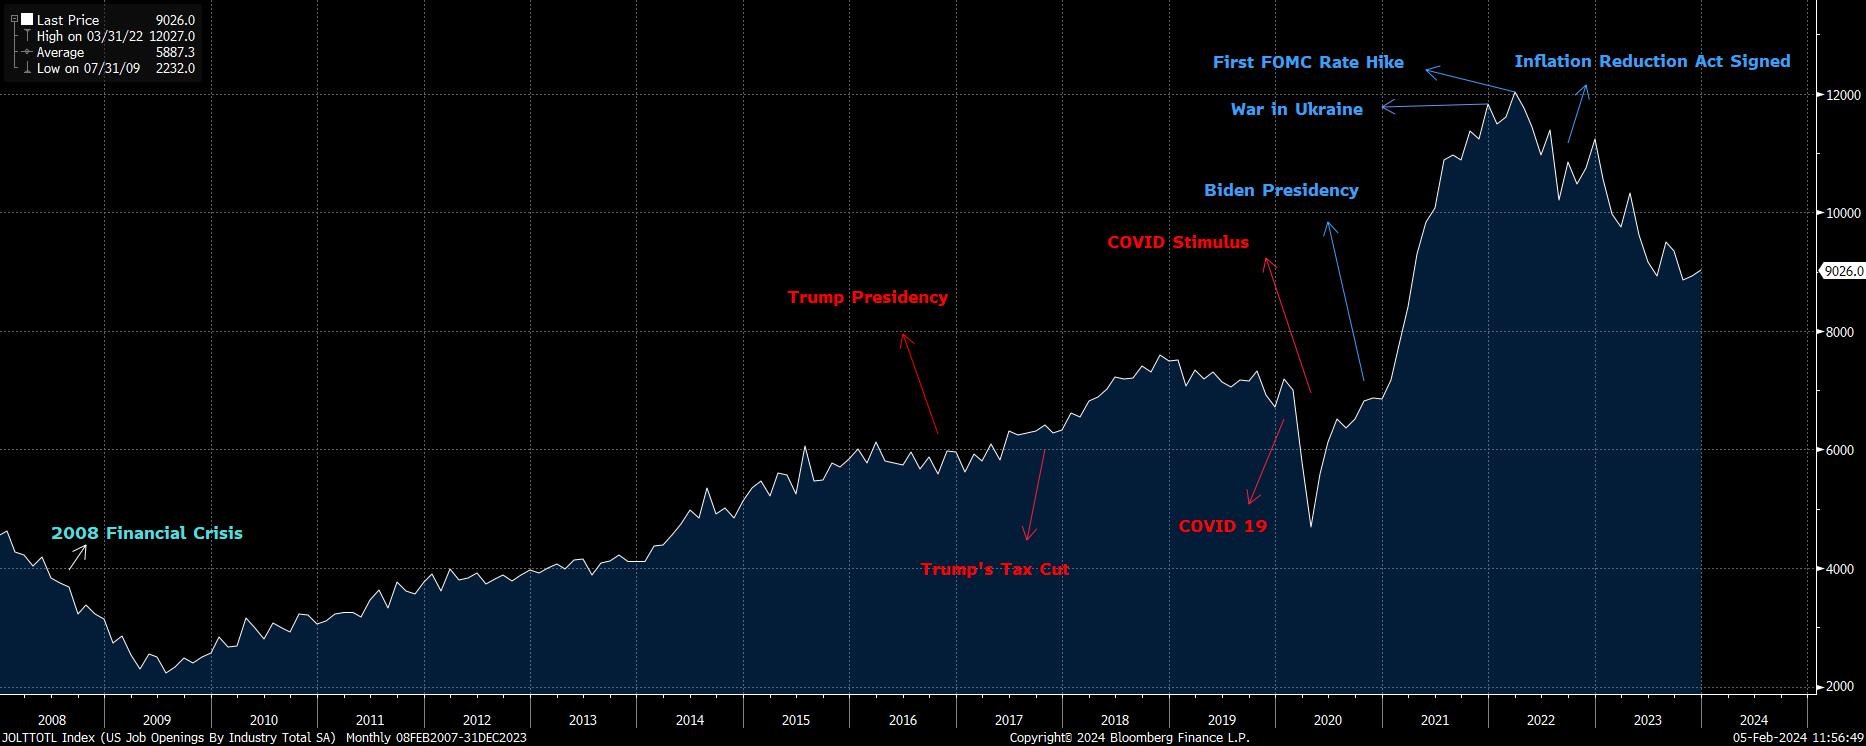
The number of job openings, excluding the farming industry, grew differently during both presidencies. The Trump presidency witnessed steady job growth, which lasted until the end of 2018; during that time, job openings increased by approximately 1.6 million, reaching a peak of 7.6 million; however, the job openings declined during 2019 by around 900,000.
As COVID kicked in, job numbers fell sharply; however, job openings rebounded to Trump’s term job opening averages.
During Biden’s term, job growth grew significantly, reaching a new high of 12 million in March 2022, followed by a decline, with a current reading of 9 million.
The remarkable job performance during the Biden administration resulted from the post-COVID rebound, the economic growth during his term, and the fiscal policies implemented by the administration, including the American Rescue Plan Act passed by Congress in early 2021.
Comparing Biden and Trump: Unemployment Rates
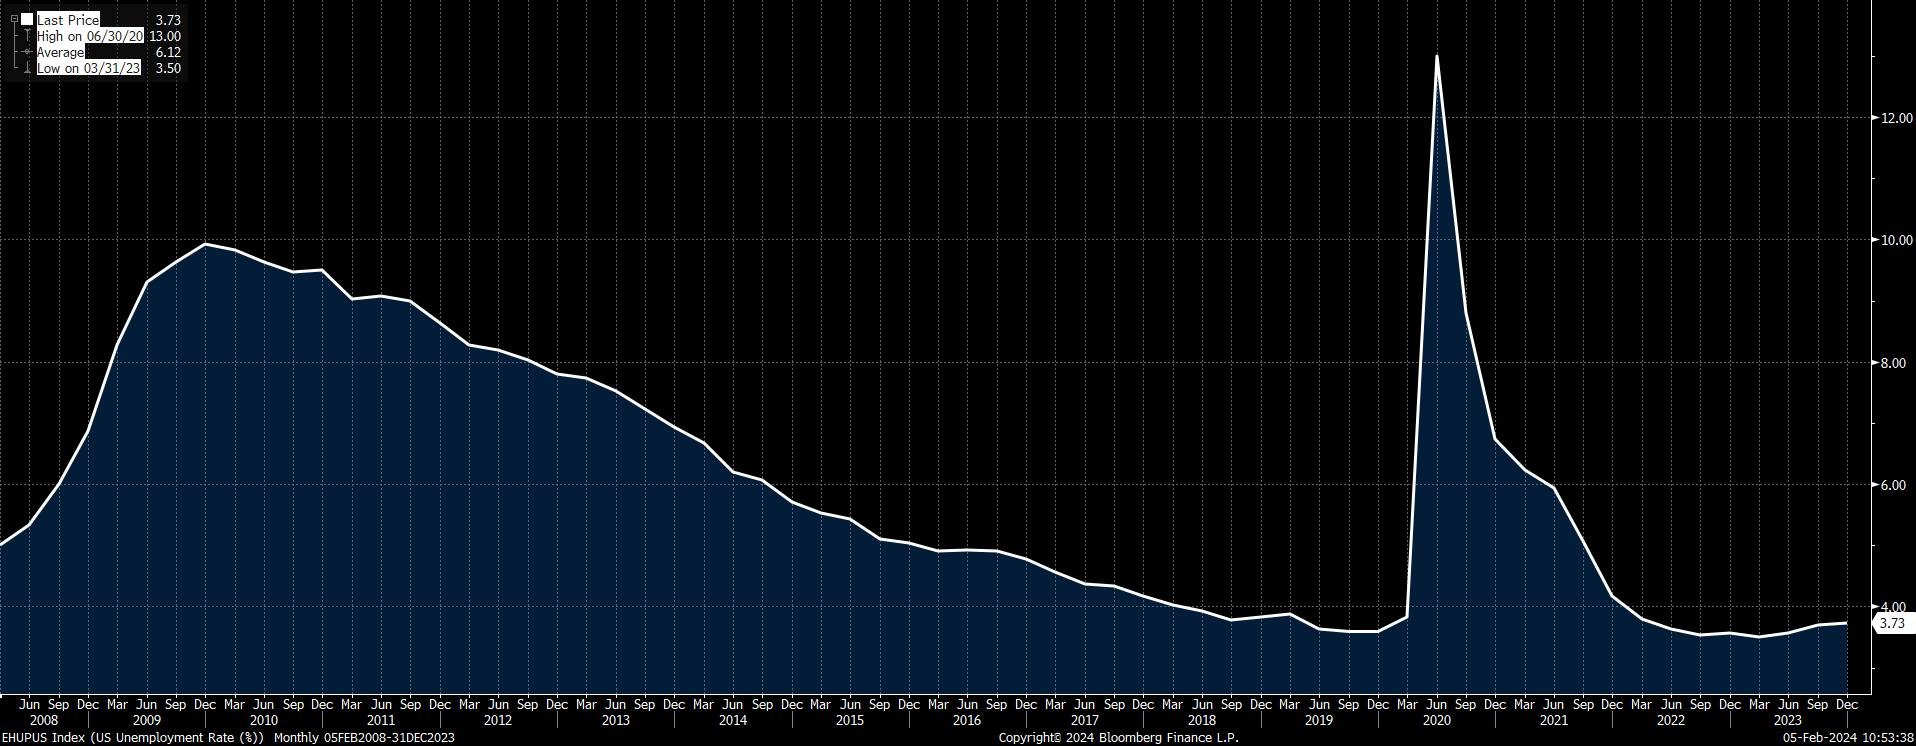
Job growth during the two presidencies kept unemployment rates low for an extended time; the COVID era was the only exception, as the unemployment rate spiked up, reaching 13% and rebounding back to its averages as the pandemic peaks ended. The unemployment rate during the Trump presidency dropped from 4.8% to a low of 3.6%, and as Biden’s presidency kicked in, the unemployment rate remained at its current historic lows and remained in the 3.5% to 3.8% range.
Effect on Equity Markets
Although the stock market is not the economy, it is considered a leading indicator of where investors believe it is headed.
Even US presidents have previously used the stock markets in speeches to gauge their performance. Traders and investors buy companies' stocks based on their estimate of how much they believe a stock is currently worth and how much appreciation in value they can expect in the future; therefore, many consider the stock market as a barometer for the economy, especially since its data is easily accessible and on the news 24/7.
It is also easier for the average individual to follow the stock markets than to dig into economic theories and spend time analyzing more complicated economic indicators.
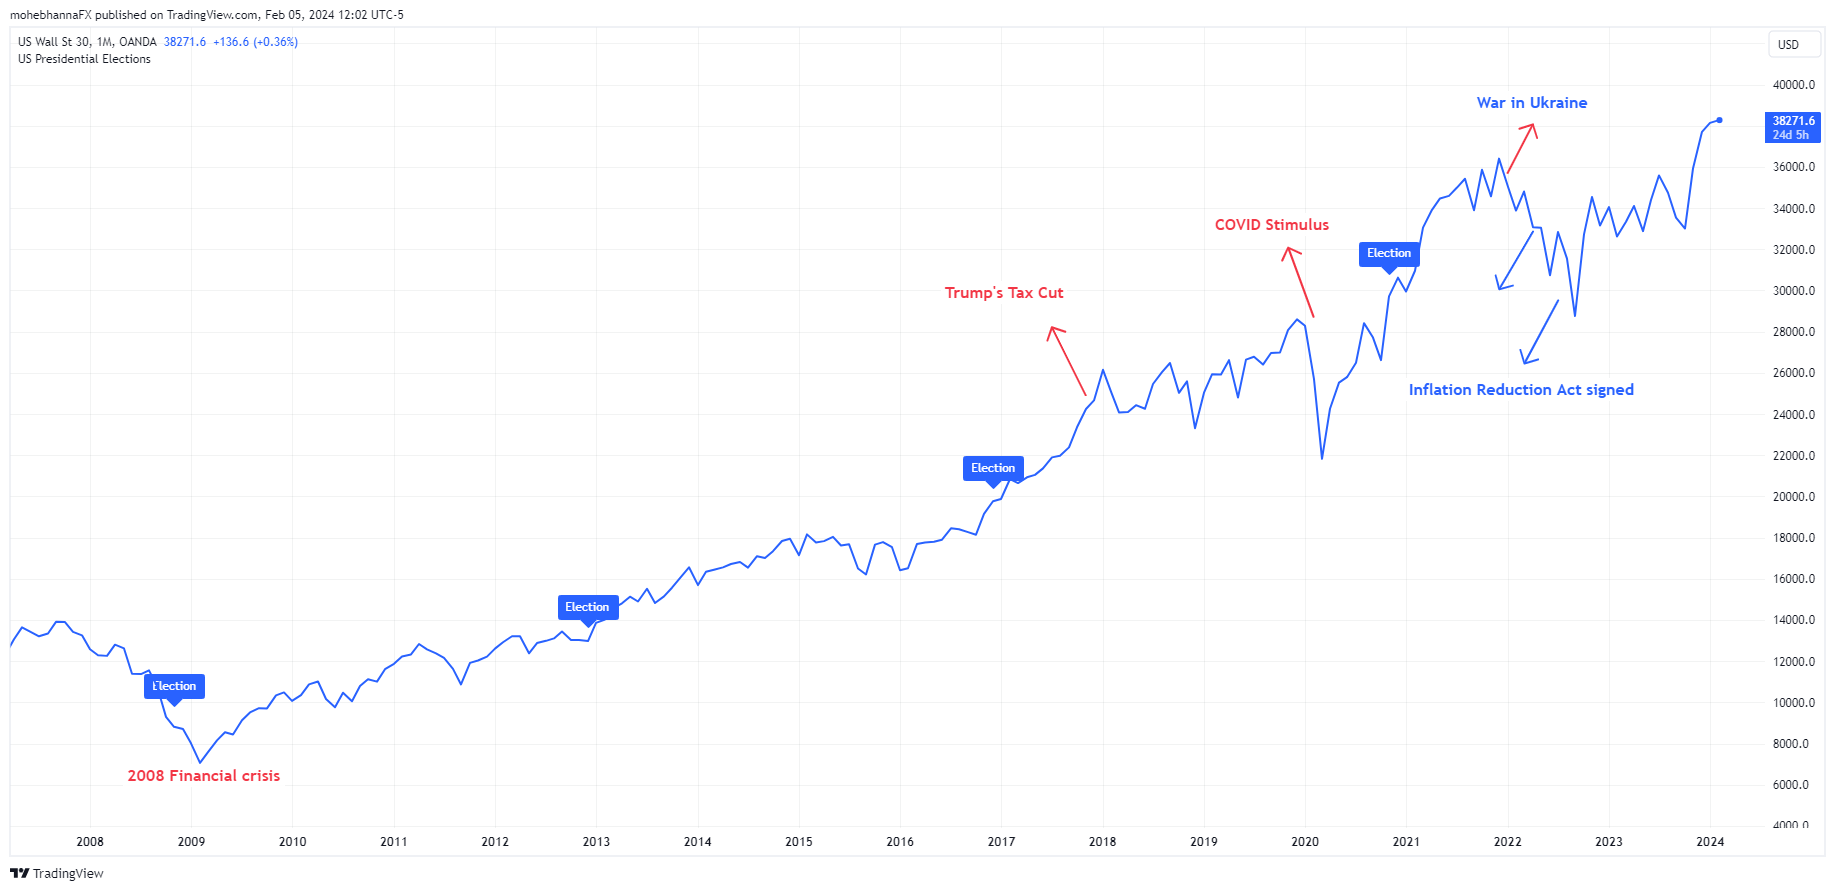
The stock market continued to grow during both presidencies and has been in an uptrend since 2009, when it recovered from the 2008 financial crisis. During the Trump presidency, equities enjoyed steady growth with average corrections, except for COVID-19, when they dropped sharply and recovered to resume their uptrend.
As for the Biden administration, the stock markets continued their uptrend, reaching historic highs as the Dow approached the 39,000 level. The uptrend was interrupted by two significant events in early 2022: the war in Ukraine and the first FOMC interest rate hike.
Dollar strength (DXY) under Biden and Trump
The US dollar is a unique currency that may appreciate or depreciate for different reasons; it is the world’s reserve currency and a haven that investors flock to at times of uncertainty. It is also highly impacted by US economic performance and interest rates. The US dollar significantly declined as Trump assumed the presidency in 2016. The DXY fell from 102.00 to 89.00, then recovered to 93.00 as Trump’s presidency ended. It is worth remembering that COVID significantly impacted the weakness of the USD during Trump’s last year as president.
The DXY's initial reaction as Biden took office was a decline; however, it wasn’t as much as the decline witnessed when Trump did. The index declined from 93.00 to 90.00, and shortly after, it began its recovery back up to 112.00 in September 2022. The US dollar's appreciation during Biden’s presidency was mainly due to the Federal Reserve interest rate hikes and the war in Ukraine. The dollar index declined from its peak at 112.00 and has been trading from 102.00 to 106.00 since October 2022.
Summary
Regardless of a trader's strategy or market approach, traders may take into consideration any important global political events such as the US Elections. Understanding what may happen to different market instruments before, during and after an election is critical, traders can utilize their knowledge to make trade decisions based on the election expectations and their impact on the economy or by simply deciding to avoid the risk and sit by the sidelines until the wave is over. It is also important for traders to understand the big picture or the political risks that may arise under any presidency.
Disclaimer
This article is for general information purposes only, not to be considered a recommendation or financial advice. Past performance is not indicative of future results.
Opinions are the author's; not necessarily that of OANDA Corporation or any of its affiliates, subsidiaries, officers or directors.
Leveraged trading in foreign currency contracts or other off-exchange products on margin carries a high level of risk and is not suitable for everyone. We advise you to carefully consider whether trading is appropriate for you in light of your personal circumstances. You may lose more than you invest. We recommend that you seek independent financial advice and ensure you fully understand the risks involved before trading.


