


How to read a candlestick chart

Just open any trading platform and you’ll see them everywhere: a sequence of coloured bars, of varying lengths, with thin lines at either end. This is the candlestick chart. Once you’ve learnt how to read a candlestick chart, the whole market will start to make much more sense to you.
The origins of the candlestick chart
Originating in Japan over three centuries ago to monitor the rice market, this system allowed merchants to analyze market psychology and anticipate prices. This method proved so accurate that modern traders still rely on Japanese candlestick charts today for their market analyses.
Their defining feature? The ability to synthesize four key data points into a single, highly intuitive shape.
Anatomy of a candle: the four key prices
The trading candlestick chart is effective because each element reveals price action within a specific timeframe, highlighting the session's open, close, high, and low.
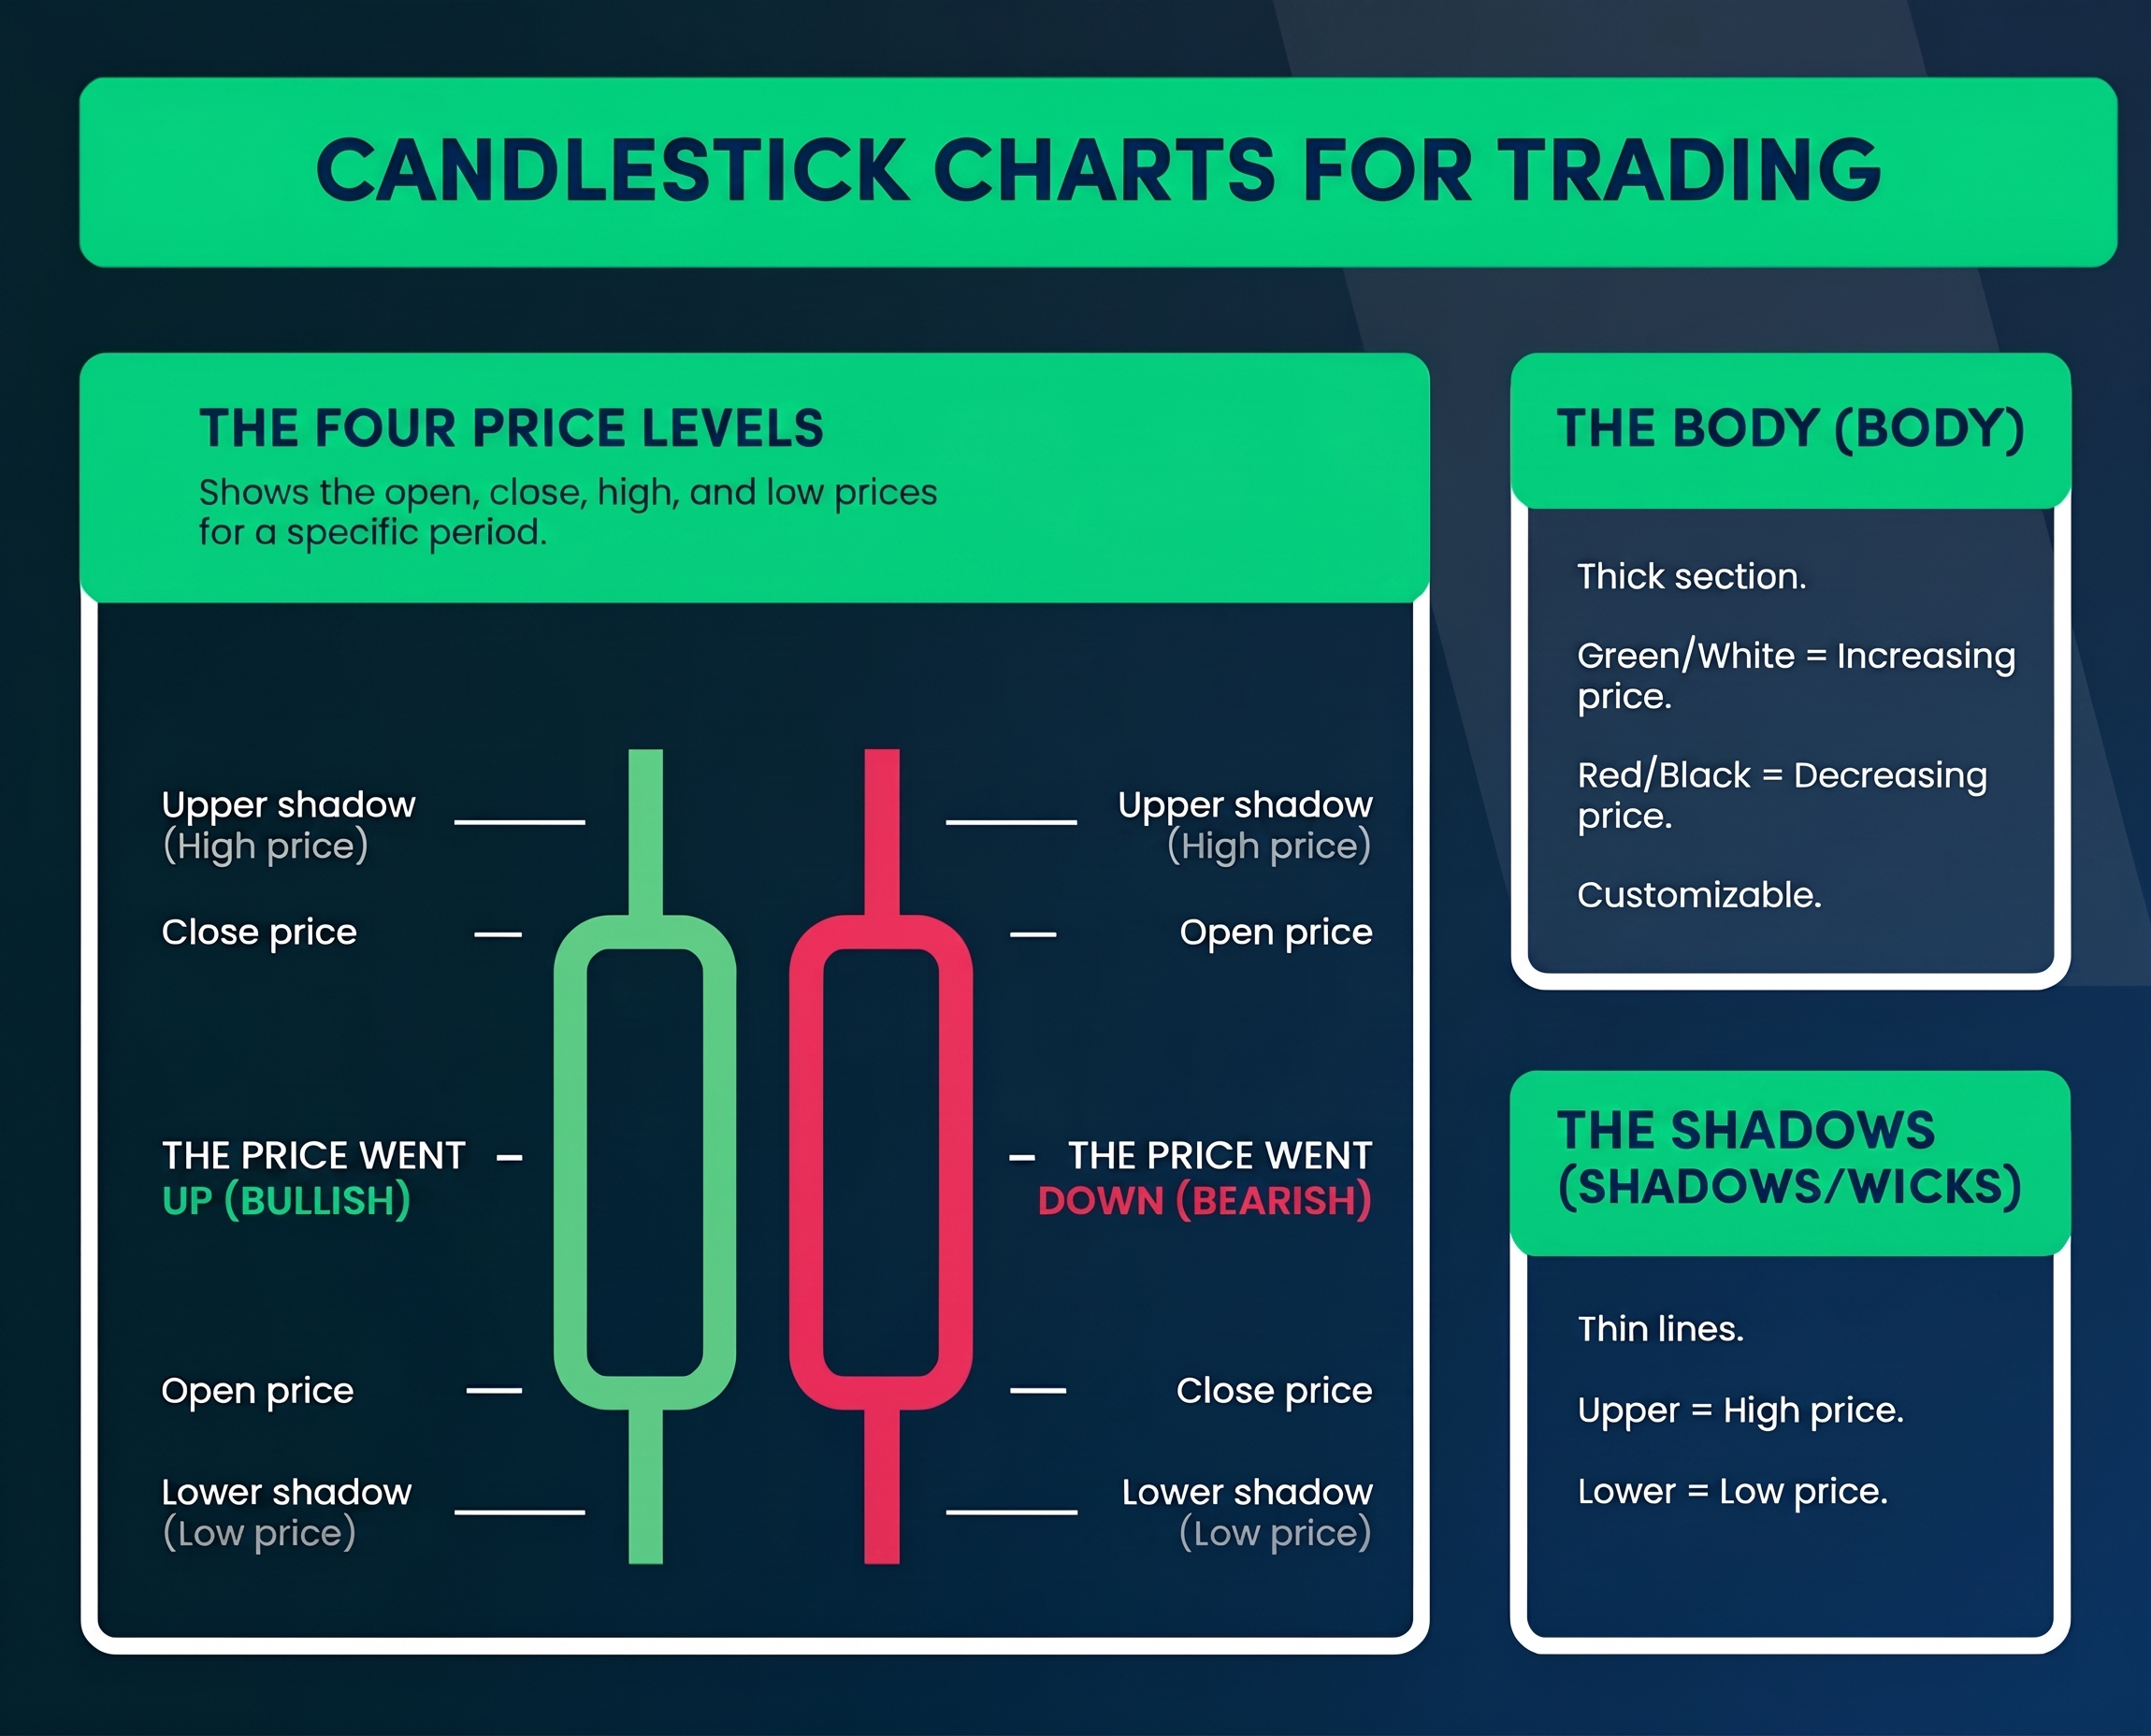
Legend: Anatomy of Japanese candlesticks
The thicker central section is called the body. Typically, a green or white body indicates a price increase, while a red or black body signals a decline. Most trading platforms still allow you to customize these colors to your liking.
And those thin lines at the ends? Traders call them shadows or wicks. The upper shadow represents the highest peak reached by the price, while the lower shadow marks the lowest point before the close or reversal.
Beyond the numbers: interpreting market sentiment
This is where the analysis gets interesting.
A candle with a long body and very short shadows signals that one side (buyers or sellers) exerted complete control over the session. In this scenario, the opposing side mounted minimal resistance, and the price moved with decisive conviction.
Conversely, a candle with a tiny body and very long shadows tells a completely different story: despite strong market swings in both directions, the price closed near the opening level. In such a session, neither buyers nor sellers managed to prevail.
Knowing how to identify these differences is essential to understanding how to read a candlestick chart in a professional, informed manner.
The most reliable candlestick patterns
Certain chart patterns recur with extreme regularity and often signal potential future price developments: learning to spot them is crucial for seizing real market opportunities.
The Hammer, for example, features a small body at the top and a long lower shadow that resembles its namesake. When it appears after a downtrend, it suggests buyers are stepping in: despite the initial pressure, the market managed to react and rebound promptly.
Conversely, the Shooting Star is essentially an inverted hammer, characterized by a small body at the bottom and a long upper shadow. When spotted after a price rally, this formation warns that sellers could take control, as the market's attempt to push higher was rejected.
Finally, we have the Doji, a candle with virtually no body where opening and closing prices are virtually identical. Such a pause often signals market indecision that could precede an impending change in direction.
Strength in numbers: candlestick combinations
While single patterns offer valuable clues, it is through analyzing multiple consecutive candles that the market picture becomes truly clear.
The engulfing pattern is a prime example and involves two candles: the second candle completely "engulfs" the body of the first. When a green candle fully engulfs a red one at the end of a downtrend, it is very likely that buyers are taking over; conversely, a red engulfing pattern signals that sellers are gaining ground.
There are also more complex three-candle formations, such as the Morning Star and the Evening Star. These patterns are well known for signaling potential turning points in price trends. Learning to spot them on your MT5 charts can help you time your trades better, allowing you to plan market entries and exits much more effectively.
From theory to practice: how to get started
Understanding candlestick structure is fundamental, but applying it in live trading is a different challenge.
The best way to begin is by using a demo trading account, which allows you to navigate various charts risk-free. Explore forex pairs, indices, and commodities: you will soon notice how certain patterns recur cyclically across different markets. With practice, your eye will learn to recognize them instinctively.
A decisive factor at this stage is timeframe selection. A candle on a five-minute chart tells only a tiny fraction of the day, whereas the same pattern on a daily chart reflects the price action of an entire trading session. In general, higher timeframes provide much more solid and reliable signals, as they help filter out the market "noise" typical of the very short term.
The limits of chart analysis
It is important to remember that no pattern works 100% of the time: markets are not machines following pre-written scripts. Candlesticks show what has happened and suggest what might happen, but they offer no absolute guarantees.
Experienced traders use candlestick analysis in synergy with other tools. Support and resistance analysis helps contextualize signals, while trading volume serves as confirmation of the move's strength. Similarly, staying up to date with the economic calendar helps make sense of sudden shifts that elude pure technical analysis.
Our mobile app lets you analyze charts and trade on the go. You can follow pattern developments in real time and act promptly in the market without ever giving up full control over your trading.
Next steps
Learning to read Japanese candlesticks is an investment that requires dedication. The only way to gain true proficiency is by spending hours observing charts and analyzing every nuance of price action.
However, once these shapes become second nature, the way you view a chart will change forever. Prices will no longer be random numbers; they will tell the story of the constant tug-of-war between supply and demand, hesitation and conviction.
Start with the basics covered in this guide. Practice identifying Hammers, Shooting Stars, and Dojis, and then move on to more complex patterns. Within a few weeks, you will be surprised by your charting proficiency.
Latest blog posts:


Start trading now with fast account opening.
Sign-up now to trade the most active markets
Open account

