




Doji candlestick pattern: understanding indecision in trading

Understanding and using Doji candlestick patterns in your trading strategy will give you real-time windows into shifting market sentiment.
Doji candlestick patterns are useful tools because they signal market indecision that often precedes significant price moves, volatility spikes, or sharp trend reversals. When trading leveraged instruments, finding these visual cues let traders assess shifting market sentiment with elevated precision.
What is a Doji candlestick pattern?
A Doji candlestick pattern is a foundational visual element in technical analysis, characterised by a financial asset opening and closing at virtually the same price point within a specified timeframe. Originating from Japanese rice trading techniques in the 18th century, the term "Doji" translates roughly to "same time" or "blunder," reflecting how neither buyers nor sellers managed to secure control by the close of the session. Nowadays, the Doji stands out as a unique price action signal that reflects a temporary standoff between bulls and bears.
Key characteristics and visuals of a Doji
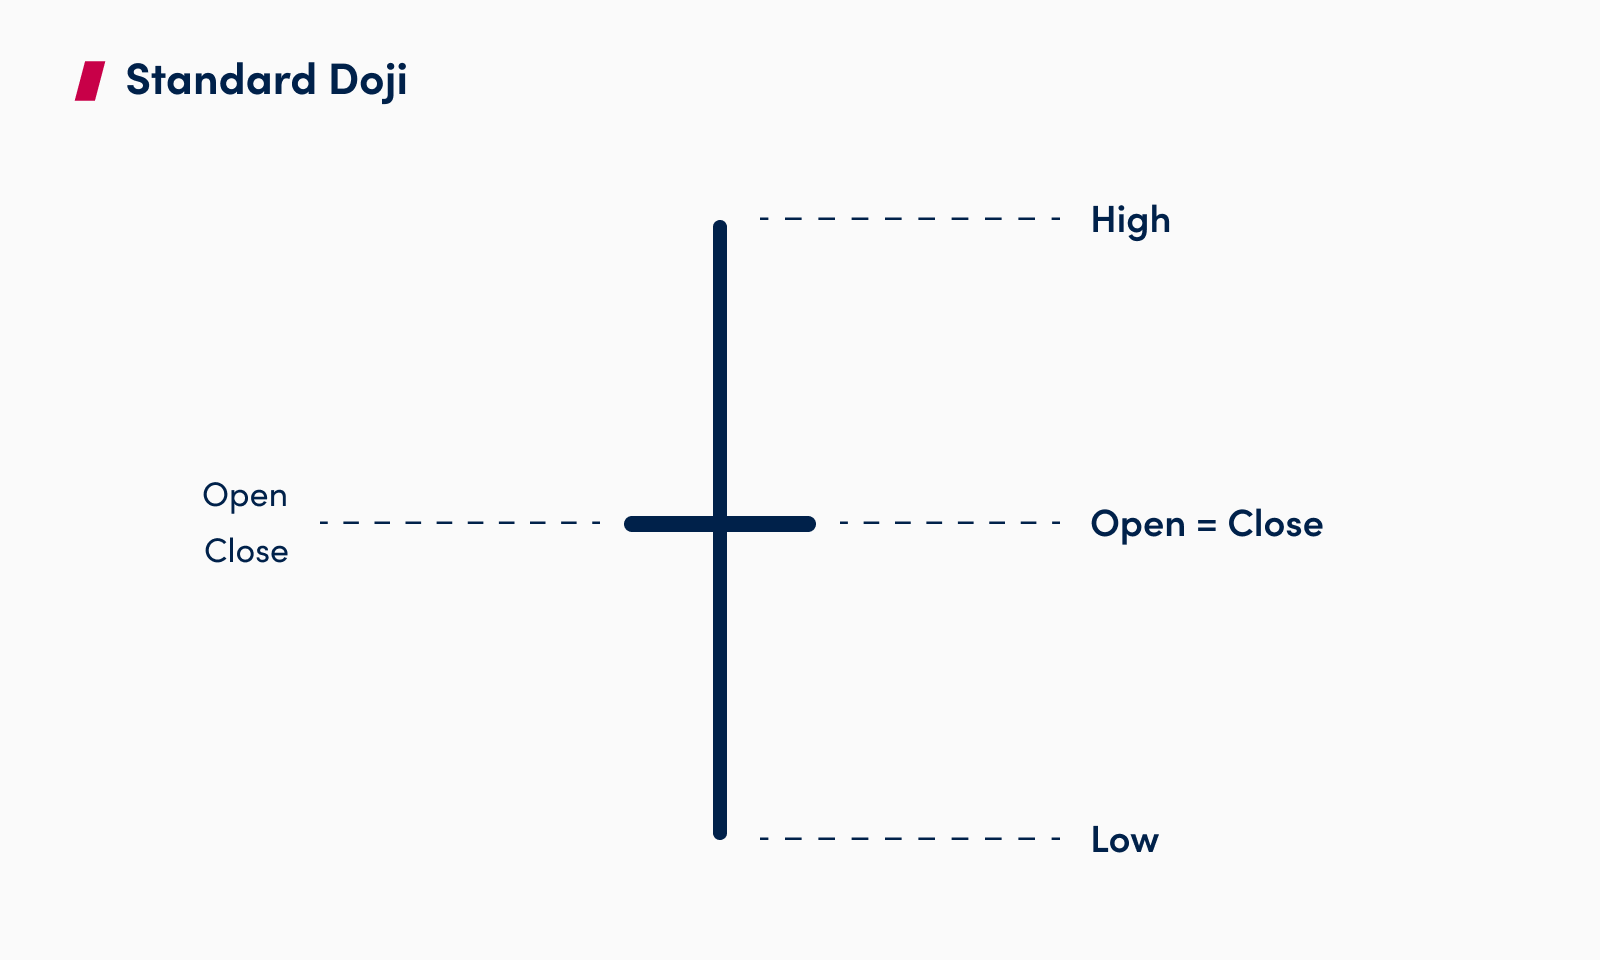
A Doji forms when an asset opens and closes at almost the same price. On a chart, you can recognise it by:
- Tiny or non-existent real body: The open and close sit so close together that the body shows up as a thin horizontal line.
- Upper and lower wicks: The vertical shadows mark the highest and lowest prices reached during the session.
- No solid rectangle: Unlike standard filled or hollow candles, a Doji stands out immediately on any charting platform.
- Balance at the close: Despite price swings during the session, supply and demand returned to near equilibrium.
These distinctive visual elements highlight that despite intra-session price fluctuations, supply and demand returned to an approximate equilibrium by the close.
The Doji as a signal of market indecision
Doji’s give a clear indication of market indecision, which means it’s important to understand them.During the active trading session, both buyers pushing price action upward and sellers driving prices downward cause pressure. But the buyer nor seller keeps dominance by the time the candle closes. This structural dynamic signifies a delicate balance or equilibrium between buying and selling forces over the specified timeframe. Recognising this signal of indecision gives retail traders a crucial foundation for interpreting market dynamic changes, forecasting potential momentum deceleration, and preparing for future price breakouts.
Types of Doji candlestick patterns
The Standard Doji
The Standard Doji serves as the baseline model within the broader family of Doji candlestick patterns. Visually, it has a near-invisible real body centered between short, balanced upper and lower wicks of roughly equivalent length.The Standard Doji signals a state of near-perfect short-term equilibrium between buyers and sellers throughout the trading period.
Long-legged Doji
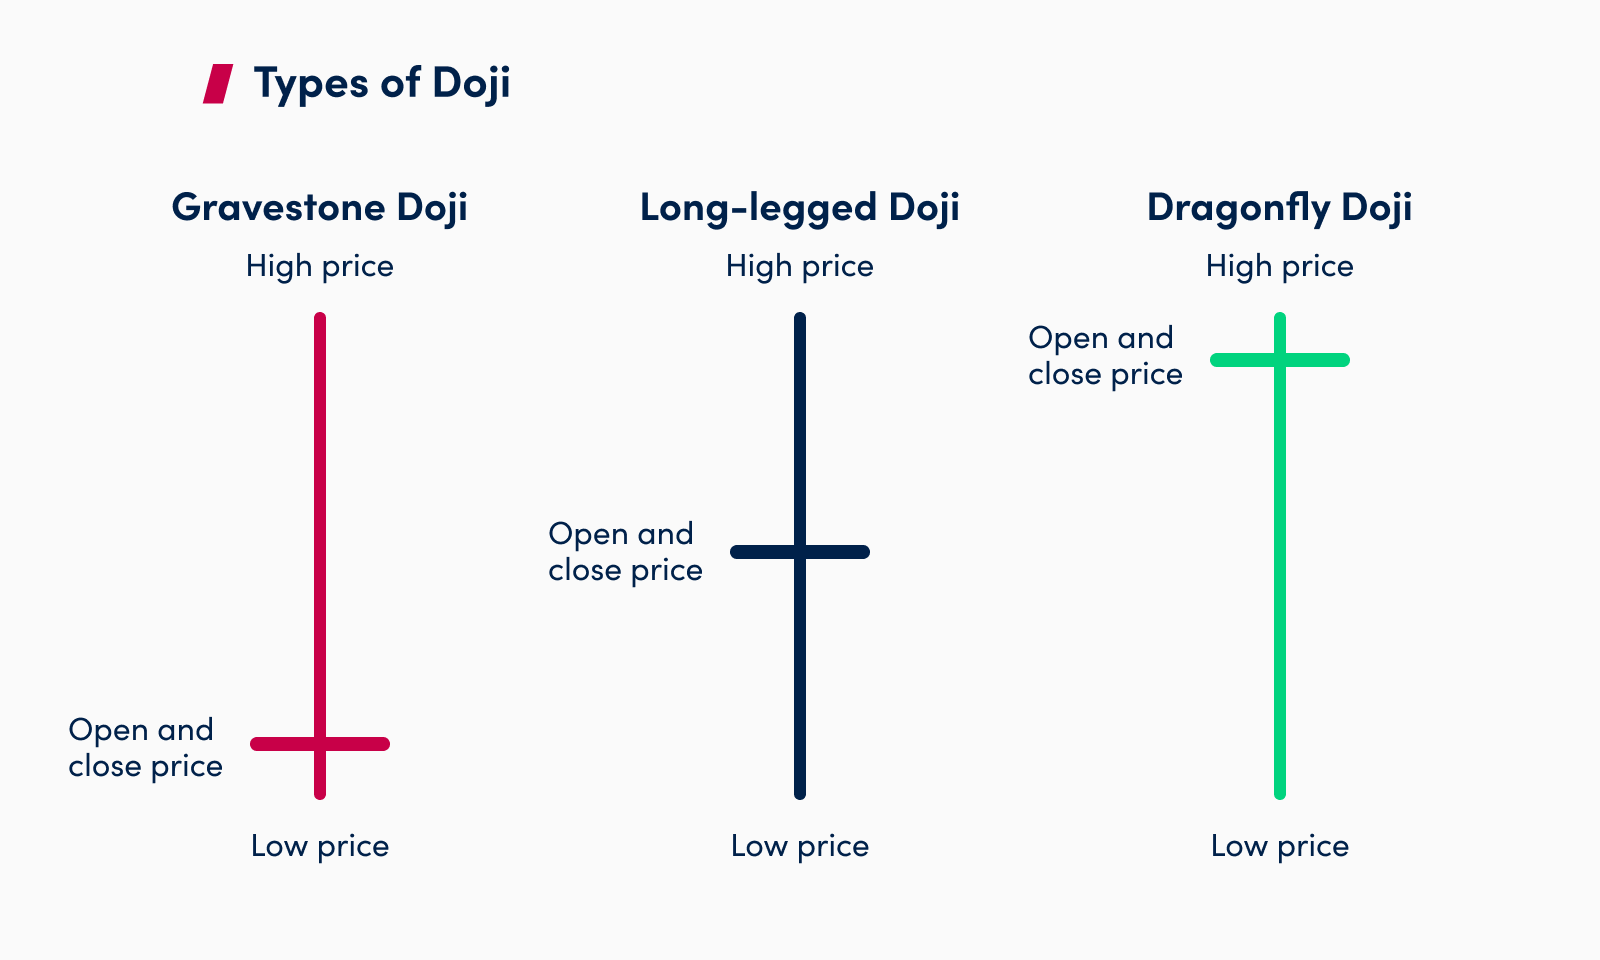
The Long-Legged Doji is distinguished by its expansive structural dimensions. It has unusually long upper and lower wicks extending significantly from a small, centralised real body.
While the Long-legged Doji still reflects overall market indecision at the close, the extended wicks reveal that significant price swings and elevated volatility happened in both directions during the session.
Dragonfly Doji
The Dragonfly Doji is a distinct single-candle pattern shaped like an uppercase letter "T". Visually, it features a long lower wick paired with virtually no upper wick, meaning the open, high, and close prices happened at or near the exact high of the period.
In active technical trading, the Dragonfly Doji is typically interpreted as a potentially bullish signal when located near key support levels or following a downtrend.
Gravestone Doji
The Gravestone Doji represents the inverse visual and behavioral structure of the Dragonfly Doji, resembling an inverted uppercase "T". Its visual form is a prominent upper wick paired with little to no lower shadow, indicating that the open, low, and close prices were concentrated at the session's bottom boundary. This dynamic shows that although buyers managed to propel prices higher early in the session, aggressive sellers entered the market to bring price action back down to the opening print by the close.
Four price Doji
The four price Doji is a rare, minimalist variation among candlestick patterns. Its sole defining characteristic is that the open, high, low, and close prices are completely identical throughout the entire trading period, resulting in a single horizontal line on a price chart. This unique pattern highlights extreme market indecision or, as is more common, a total absence of trading volume and liquidity during that specific timeframe.
Interpreting Doji patterns
The true predictive value of any Doji relies on evaluating where it forms in terms of current trends, volatility conditions, and structural chart levels.
Bullish and bearish implications of Doji
Because a Doji reflects neutral market indecision, its implication depends on the surrounding market structure. For instance, a dragonfly Doji forming after a prolonged downtrend suggests that buyers absorbed heavy selling pressure, a concept explored in the Wyckoff method, offering a potentially bullish setup.
Meanwhile, a Gravestone Doji emerging after a sustained uptrend indicates that buying momentum failed at elevated levels, presenting a potentially bearish outlook.
Overall, traders should integrate prior price action, volume profiles, and prevailing market dynamics to get actionable trading insights from these neutral formations.
Doji as potential reversal signals
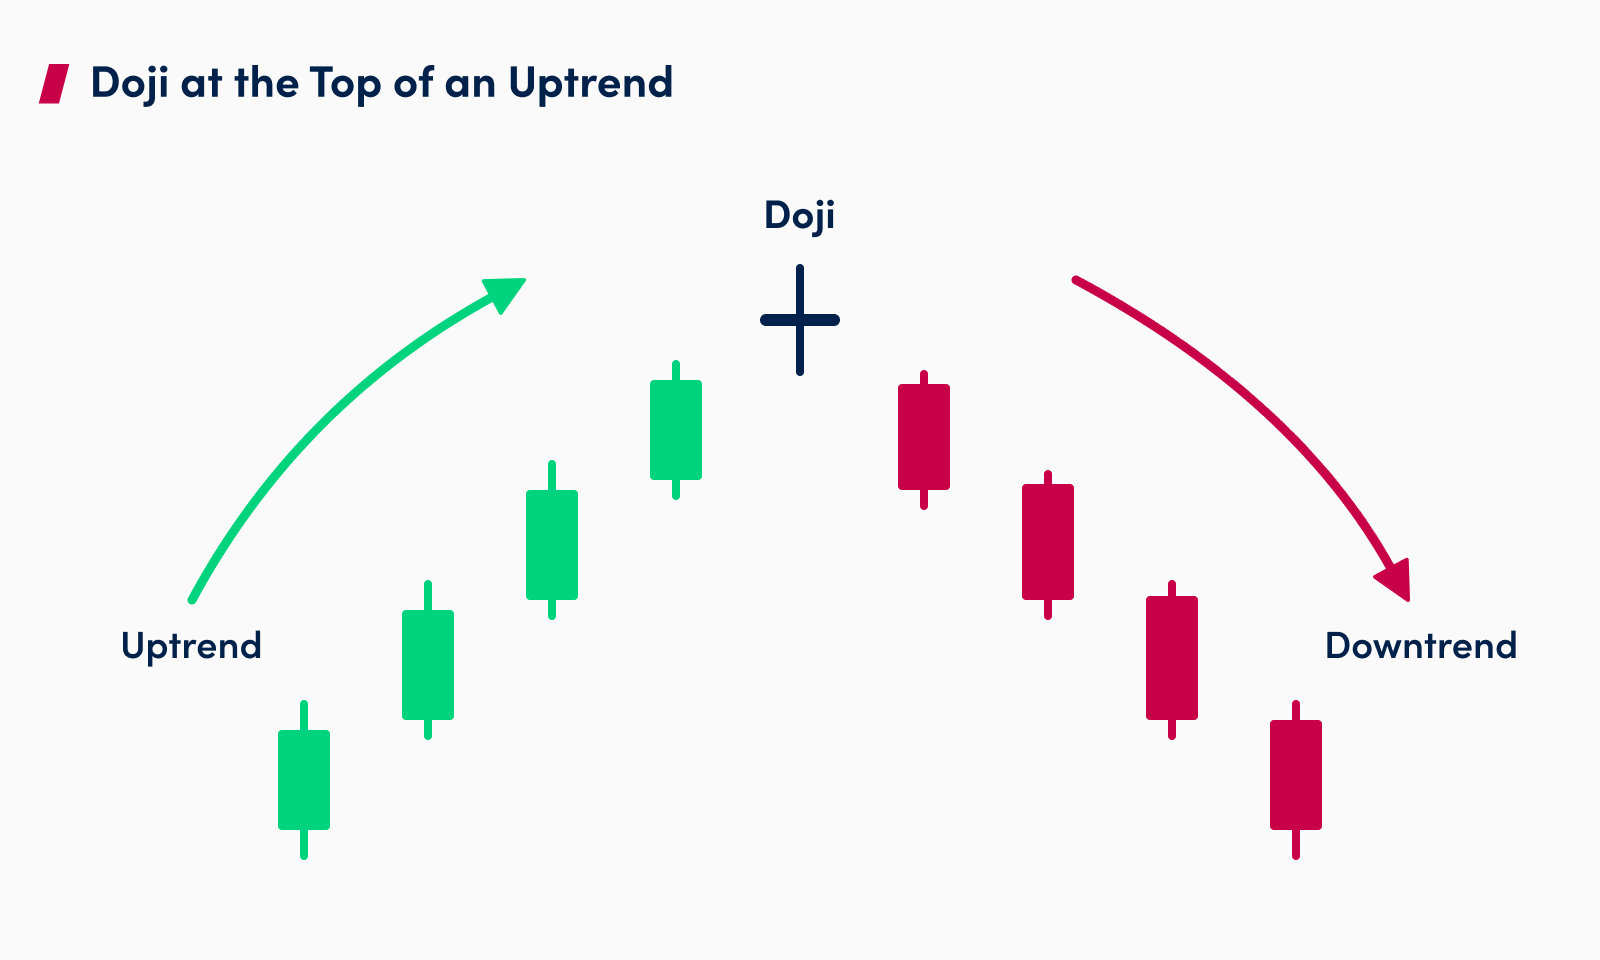
Doji candlestick patterns frequently act as early warning indicators for prospective trend reversals across various timeframes. When a Doji forms following an extended bullish or bearish trend, it suggests that the dominant market force is experiencing exhaustion and losing its directional control.
This sudden emergence of balance between buyers and sellers signals that the existing trend could be losing momentum, setting the stage for a period of consolidation or a sharp market reversal. Finding these potential inflection points allows traders to proactively adjust open positions, manage profit targets, and prepare for emerging trading opportunities.
Trading with Doji candlestick patterns
Formulating effective trading strategies using the Doji candlestick in forex, crypto or stock trading means combining their indecision signals with risk management rules.
Doji candles can effectively mark a trader's entry or exit points, but traders should require validation from the following price action before placing orders.
To build a robust trading strategy, traders should integrate Doji setups with complementary technical indicators rather than trading them in isolation. Overlaying tools like the Relative Strength Index (RSI), Moving Average Convergence Divergence (MACD), or key moving averages (such as the 50-day or 200-day SMA) helps filter out low-probability setups. Combining price action patterns with momentum oscillators and trend-following indicators significantly enhances the reliability of Doji-based strategy execution.
Examples of Doji candlestick patterns in charts
Examining Doji candlestick patterns within live market environments highlights how structural nuances, like wick length and closing locations,interact with surrounding support and resistance levels to generate actionable trading signals.
- Doji star patterns are multi-candle composite formations that incorporate a standalone Doji to get stronger price action signals.
- These multi-candle setups include reversal patterns such as the morning Doji star and the evening Doji star.
- And by combining a large directional candlestick, a gapping Doji, and a confirming third candlestick, these formations offer far greater reliability than a single Doji candle alone in a trading strategy.
In technical price action trading, the morning Doji star is a three-candle bullish reversal pattern that develops at the trough of a downtrend, signaling a shift from selling pressure to buying momentum. The evening Doji star forms at the crest of an uptrend, serving as a three-candle bearish reversal signal that alerts traders to potential downside risks.
Conclusion
Understanding the Doji candlestick pattern and its types is imperative as a trader and a useful tool to have in your strategy because it signals the moment just before large price moves, volatility spikes, or sharp trend reversals may happen.
FAQ
- What does it mean if a Doji appears in the middle of a strong trend?
A Doji appearing mid-trend usually signifies a temporary pause or indecision, not necessarily a reversal. Its primary significance is highlighting a balance between buyers and sellers, which may or may not lead to a trend change without further confirmation.
- Can a Doji be used as a standalone trading signal?
No, a Doji should generally not be used as a standalone trading signal. While it indicates indecision, its interpretation for bullish or bearish implications is greatly enhanced when combined with other technical indicators and analysis of prior price action.
- How do I differentiate between a Long-legged Doji and a standard Doji?
The main difference lies in the length of their wicks. A Standard Doji has short, similar-sized wicks, indicating a narrow range of price movement. A Long-legged Doji, however, features significantly longer upper and lower wicks, reflecting greater price volatility and stronger indecision during the period.
- What's the key difference in implications between a dragonfly Doji and a gravestone Doji?
The dragonfly Doji, with its long lower wick, is generally interpreted as potentially bullish, suggesting buyers overcame selling pressure.The Gravestone Doji, with its long upper wick, is typically seen as potentially bearish, indicating sellers pushed prices down despite initial buying pressure. Their reversal implications depend on the preceding trend.
- Why is the four price Doji considered so rare?
The four price Doji is rare because it signifies that the open, high, low, and close prices were all exactly the same during the trading period. This indicates extreme market indecision or a complete lack of liquidity and price movement, which is uncommon in actively traded assets.
The content here is for educational and informational purposes only. This material is not investment advice or a recommendation or suggestion of any investment strategy, and it does not provide investment advisory services. OANDA is not responsible for any investment decisions made based on this content. Investing involves the risk of a loss of capital. Past performance does not guarantee future results.
Latest blog posts:


Start trading now with fast account opening.
Sign-up now to trade the most active markets
Open account

