Making sense of trading terminology
Learning to trade can be a little daunting to begin with. Charting can look extremely complex to the untrained eye and terminology intended to simplify can instead be rather confusing. So here is a selection of some of the most common phrases used when discussing financial markets and what they mean.
Let’s start with the two kinds of analysis that traders often use when conducting their research.
Fundamental analysis
Fundamental analysis involves studying the underlying performance of an instrument and coming to a judgement on it against the current price in the market. For stocks, that can be financial performance, the launch of a new product or service, or overall the economic outlook etc. For currencies, it may be the economy and the outlook for inflation and interest rates.
Technical analysis
Technical analysis on the other hand, assumes all known information is already priced into the markets and instead utilizes charts to study trends and sentiment. Technical analysis traders don’t concern themselves with whether something is fundamentally overvalued or undervalued, instead utilizing a variety of charting indicators to determine what the price may do based on what it has done previously.
Scalping
Scalping is a trading strategy that involves staying in trades for a very short period of time. Scalpers seek to profit from small moves in prices and may enter and exit multiple trades per day. Due to the shortened timeframe of the trades, a scalper may be more inclined to use technical analysis rather than fundamental analysis, although that isn’t always necessarily the case.
Day traders
Day traders will enter and exit trades the same day and usually do not let open positions run overnight. This is a form of short-term trading, although positions will mostly be held for longer than you would typically see with scalping. Technical analysts may also favor this type of technique, although with data and results being released every day, it may also appeal to fundamental analysts.
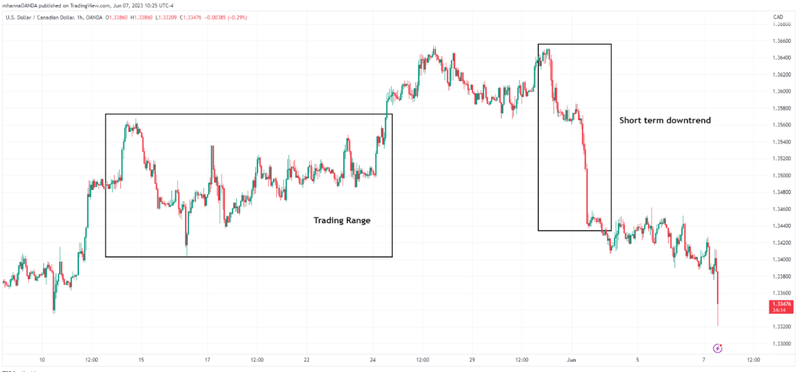
Scalpers and Day traders may look to identify trading ranges or short-term trends and place trades according to their strategies.
Swing trading
Swing trading is for those who are happy to hold positions overnight, often for multiple days, even weeks. Traders will often use medium to long term timeframes when conducting their research and may incorporate more fundamental analysis as economic releases and other events may have a significant impact on the outcome.
Position traders
Position traders focus more on the longer term, so fundamental analysis may be a more prominent feature of their research. Technical analysis can also be used, but when holding positions for many weeks, months, or even years, the fundamentals are likely to interact much more with the outcome. Fundamentals can often change over a longer period of time, although charts can help to identify when the tide is turning with fundamentals helping to explain and understand why.
Bull & Bear Markets
A bull market refers to a situation in which an instrument has been trending higher over a period of time. There’s no specific definition of what constitutes the start of a bull market, but it could be a 20% rise off the low in a bear market. Someone who is bullish believes that an instrument, like EUR/USD, is going to trend higher, whether or not it is in an uptrend or bull market at that point in time.
A bear market refers to a situation in which an instrument has fallen 20% from its peak. It’s often used in reference to stock markets, most frequently indices like the S&P 500, but it can be applied to other assets as well. Someone who is bearish believes that an instrument is going to trend lower.
Read more about the difference between bull and bear markets.
Corrections & Rallies
While an instrument often trends in a direction – higher, lower, or sideways – it doesn’t do so in a straight line. It can rally before reversing partially and then rally again. Equally, it can fall, recover a portion of those losses, and then fall again. The counter-trend component of this is referred to as a correction, or a corrective move.
A rally refers to the rapid increase in the price of an instrument i.e. EUR/USD has been rallying this morning on the back of stronger eurozone inflation data. Naturally, what constitutes a rapid increase is subjective so the term can often be used when describing general price increases.
Trading Positions and Risk Management
When a trader ‘goes,’ or is long an instrument, it means they expect the price to rise, whereas if they are short, they expect the price to fall. You may have heard the term short-sellers which is essentially a collection of traders that have speculated on an instrument falling and want the price to drop.
A stop-loss order is used to exit an open position, once the price hits a pre-determined level against the direction of the trade, the stop-loss order changes to a market order and is executed at the best available market price at the time of execution. It is a risk management tool that enables a trader to limit losses on trades, or maximise profits, better enabling them to manage their risk-reward and their positions even when they aren’t actively monitoring them.
A take-profit order on the other hand, is used to lock in profits, or minimize losses, when the price hits a pre-determined level in the direction of the trade. Much like a stop loss, it is used to manage a position when not actively monitoring it. It enables traders to exit trades when it hits their preferred level and avoid missing the opportunity if the market then moves in the opposite direction.
What are some other terms I should be aware of when trading?
Averaging Up or Down
Averaging up or down refers to a strategy in which traders add to losing positions on the belief that their analysis will come good. The idea is that adding to losing positions improves the aggregate price if the trade turns in your favor.
Averaging down adds further long positions when the price falls, in effect bringing down the average price of the trades, while averaging up involves adding further short positions when the price rises, increasing the average price of the trades. It’s deemed a risky strategy as it can also significantly increase a trader’s potential losses on a position.
Short Squeezes
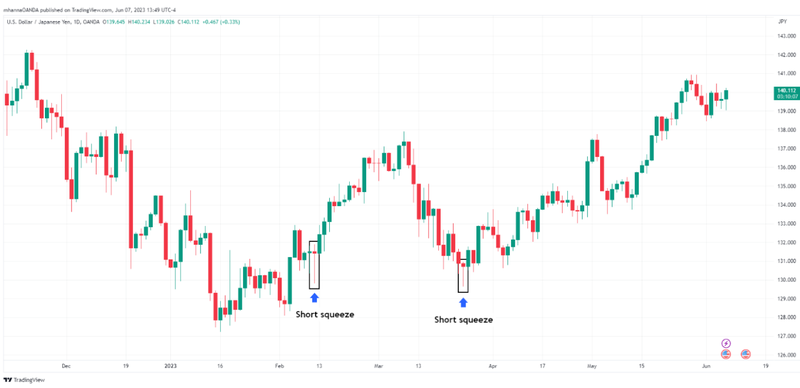
Short squeezes occur when an instrument that has been heavily shorted begins to rally aggressively. It happens as those that are short enter long positions en-masse either automatically, i.e. hitting stop losses, or by choice, i.e. their positions are losing money, and they either go long to partially cover them or close out their positions altogether. The initial move may be fundamentally triggered or not, but the eventual move is typically far more substantial than warranted by the event alone.
The ‘Dead Cat Bounce’
A dead cat bounce refers to a brief and small corrective move in a sell-off that fails to generate any significant upside momentum before continuing lower. It can occur in particularly high momentum sell-offs in which there isn’t much appetite to buy in the markets, which quickly leads to further declines.
In moments like these, you may have heard the phrase don’t catch a falling knife. There are some, often more experienced traders, who do like to trade against these high-momentum moves. It’s called fading the market and is deemed to be a high-risk strategy.
Now that you've explored the most common trading jargon, deepen your understanding of forex trading: apply for a demo with OANDA and start your journey now.
Disclaimer
This article is for general information purposes only, not to be considered a recommendation or financial advice. Past performance is not indicative of future results.
It is not investment advice or a solution to buy or sell instruments. Opinions are the authors; not necessarily that of OANDA Corporation or any of its affiliates, subsidiaries, officers or directors. Leveraged trading in foreign currency contracts or other off-exchange products on margin carries a high level of risk and may not be suitable for everyone. We advise you to carefully consider whether trading is appropriate for you in light of your personal circumstances. You may lose more than you invest. We recommend that you seek independent financial advice and ensure you fully understand the risks involved before trading. Trading through an online platform carries additional risks. Losses can exceed deposits.


