




Nov 10th Chart of the Week: Gold rebounds above US$4,000 as lower yields revive bullish momentum

Gold has recovered sharply from its one-year low as easing energy-price pressure, lower long-term Treasury yields and softer dollar conditions support a potential bullish reversal.
Key takeaways
- Gold has rallied 7.2% from its late-October low, supported by softer oil prices, lower US Treasury yields and post-midterm dollar weakness.
- Price has reclaimed the 20-day moving average, while an ascending channel and RSI above 50 suggest an improving medium-term bullish momentum.
- A break above 4,190 may expose 4,254 and 4,315, while a daily close below 4,034 would invalidate the bullish scenario.
Gold (XAU/USD) has recovered above US$4,000 since 4 November 2026, supported by falling oil prices, post-US midterm dollar weakness and lower long-term US Treasury yields, with the 10-year US Treasury yield dropping below 5%.
The rebound accelerated to an intraday high of US$4,149 on Monday, 9 November 2026, a 7.2% rally from a one-year low of US$3,870, printed on 30 October 2026, which coincides with a major support level of US$3,886, defined by the major swing low of 28 October 2025.
Softer oil prices triggered the recovery
Gold’s rebound began on 2 November after the preceding session’s technology sell-off had triggered margin calls and forced liquidation of bullion.
Iran–Qatar diplomatic talks then pushed oil sharply lower, easing concerns that energy inflation would require prolonged Fed tightening. A softer dollar provided additional support. This helped gold recover from its late-October one-year low.1
Let’s now assess the medium-term outlook (multi-week) for gold from a technical analysis perspective.
Above 20-day MA with bullish momentum
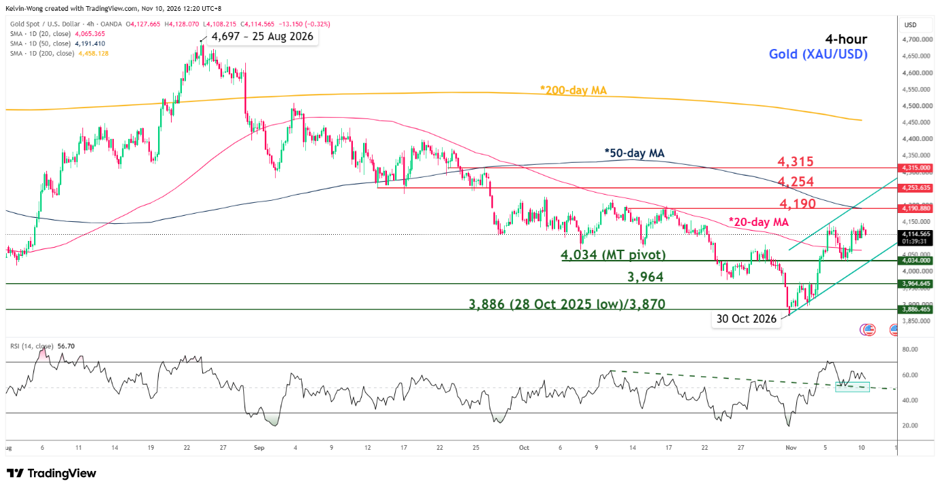
The price action of gold (XAU/USD) has cleared, retested and traded back above the 20-day moving average since 5 November 2026 (see Fig. 1).
In addition, the precious yellow metal has begun to oscillate within an ascending channel since the key swing low on 30 October 2026, with the 4-hour RSI continuing to exhibit bullish momentum above the 50 level.
These observations suggest that a potential medium-term bullish reversal low may have formed on 30 October 2026, following a 9-month corrective decline of 31% from the all-time high printed on 29 January 2026.
Watch the 4,034 key medium-term pivotal support and a clearance above the intermediate resistance at 4,190 (also the 50-day moving average), with medium-term resistances at 4,254 and 4,315.
However, a daily close below 4,034 invalidates the bullish scenario, exposing the next medium-term support at 3,964 and the possibility of a retest of the major support area of 3,886/3,870.
Footnotes
The content here is for educational and informational purposes only. This material is not investment advice or a recommendation or suggestion of any investment strategy, and it does not provide investment advisory services. OANDA is not responsible for any investment decisions made based on this content. Investing involves the risk of a loss of capital. Past performance does not guarantee future results.
Latest blog posts:


Start trading now with fast account opening.
Sign-up now to trade the most active markets
Open account

