The yen has strengthened to a five-week high as risk aversion, deteriorating carry-trade economics and firmer BoJ tightening expectations combine with a bearish USD/JPY breakdown.
Key takeaways
- The yen has emerged as the strongest major currency, supported by defensive demand, the unwinding of carry trades, and renewed expectations of further BoJ tightening.
- Japan’s core-core inflation accelerated to 2.4%, strengthening the case for another BoJ rate increase in December even if policymakers hold rates at the October meeting.
- A break below 156.30 may expose 155.40 and 154.30, while a daily close above 158.90 would invalidate the current multi-week bearish USD/JPY scenario.
The Japanese yen strengthened to a five-week high last week, with USD/JPY touching an intraday low of 156.08 on 23 October 2026, as demand for defensive assets coincided with firmer expectations of further Bank of Japan tightening. These are the fundamental drivers explaining the move.
Heightened risk aversion, reduction in JPY-funded carry trade and higher inflation
First, the global technology sell-off supported demand for the yen. Concerns over lofty AI valuations, rising oil prices and French political uncertainty reduced risk appetite. The yen’s gains extended across major currencies, suggesting a broader defensive rotation (see Fig. 1).
Fig. 1: 3-month rolling performances of major currency indices as of 23 Oct 2026 (Source: TradingView). The information presented is historical information, and past performance is not indicative of future performance.

Based on the three-month rolling performance as of 23 October 2026, the Japanese Yen Currency Index (compiled by TradingView) is the top performer among the major currency indices with a gain of 4.40%, and even surpassing the US Dollar Currency Index (+0.39%)
These conditions also favour the unwinding of yen-funded carry trades, as traders reduce leveraged exposure and buy back the funding currency (see Fig. 2).
Fig. 2: JPY-funded carry-to-risk ratio with JPY COT Index as of 23 Oct 2023 (Source: MacroMicro). The information presented is historical information, and past performance is not indicative of future performance.
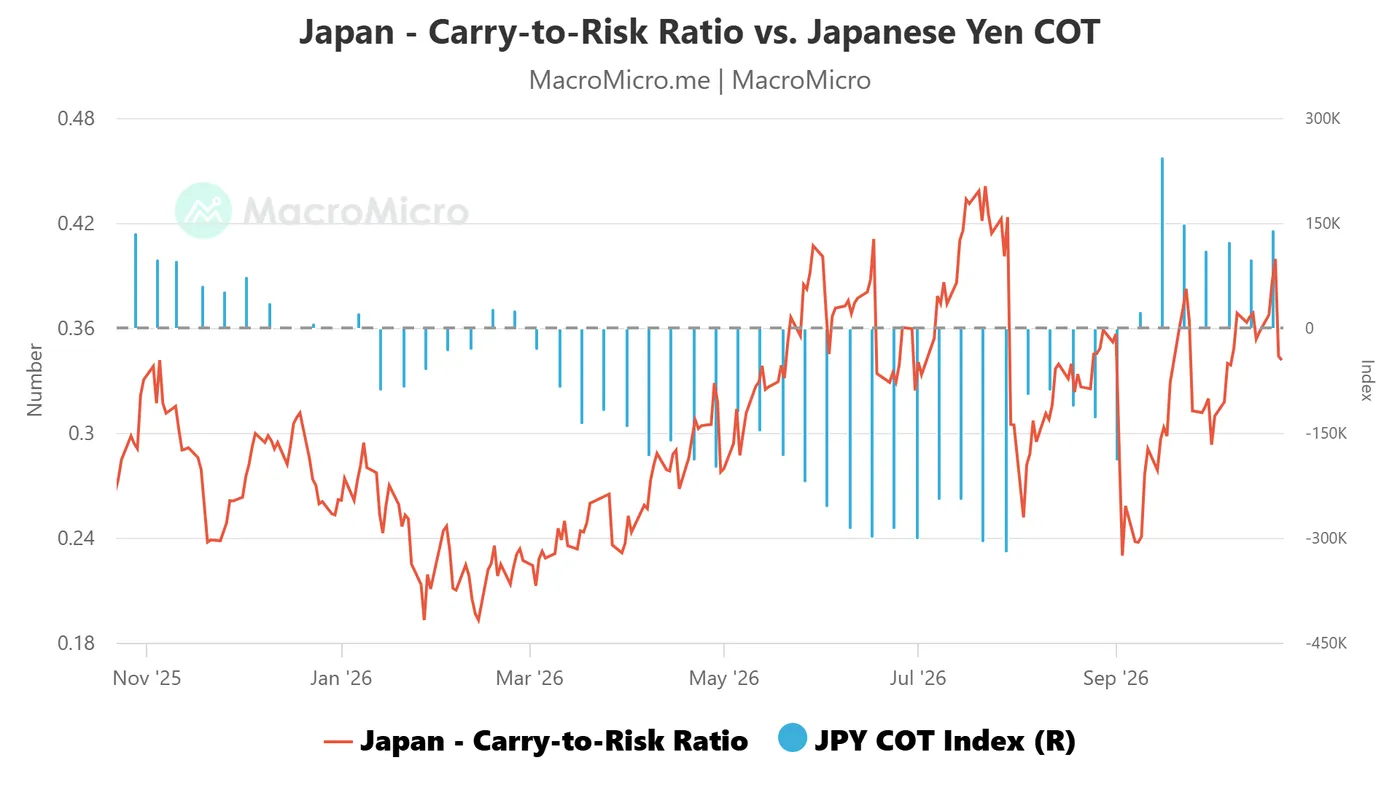
Based on data compiled by MacroMicro, the carry-to-risk ratio (calculated as the US-Japan interest rate differential divided by implied JPY volatility) has declined to 0.34 as of 23 October 2026, down from an almost three-month high of 0.40 reached on 21 October 2026.
This ratio measures the attractiveness of yen-funded carry trades; a lower ratio indicates investors are likely earning lower carry returns for a given level of volatility risk, reducing their appeal.
Hence, the latest decline in JPY’s funded carry-to-risk ratio suggests a negative feedback loop for USD/JPY as demand for JPY carry-trade strategies declines.
Second, Japan’s inflation rebound reinforced the case for additional BoJ rate increases. September core-core CPI (excluding fresh food and energy) rose 2.4% year-on-year, its fastest pace of increase in six months, and returned above the central bank’s 2% target.
Meanwhile, Governor Kazuo Ueda has warned about an underlying inflation overshoot, supporting expectations that policy normalisation will continue despite an anticipated pause this month.
Ahead of the 29–30 October 2026 monetary policy meeting, the key catalysts are the BoJ’s guidance and its updated inflation outlook. The policy rate is widely expected to remain at 1.25%; nearly 70% of economists in Reuters’ latest poll expected a rise to 1.50% this quarter, with the move predominantly in December.1
The near-term bias may remain supportive of the yen if the BoJ validates further tightening. A higher inflation forecast alongside firmer December guidance could extend USD/JPY’s decline.
Conversely, cautious guidance that pushes back expectations for the next hike could trigger a rebound, particularly if global equities stabilise and carry demand returns.
Let’s now decipher the multi-week outlook on USD/JPY from a technical analysis point of view.
Bearish breakdown from three-week range
Fig. 3: USD/JPY medium-term trend as of 26 Oct 2026 (Source: TradingView). The information presented is historical information, and past performance is not indicative of future performance.

After failing to clear above the 200-day moving average on 25 September 2026, the rally seen in the USD/JPY from the 8 September 2026 low of 152.89 fizzled out and transformed into a three-month range configuration below the key 200-day moving average (see Fig. 3).
On 22 October 2026, USD/JPY staged a bearish breakdown below the range support, and the 50-day moving average has now turned into intermediate resistance at 157.58.
In addition, the 4-hour RSI momentum indicator has remained below a descending trendline resistance since 25 September 2026, indicating a potential medium-term bearish momentum condition for USD/JPY.
Watch the 158.50/158.90 key medium-term pivotal resistance (also the 200-day moving average) on USD/JPY to maintain a potential multi-week bearish bias.
A break below the 156.30 intermediate support exposes the medium-term supports at 155.40 and 154.30.
However, a clearance and a daily close above 158.90 would invalidate the bearish scenario, with the next medium-term resistance at 159.70/160.40.
This article and its contents are intended for educational purposes only and should not be considered trading advice.