


XAU/USD Technical & Macro Outlook: October 2026
- Hawkish Central Bank Expectations: Persistent inflationary pressures (with U.S. CPI at 3.7% in September) keep central banks hawkish, with market pricing leaning toward further Fed rate hikes or a “higher for longer” policy through early 2027.
- Opposing Macro Forces on Gold: While high inflation provides safe-haven demand for gold, rising Treasury yields and a strong U.S. dollar from central bank tightening increase the opportunity cost of holding non-yielding bullion, creating downside pressure on gold.
- Technical Bullish Flag Formation: Despite the recent price retreat from peaks near 5,600 within a descending channel, the technical structure views the move as a potential bullish flag pattern within the long-term uptrend since 2023, supported by key support between 4,000–4,120.
Macroeconomic Drivers & Central Bank Policy
Major central banks and economic bureaus are set to publish crucial inflation metrics in late October and early November 2026, including the European Central Bank and Bank of Japan monetary policy meetings on October 29–30, followed by the U.S. Consumer Price Index (CPI) release for October on November 10. Recent indicators show persistent inflationary pressure driven by sticky energy and shelter costs, with headline U.S. CPI rising to 3.7% year-over-year in September. These upcoming releases will reveal whether price pressures are structural or temporary, determining whether global headline inflation continues to hover well above the target 2% threshold in major economies.
In response, central banks—most notably the Federal Open Market Committee (FOMC)—are maintaining a hawkish posture to rein in persistent inflation. Following a 25-basis-point rate hike to a target range of 3.75%–4.00% in September 2026, the FOMC enters its October 27–28 policy meeting under close market scrutiny as officials weigh additional tightening before year-end. If inflation data remain elevated, central banks will keep benchmark rates “higher for longer” or implement incremental rate hikes, thereby dampening economic expansion and cooling consumer demand.
These macroeconomic dynamics exert two opposing forces on gold prices. Higher inflation data initially boosts demand for gold as a traditional inflation hedge and safe-haven store of value. However, persistent inflation triggers hawkish rate responses from the FOMC, driving up real yields on U.S. Treasuries and strengthening the U.S. dollar, thereby increasing the opportunity cost of holding non-yielding bullion and pressuring prices downward. Ultimately, if upcoming CPI prints come in hotter than expected and prompt additional Fed rate hikes, gold is likely to experience short-term selling pressure; conversely, softer inflation data that signals an end to central bank tightening would provide strong tailwinds for a gold rally.
CME FedWatch Rate Expectations
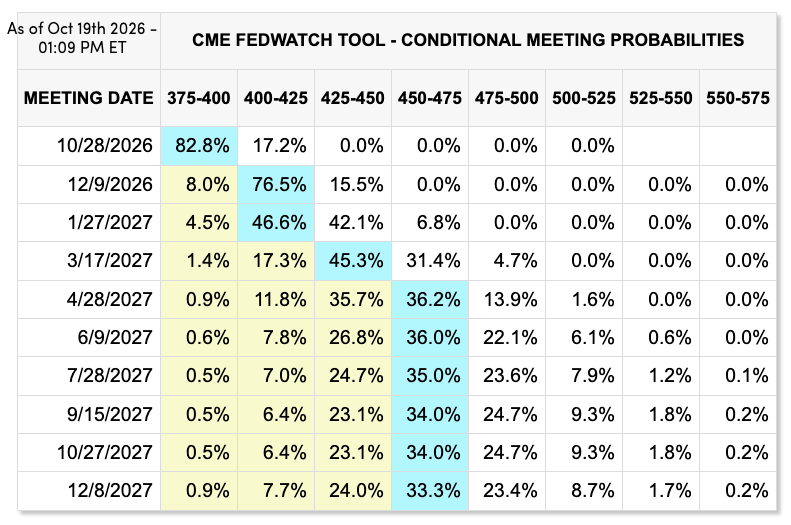
According to CME FedWatch Tool pricing as of October 19, 2026, market expectations are overwhelmingly centered on additional Federal Reserve tightening through early 2027. For the upcoming October 28, 2026 meeting, markets reflect an 82.8% probability that the target rate will settle in the 375–400 bps range (indicating a hold at current levels) and a 17.2% chance of a hike to 400–425 bps. Heading into the final meeting of the year on December 9, 2026, sentiment shifts strongly toward a rate increase, with a 76.5% probability priced for a target range of 400–425 bps and a 15.5% probability placed on a further hike to 425–450 bps.
Looking ahead to the first policy meeting of 2027 on January 27, the market expects rates to remain elevated, with probabilities favoring either maintaining the 400–425 bps target (46.6%) or adjusting upward to the 425–450 bps band (42.1%).
XAU/USD weekly chart technical analysis and COT report updates
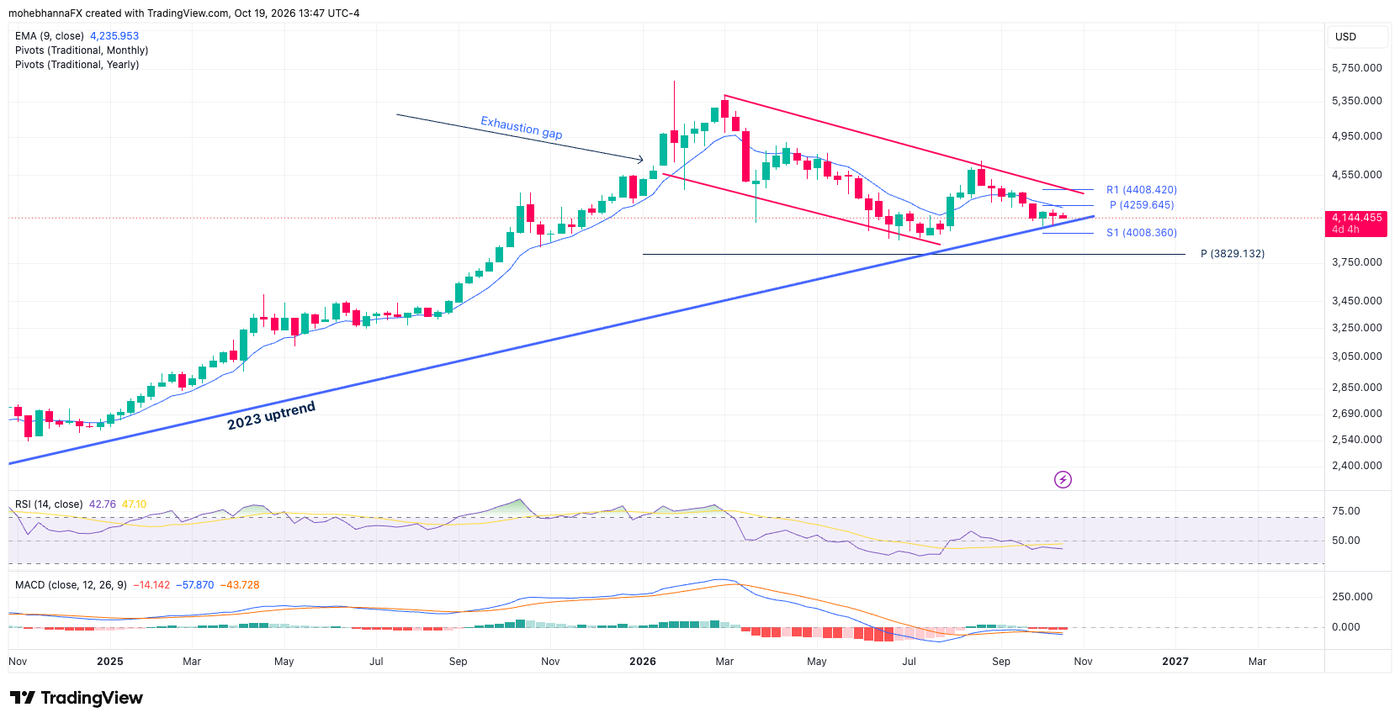
- The price has been moving down within a well-defined descending channel (red trendlines) following a major peak near 5,600. So far, until proven otherwise, the descending channel can be considered a bullish flag formation for the initial long-term uptrend that began in early 2023 and is marked by the blue line.
- Immediate support lies below price action, between the monthly S1 and the 2023 uptrend, in the 4000-4120 range. A second level of support falls at the annual pivot point of 3829.12.
- An immediate confluence of resistance lies above price action, at the intersection of the fast EMA9 and the monthly pivot point of 4259.64. A second level of resistance falls near the monthly R1 of 4408.42, intersecting with the upper border of the flag formation.
- Lagging momentum indicators, including the Relative Strength Index (RSI) and Stochastic Oscillator, remain constructively aligned with the underlying price action, tracking positively without exhibiting severe divergence.
- The latest COT report released by the CFTC on Friday, October 16th, 2026, which includes data up to the end of day, Tuesday, October 13th, 2026, reflects that the most recent decline in gold price, which began in August of 2026, was accompanied by relatively unchanged open interest and declining volume. This suggests that the COT data did not support the price drop and a potential change in sentiment.
Conclusion
In summary, the outlook for XAU/USD remains framed by a tug-of-war between persistent hawkish central bank expectations and a constructively bullish long-term technical structure. While sustained inflationary pressure and market expectations of “higher for longer” Federal Reserve interest rates present ongoing macroeconomic headwinds—dampening bullion demand via elevated real yields and a strong U.S. dollar—the technical picture suggests that the recent price consolidation forms a bullish flag within a broader secular uptrend. A decisive breakout above immediate technical resistance around the 4,260–4,408 confluence region would signal a resumption of the broader rally, whereas a breakdown below primary support at 4,000–4,120 could expose lower pivot levels near 3,829.
Opinions are the authors'; not necessarily that of OANDA Business Information & Services, Inc. or any of its affiliates, subsidiaries, officers or directors. The provided publication is for informational and educational purposes only.
If you would like to reproduce or redistribute any of the content found on MarketPulse, an award winning forex, commodities and global indices analysis and news site service produced by OANDA Business Information & Services, Inc., please refer to the MarketPulse Terms of Use.
Visit https://www.marketpulse.com/ to find out more about the beat of the global markets.
© 2026 OANDA Business Information & Services Inc.