


WTI set for monthly gain amid US-Iran stalemate
- WTI rebounds as uncertainty around US-Iran talks keeps supply risks in focus.
- Saudi pipeline flows and higher Gulf exports ease some concerns over Middle East supply.
- WTI holds above key daily SMAs, though momentum indicators remain mixed.
West Texas Intermediate (WTI) Oil rebounds on Wednesday and remains on track for a monthly gain of around 5.5%. The lack of progress in US-Iran negotiations to reopen the Strait of Hormuz keeps geopolitical risks elevated, even as Middle East supply conditions improve. At the time of writing, WTI trades around $90, recovering part of the previous day’s losses.
The US benchmark fell over 4% on Tuesday, slipping to its lowest level since September 4, as easing supply concerns weighed on prices. Reuters reported that Saudi Arabia resumed tanker loadings at Yanbu after restarting its East-West pipeline, which provides an alternative route around Hormuz. Goldman Sachs estimated that Gulf Oil exports recovered to around 23.3 million barrels per day last week, broadly matching their 2025 average. The US also announced that it would offer up to 40 million barrels from its Strategic Petroleum Reserve.
Meanwhile, data released by the US Energy Information Administration (EIA) on Wednesday showed that crude inventories increased by 922,000 barrels last week. The reading was above market expectations for a decline of around 300,000 barrels but considerably smaller than the previous week’s 2.969 million-barrel build.
On the Middle East front, Iran confirmed that it had received Washington’s response to Tehran’s seven-day proposal aimed at reopening the Strait of Hormuz. The initial plan was rejected by US President Donald Trump, while Tehran has signalled that it will not soften its demands, which include lifting the naval blockade of Iranian ports and releasing frozen Iranian assets. Iranian Foreign Minister Abbas Araqchi is expected to review Washington’s response with officials in Tehran.
A deal between Washington and Tehran could remove some of the geopolitical premium from Oil prices. In contrast, a prolonged stalemate could support further gains in WTI.
Technical analysis
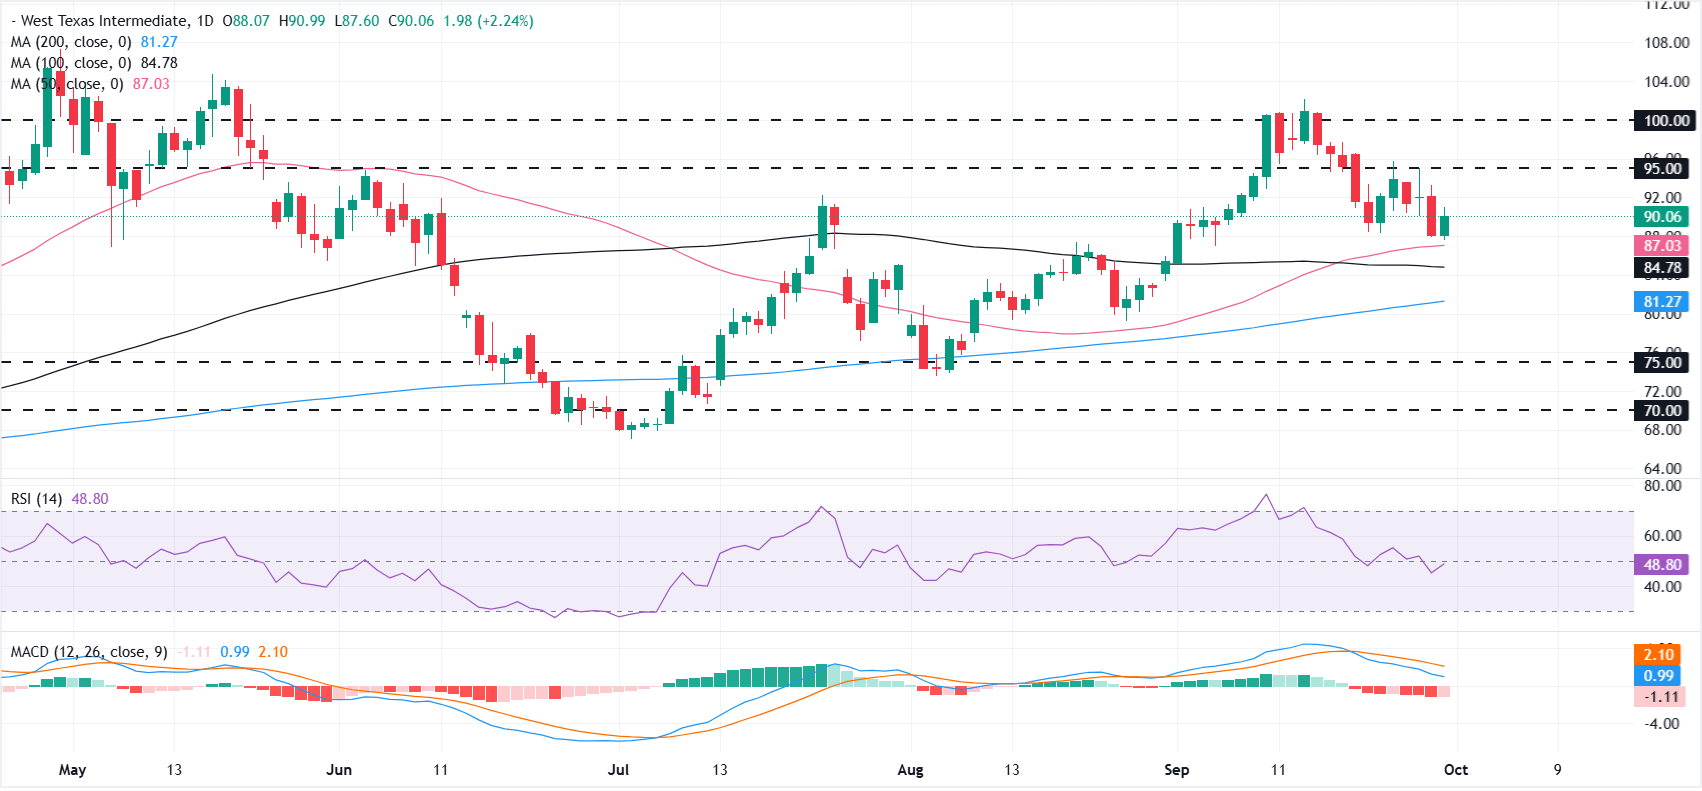
On the daily chart, WTI US Oil holds above the 50-day, 100-day and 200-day Simple Moving Averages (SMAs), which together suggest a still constructive underlying trend even after retreating from a brief move above $100 earlier this month.
Momentum is more cautious, with the Relative Strength Index (RSI) hovering near a neutral 48 and the Moving Average Convergence Divergence (MACD) in negative territory, hinting that bullish pressure is losing steam even as price remains supported by the key medium- and long-term averages.
On the topside, initial resistance is seen at the horizontal barrier near $95, followed by a stronger cap at $100. On the downside, immediate support is aligned with the $89.95 area and the 50-day SMA at $87.03, ahead of the 100-day SMA at $84.78 and the 200-day SMA at $81.27. Below these, deeper structural floors emerge at $75 and $70, which would come into play only if selling extends significantly.
(The technical analysis of this story was written with the help of an AI tool. Know more.)
WTI Oil FAQs
What is WTI Oil?
WTI Oil is a type of Crude Oil sold on international markets. The WTI stands for West Texas Intermediate, one of three major types including Brent and Dubai Crude. WTI is also referred to as “light” and “sweet” because of its relatively low gravity and sulfur content respectively. It is considered a high quality Oil that is easily refined. It is sourced in the United States and distributed via the Cushing hub, which is considered “The Pipeline Crossroads of the World”. It is a benchmark for the Oil market and WTI price is frequently quoted in the media.
What factors drive the price of WTI Oil?
Like all assets, supply and demand are the key drivers of WTI Oil price. As such, global growth can be a driver of increased demand and vice versa for weak global growth. Political instability, wars, and sanctions can disrupt supply and impact prices. The decisions of OPEC, a group of major Oil-producing countries, is another key driver of price. The value of the US Dollar influences the price of WTI Crude Oil, since Oil is predominantly traded in US Dollars, thus a weaker US Dollar can make Oil more affordable and vice versa.
How does inventory data impact the price of WTI Oil
The weekly Oil inventory reports published by the American Petroleum Institute (API) and the Energy Information Agency (EIA) impact the price of WTI Oil. Changes in inventories reflect fluctuating supply and demand. If the data shows a drop in inventories it can indicate increased demand, pushing up Oil price. Higher inventories can reflect increased supply, pushing down prices. API’s report is published every Tuesday and EIA’s the day after. Their results are usually similar, falling within 1% of each other 75% of the time. The EIA data is considered more reliable, since it is a government agency.
How does OPEC influence the price of WTI Oil?
OPEC (Organization of the Petroleum Exporting Countries) is a group of 12 Oil-producing nations who collectively decide production quotas for member countries at twice-yearly meetings. Their decisions often impact WTI Oil prices. When OPEC decides to lower quotas, it can tighten supply, pushing up Oil prices. When OPEC increases production, it has the opposite effect. OPEC+ refers to an expanded group that includes ten extra non-OPEC members, the most notable of which is Russia.