Daily market news

16:00 - 12.06.2026
Author:

WTI Price Forecast: RSI points lower as prices remain below key SMAs

West Texas Intermediate (WTI) pares some part of earlier losses on Friday as markets seek confirmation of a possible US-Iran agreement, prompting traders to refrain from placing aggressive bearish bets.

forex Forex
14:00 - 12.06.2026
Author:

EUR/USD Price Forecast: Bulls struggle to breach a previous support near 1.1600

The Euro (EUR) has given away previous daily gains against the US Dollar (USD) and is trading practically flat, at 1.1575 at the time of writing.

equities Equities
13:18 - 12.06.2026
Author:
kelvin_wong
Kelvin Wong

Chart alert: SpaceX to the moon or to the ground? Watch 187.60 and 161.00.

SpaceX begins trading on Nasdaq in the largest IPO ever, raising US$75 billion and achieving a valuation near US$1.8 trillion. While investor demand remains exceptionally strong, technical signals from the SPCX/USDT grey market suggest caution. The pre-IPO perpetual contract remains trapped in a descending channel, highlighting the risk of further downside unless bulls reclaim the key US$187.60 resistance level. Traders are closely watching whether SpaceX becomes a major driver of Nasdaq 100 per

commodities Commodities
13:00 - 12.06.2026
Author:

Silver Price Forecasts: XAG/USD bulls eye $69.00 amid an improved market mood 

Thursday’s EuropeanSilver (XAG/USD) retraces previous losses on Friday's European session, returning to levels in the mid-range of the $67.00s at the time of writing.

forex Forex
11:00 - 12.06.2026
Author:

Forex Today: Renewed hopes of US-Iran peace deal help market mood improve

Here is what you need to know on Friday, June 12:

forex Forex
10:00 - 12.06.2026
Author:

USD/CHF Price Forecast: Trades above 0.7950 after rebounding from nine-day EMA support

USD/CHF rebounds after registering modest losses in the previous day, trading around 0.7960 during the European hours on Friday. The technical analysis of the daily chart indicates the pair is remaining within the ascending channel pattern, signaling an ongoing bullish bias.

forex Forex
09:00 - 12.06.2026
Author:

Germany’s final Harmonized Index of Consumer Prices for May remains at 2.7% YoY: What it means for EUR/USD?

Germany’s final Harmonized Index of Consumer Prices (HICP) data for May has arrived at 2.7% Year-on-Year (YoY), as the preliminary data showed. The inflation data cooled down from 2.9% in April. On a monthly basis, it is confirmed that the German HICP growth declined by 0.1%.

forex Forex
08:00 - 12.06.2026
Author:

AUD/USD Price Forecast: Needs decisive break above 50% Fibo retracement at 0.7050 for more upside

The AUD/USD pair is down 0.22% to near 0.7035 in the early European trade on Friday.

forex Forex
07:00 - 12.06.2026
Author:

USD/JPY Price Forecast: Climbs further beyond 160.00 as Mideast tensions undermine JPY

The USD/JPY pair attracts fresh buyers during the Asian session on Friday and moves away from a one-week low, touched the previous day.

commodities Commodities
06:51 - 12.06.2026
Author:
kelvin_wong
Kelvin Wong

Asia open: Wall Street surges as Trump signals a breakthrough peace deal with Iran

Global markets rallied sharply after President Trump signalled a potential breakthrough US-Iran peace deal, easing fears of a prolonged energy shock. WTI crude oil plunged 6%, driving a broad relief rally across equities, bonds, and currencies. Semiconductor stocks surged nearly 8% as investors renewed confidence in the AI infrastructure boom, while SpaceX’s record-breaking US$75 billion listing demonstrated robust liquidity and appetite for technology investments.

OANDA's pick for the day

22:04 - 27.05.2026
Traders are desperate for more news, but the status quo is positive
22:16 - 25.05.2026
The Memorial Day session brought with it some great news
22:39 - 07.05.2026
Is the party over already? – North American Session Market Wrap for May 7
22:29 - 06.05.2026
The Peace rally can't be stopped – North American Session Market Wrap for May 6
16:00 - 12.06.2026
16:00 - 12.06.2026

WTI Price Forecast: RSI points lower as prices remain below key SMAs

  • WTI recovers from its lowest level since April 17 as traders await clarity on a possible US-Iran agreement.
  • Iran says the proposed agreement does not require Tehran to transfer control of the Strait of Hormuz.
  • Technically, WTI's near-term tone remains bearish, with RSI signaling weak upside momentum.

West Texas Intermediate (WTI) pares some part of earlier losses on Friday as markets seek confirmation of a possible US-Iran agreement, prompting traders to refrain from placing aggressive bearish bets.

At the time of writing, WTI trades around $83.80 per barrel after recovering from an intraday low of $81.80, its lowest level since April 17.

Crude Oil prices came under heavy selling pressure on Thursday after US President Donald Trump said the US and Iran could sign a peace deal as soon as this weekend that would reopen the Strait of Hormuz, a critical chokepoint for around 20% of global Oil flows.

However, questions remain over the future management of the Strait of Hormuz. According to IRNA, "the future administration of the Strait will be resolved as a regional matter through dialogue and joint decision-making between Tehran and Oman."

IRNA also reported that the proposed agreement with the United States does not require Iran to transfer control of the strategic waterway.

Until the details of any agreement become clearer, a geopolitical risk premium is likely to remain embedded in Oil prices. However, the technical outlook remains fragile, with prices trading below key moving averages and momentum indicators pointing lower.

Technical analysis:

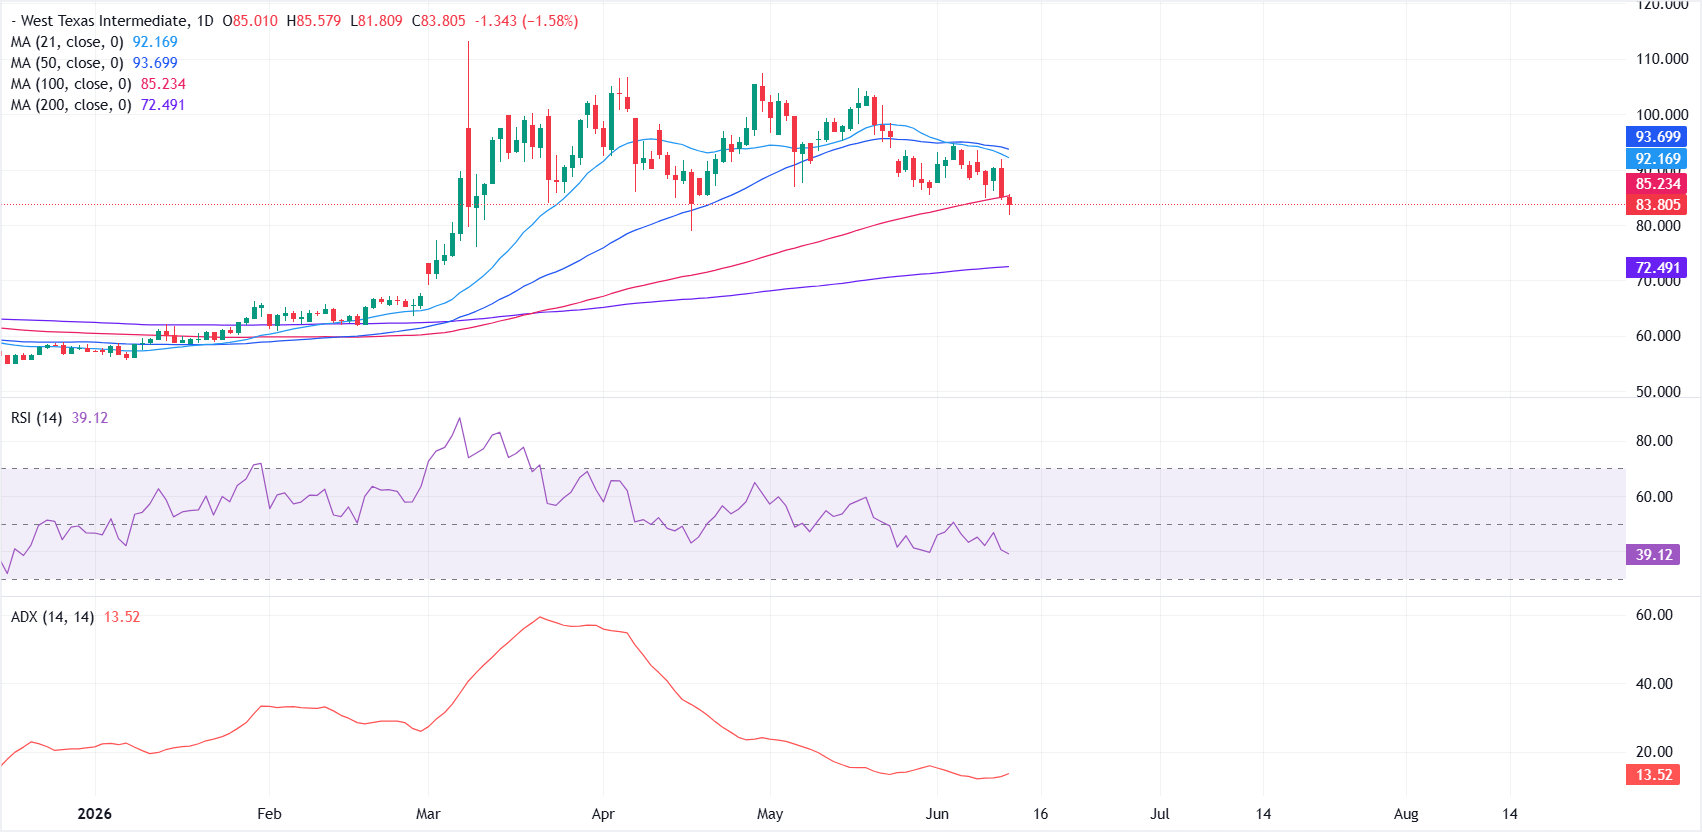
WTI retains a bearish near-term bias, with price holding below the 100-, 50- and 21-day simple moving averages (SMAs) clustered between roughly $85 and $94, which cap any recovery attempts for now.

The Relative Strength Index (RSI) on the daily chart is near 39 and keeps a downside bias in momentum, while the subdued Average Directional Index (ADX) around 14 hints at a weak directional trend.

On the topside, initial resistance is seen at the 100-day SMA at $85.23, with further barriers at the 21-day SMA near $92.17 and the 50-day SMA around $93.70, where sellers would likely re-emerge if a bounce extends.

On the downside, immediate support is seen at the $80 psychological mark near the lower end of the war-driven trading range, followed by the 200-day SMA at $72.49.

(The technical analysis of this story was written with the help of an AI tool.)

WTI Oil FAQs

What is WTI Oil?

WTI Oil is a type of Crude Oil sold on international markets. The WTI stands for West Texas Intermediate, one of three major types including Brent and Dubai Crude. WTI is also referred to as “light” and “sweet” because of its relatively low gravity and sulfur content respectively. It is considered a high quality Oil that is easily refined. It is sourced in the United States and distributed via the Cushing hub, which is considered “The Pipeline Crossroads of the World”. It is a benchmark for the Oil market and WTI price is frequently quoted in the media.

What factors drive the price of WTI Oil?

Like all assets, supply and demand are the key drivers of WTI Oil price. As such, global growth can be a driver of increased demand and vice versa for weak global growth. Political instability, wars, and sanctions can disrupt supply and impact prices. The decisions of OPEC, a group of major Oil-producing countries, is another key driver of price. The value of the US Dollar influences the price of WTI Crude Oil, since Oil is predominantly traded in US Dollars, thus a weaker US Dollar can make Oil more affordable and vice versa.

How does inventory data impact the price of WTI Oil

The weekly Oil inventory reports published by the American Petroleum Institute (API) and the Energy Information Agency (EIA) impact the price of WTI Oil. Changes in inventories reflect fluctuating supply and demand. If the data shows a drop in inventories it can indicate increased demand, pushing up Oil price. Higher inventories can reflect increased supply, pushing down prices. API’s report is published every Tuesday and EIA’s the day after. Their results are usually similar, falling within 1% of each other 75% of the time. The EIA data is considered more reliable, since it is a government agency.

How does OPEC influence the price of WTI Oil?

OPEC (Organization of the Petroleum Exporting Countries) is a group of 12 Oil-producing nations who collectively decide production quotas for member countries at twice-yearly meetings. Their decisions often impact WTI Oil prices. When OPEC decides to lower quotas, it can tighten supply, pushing up Oil prices. When OPEC increases production, it has the opposite effect. OPEC+ refers to an expanded group that includes ten extra non-OPEC members, the most notable of which is Russia.

This publication has been prepared by OANDA TMS Brokers S.A. with its registered office in Warsaw, Warsaw UNIT, Daszyńskiego 1, 00-843 Warsaw, registered by the District Court for the Capital City of Warsaw in Warsaw, XIII Commercial Division of the National Court Register under KRS number 0000204776, NIP number 5262759131, with a share capital amounting to PLN 3,537.560, fully paid up, operating in accordance with the Act on Trading in Financial Instruments dated July 29th 2005, exclusively for the needs of OANDA TMS Brokers' clients. OANDA TMS Brokers is subject to the supervision of the Polish Financial Supervision Authority on the basis of an authorization of April 26th 2004 (KPWiG-4021-54-1/2004)

This publication is a commercial publication within the meaning of art. 36 par. 2 of Commission Delegated Regulation (EU) 2017/565 of 25 April 2016 supplementing Directive 2014/65 / EU of the European Parliament and of the Council with regard to the organizational requirements and operating conditions of investment firms and the concepts defined for the purposes of this directive.

Recipients of this publication should consult the financial adviser before taking any investment decision on the basis of this publication.

In the preparation of this document OANDA TMS Brokers not take into account the individual needs and situation of the investor. Investments and services presented or included in this document may not be suitable for a specific investor, therefore, in case of doubts concerning such investments or investment services, it is recommended to consult an independent investment advisor.

Recipients of this report must make their own determination of the appropriateness of an investment in any financial instruments referred to herein based on the merits and risks involved, their own investment strategy and their legal and financial position.

None of the information presented in this publication constitutes investment, legal, accounting or tax advice or a statement that any investment strategy is adequate or appropriate due to individual circumstances related to the recipient, as well as does not constitute any other personal recommendation. OANDA TMS Brokers does not provide tax advisory services related to investing in financial instruments and recommends to contact an independent tax advisor.

OANDA TMS Brokers informs that in the case of a general recommendation service, there is a conflict of interest consisting in the issuance by OANDA TMS Brokers recommendation of a general nature, while OANDA TMS Brokers concluded transactions on the trading portfolio.

This publication is only informative and:

(i) does not constitute or form part of a sale, subscription or invitation to subscribe for any financial instruments,

(ii) it is not intended to offer or purchase or subscribe to or acquire any financial instruments

(iii) does not constitute advertising of any financial instruments

This publication has been prepared with due diligence, reliability and principles of objectivity based on generally available information. The information and opinions contained in this document have been collected or developed by OANDA TMS Brokers based on sources considered reliable, however OANDA TMS Brokers and related entities are not responsible for any inaccuracies or omissions. This document expresses the knowledge and views of its authors, as at the date of preparation.

The results achieved in the past should not be treated as an indication of whether the guarantee of future results. OANDA TMS Brokers is not responsible for investment decisions taken on the basis of this publication or for damages incurred as a result of investment decisions based on this publication.

The date on the first page of this publication is the date of its preparation and publication.

The Stocks service variant is offered in cross-selling together with the CFDs service variant. Detailed information on the risks arising from the various services being part of the cross-selling, as well as information on the costs and fees associated with these services, is available at OANDA TMS Brokers website in the Documents section.

CFDs are complex instruments and involve a high risk of a quick loss of cash due to leverage. 76% of retail investors' accounts record losses as a result of trading CFDs at this supplier. Consider if you understand how CFDs work and whether you can afford a high risk of losing money.

Detailed information about OANDA TMS Brokers, principles of preparing and disseminating recommendations, sources of information, determining recipients of recommendations, professional terminology, conflicts of interest, as well as frequency of issuing and validity of recommendations, are available at www.tmsbrokers.com in the section https://www.tmsbrokers.com/disclaimer

Scroll to top