Daily market news

22:00 - 08.05.2026
Author:

WTI declines as US-Iran deal hopes and Hormuz outlook weigh on oil

WTI, the US crude oil benchmark, falls some 2.49%, poised to end the week with losses of over 7.39%, amid growing speculation that the US and Iran will reach an agreement to end the conflict.

Forex
21:59 - 08.05.2026
Author:
Zain Vawda

Markets Weekly Outlook - Is the 'Risk-On' Rally sustainable with rates and energy elevated?

Equities surge despite high oil and rate expectations. This outlook covers US CPI, the Fed Chair transition from Powell to Warsh, DXY's bearish technical setup, and the sustainability of the "risk-on" rally amidst geopolitical tensions.

commodities Commodities
21:33 - 08.05.2026
Author:
Krzysztof Kamiński

Copper near record highs. Market fears supply constraints and bets on strong demand

Copper prices are approaching record highs as investors focus on long-term demand from artificial intelligence, power grids and clean energy, while supply risks grow due to sulfuric acid disruptions, weaker output in Chile and new strategic mining projects in Congo.

commodities Commodities
21:21 - 08.05.2026
Author:
Elior Manier

Are metals overdue for a rally? – Silver (XAG/USD) & Gold (XAU/USD) Outlook

XAU/USD, XAG/USD Outlook: Precious metals show signs of a bullish awakening as the traditional inverse relationship with crude oil begins to fade. With Copper breaking year-to-date highs and Gold printing a massive weekly hammer candle, the "war-driven" bear trend appears to be exhausting. Explore our intraday technical analysis of XAU/USD and XAG/USD to identify key breakout levels.

forex Forex
20:00 - 08.05.2026
Author:

USD/CHF Price Forecast: Spot tests lower Bollinger band as bearish momentum builds

USD/CHF trades on the back foot on Friday and is set for a second straight weekly decline amid broad-based weakness in the US Dollar (USD). At the time of writing, the pair is trading around 0.7773, hovering near two-month lows.

indices Indices
18:25 - 08.05.2026
Author:
Elior Manier

Tech continues to pull Stock Markets higher, S&P 500 at 7,400 – Dow Jones, Nasdaq and S&P 500 Intraday Levels

S&P 500, Dow Jones, Nasdaq Analysis and Trading Levels: Tech stocks propel the Nasdaq and S&P 500 to new heights as investors ignore geopolitical noise in favor of AI-driven growth. Despite diverging labor data and weak consumer sentiment, the bull run remains relentless. Explore critical technical levels for the major US indexes.

forex Forex
18:00 - 08.05.2026
Author:

USD/CAD climbs after Canada jobs data surprises to the downside.

USD/CAD edges higher on Friday as softer-than-expected Canadian employment data weighs on the Canadian Dollar (CAD), even as the US Dollar (USD) remains on the back foot following mixed US labor market data and hopes for a US-Iran deal to end the war.

forex Forex
17:00 - 08.05.2026
Author:

GBP/USD advances as US Dollar slips despite strong NFP, resilient Pound

GBP/USD advances around 1.3630 on Friday at the time of writing, up 0.54% on the day, benefiting from broad US Dollar weakness following the release of the US employment report.

commodities Commodities
16:11 - 08.05.2026
Author:
Elior Manier

Mixed feelings after the April Non-Farm Payrolls beat and Consumer Sentiment miss – Market Check

Global Markets update: US equities remain stoic following retaliatory strikes on Iranian energy hubs and a solid NFP beat of 115K. Despite a miss in consumer sentiment and higher inflation expectations, the cold-truce narrative persists. Explore our intraday market outlook and technical levels for the weekend

forex Forex
16:00 - 08.05.2026
Author:

EUR/USD: Recovery eyes full retracement – Scotiabank

Scotiabank strategists Shaun Osborne and Eric Theoret report the Euro (EUR) is modestly higher versus the Dollar, supported by risk sentiment around the US/Iran conflict despite softer German trade data and slightly reduced ECB tightening expectations.

OANDA's pick for the day

22:39 - 07.05.2026
Is the party over already? – North American Session Market Wrap for May 7
22:29 - 06.05.2026
The Peace rally can't be stopped – North American Session Market Wrap for May 6
22:11 - 04.05.2026
Sentiment waves are on a shore-break – North American Session Market Wrap for May 4
22:03 - 30.04.2026
It's an all-out rally after the Central Bank holds – North American Session Market Wrap for April 30
forex Forex
02:00 - 08.04.2026
Forex
02:00 - 08.04.2026

USD/JPY retreats from 160.00 as ceasefire crushes Oil premium

USD/JPY touched 160.46 before reversing sharply as the ceasefire sent the US Dollar tumbling across the board.Japan's household spending dropped 1.8% YoY in February, far worse than the 0.7% decline expected by economists.The Oil crash below $90 eases import cost pressures on Japan, strengthening the case for a BoJ hike this month.

USD/JPY reversed sharply on Tuesday, touching a session high around 160.50 before collapsing below 159.00 to settle near 158.85. The pair had briefly breached 160.00 for the first time since July 2024, a level that previously triggered direct intervention from Japan's Ministry of Finance, before the late-session reversal erased the entire day's gains and then some. The selloff accelerated after President Trump announced a two-week suspension of military operations against Iran, crushing the US Dollar's safe-haven bid.

On the Japanese Yen side, the collapse in WTI Crude Oil from above $106 to below $90 per barrel is a significant relief for Japan as a major net energy importer. Elevated oil costs had been feeding through to producer and consumer prices, complicating the Bank of Japan's (BoJ) rate path. The plunge may ease some of that imported inflation pressure, though it also strengthens the case for a rate hike by reducing the risk that tighter policy tips the economy into recession. February household spending fell 1.8% YoY, significantly worse than the 0.7% decline consensus, suggesting consumer demand remains fragile even before the full impact of higher energy costs. Markets continue to price in roughly a 70% probability of a BoJ rate hike later this month. Finance Minister Katayama flagged rising speculative activity in currency markets last week, and Prime Minister Takaichi said she would pursue direct talks with both Iran's leadership and President Trump. Thursday's Japanese Producer Price Index (PPI) data could further inform the BoJ's calculus ahead of the April 28 meeting.

On the US Dollar side, S&P 500 futures surged 1.1% and Nasdaq futures jumped 1.2% on the ceasefire confirmation, pulling capital out of the Dollar and into risk assets. The pause was brokered by Pakistan's Prime Minister, with Trump describing a 10-point Iranian proposal as a "workable basis" for negotiation, though Tehran had publicly rejected a 45-day ceasefire just hours earlier. This was Trump's fourth deadline extension since the conflict began in late February, and traders had been positioning for exactly this outcome throughout the session.

February Durable Goods Orders missed at negative 1.4%, though the ex-transportation reading was firmer at 0.8%. The Federal Open Market Committee (FOMC) Minutes are due Wednesday, alongside speeches from Federal Reserve (Fed) officials Daly and Waller. The key question now is whether physical shipping traffic actually resumes through the Strait of Hormuz; without that, the Oil premium will rebuild and the Dollar's safe-haven bid will return.

USD/JPY 1-hour chart
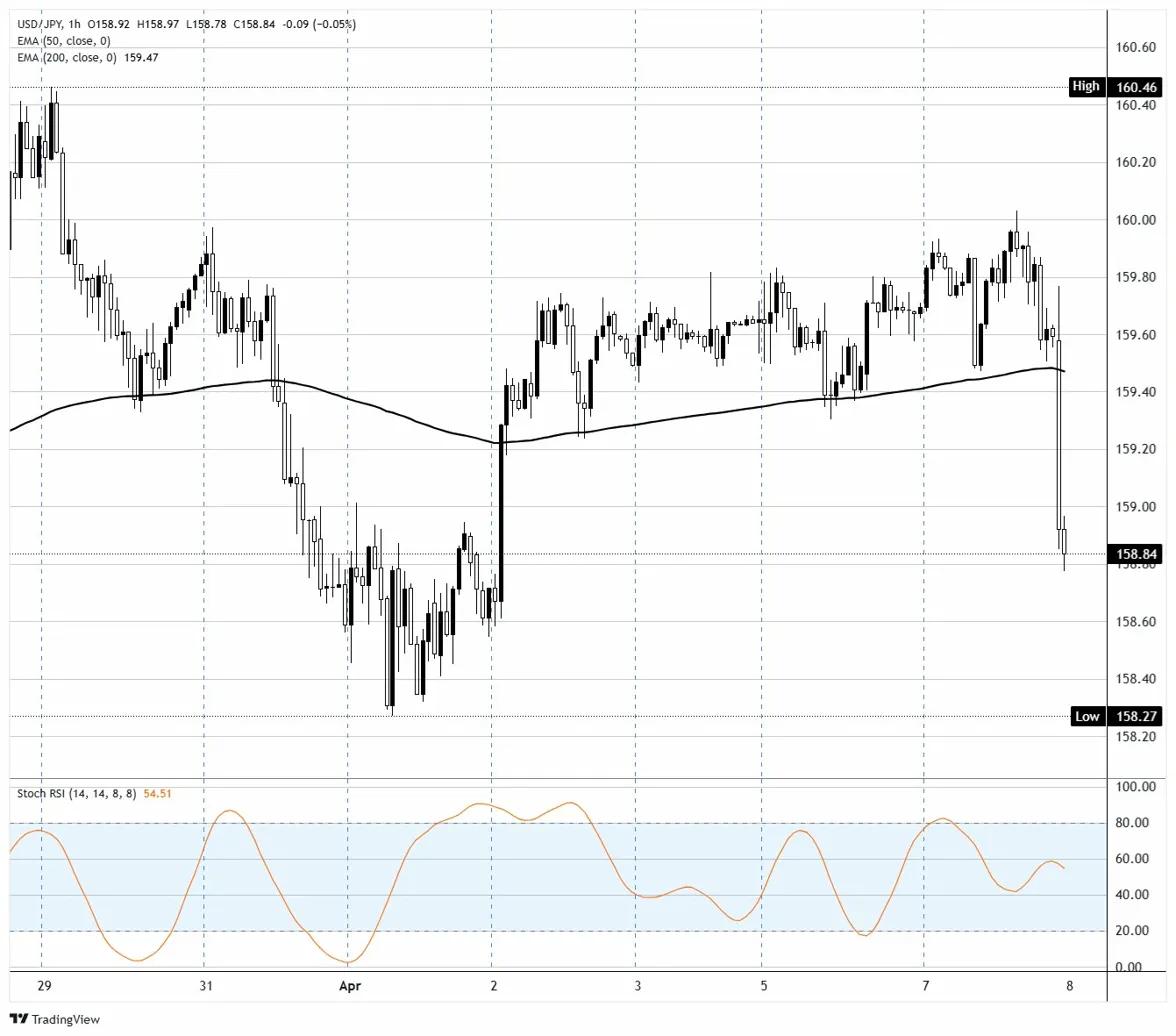
USD/JPY drops below the 200-period EMA on the one-hour chart as Stochastic drifts in neutral territory

On the one-hour chart, USD/JPY has fallen below the 200-period Exponential Moving Average (EMA) around 159.50, after failing at the 160.50 high. The pair is now trading close to 158.85, well below that moving average, with the Stochastic Oscillator sitting in neutral territory after pulling back from an earlier overbought reading. The sharp rejection from 160.00 and the break below the 200-period EMA suggest sellers have gained control in the short term. A break below the 158.30 area would expose the March lows near 157.50, while a reclaim of 159.50 and the 200-period EMA would be the first sign of buyers re-engaging toward the 160.00 level.

Australian Dollar FAQs
What key factors drive the Australian Dollar?

One of the most significant factors for the Australian Dollar (AUD) is the level of interest rates set by the Reserve Bank of Australia (RBA). Because Australia is a resource-rich country another key driver is the price of its biggest export, Iron Ore. The health of the Chinese economy, its largest trading partner, is a factor, as well as inflation in Australia, its growth rate and Trade Balance. Market sentiment – whether investors are taking on more risky assets (risk-on) or seeking safe-havens (risk-off) – is also a factor, with risk-on positive for AUD.

How do the decisions of the Reserve Bank of Australia impact the Australian Dollar?

The Reserve Bank of Australia (RBA) influences the Australian Dollar (AUD) by setting the level of interest rates that Australian banks can lend to each other. This influences the level of interest rates in the economy as a whole. The main goal of the RBA is to maintain a stable inflation rate of 2-3% by adjusting interest rates up or down. Relatively high interest rates compared to other major central banks support the AUD, and the opposite for relatively low. The RBA can also use quantitative easing and tightening to influence credit conditions, with the former AUD-negative and the latter AUD-positive.

How does the health of the Chinese Economy impact the Australian Dollar?

China is Australia’s largest trading partner so the health of the Chinese economy is a major influence on the value of the Australian Dollar (AUD). When the Chinese economy is doing well it purchases more raw materials, goods and services from Australia, lifting demand for the AUD, and pushing up its value. The opposite is the case when the Chinese economy is not growing as fast as expected. Positive or negative surprises in Chinese growth data, therefore, often have a direct impact on the Australian Dollar and its pairs.

How does the price of Iron Ore impact the Australian Dollar?

Iron Ore is Australia’s largest export, accounting for $118 billion a year according to data from 2021, with China as its primary destination. The price of Iron Ore, therefore, can be a driver of the Australian Dollar. Generally, if the price of Iron Ore rises, AUD also goes up, as aggregate demand for the currency increases. The opposite is the case if the price of Iron Ore falls. Higher Iron Ore prices also tend to result in a greater likelihood of a positive Trade Balance for Australia, which is also positive of the AUD.

How does the Trade Balance impact the Australian Dollar?

The Trade Balance, which is the difference between what a country earns from its exports versus what it pays for its imports, is another factor that can influence the value of the Australian Dollar. If Australia produces highly sought after exports, then its currency will gain in value purely from the surplus demand created from foreign buyers seeking to purchase its exports versus what it spends to purchase imports. Therefore, a positive net Trade Balance strengthens the AUD, with the opposite effect if the Trade Balance is negative.

This publication has been prepared by OANDA TMS Brokers S.A. with its registered office in Warsaw, Warsaw UNIT, Daszyńskiego 1, 00-843 Warsaw, registered by the District Court for the Capital City of Warsaw in Warsaw, XIII Commercial Division of the National Court Register under KRS number 0000204776, NIP number 5262759131, with a share capital amounting to PLN 3,537.560, fully paid up, operating in accordance with the Act on Trading in Financial Instruments dated July 29th 2005, exclusively for the needs of OANDA TMS Brokers' clients. OANDA TMS Brokers is subject to the supervision of the Polish Financial Supervision Authority on the basis of an authorization of April 26th 2004 (KPWiG-4021-54-1/2004)

This publication is a commercial publication within the meaning of art. 36 par. 2 of Commission Delegated Regulation (EU) 2017/565 of 25 April 2016 supplementing Directive 2014/65 / EU of the European Parliament and of the Council with regard to the organizational requirements and operating conditions of investment firms and the concepts defined for the purposes of this directive.

Recipients of this publication should consult the financial adviser before taking any investment decision on the basis of this publication.

In the preparation of this document OANDA TMS Brokers not take into account the individual needs and situation of the investor. Investments and services presented or included in this document may not be suitable for a specific investor, therefore, in case of doubts concerning such investments or investment services, it is recommended to consult an independent investment advisor.

Recipients of this report must make their own determination of the appropriateness of an investment in any financial instruments referred to herein based on the merits and risks involved, their own investment strategy and their legal and financial position.

None of the information presented in this publication constitutes investment, legal, accounting or tax advice or a statement that any investment strategy is adequate or appropriate due to individual circumstances related to the recipient, as well as does not constitute any other personal recommendation. OANDA TMS Brokers does not provide tax advisory services related to investing in financial instruments and recommends to contact an independent tax advisor.

OANDA TMS Brokers informs that in the case of a general recommendation service, there is a conflict of interest consisting in the issuance by OANDA TMS Brokers recommendation of a general nature, while OANDA TMS Brokers concluded transactions on the trading portfolio.

This publication is only informative and:

(i) does not constitute or form part of a sale, subscription or invitation to subscribe for any financial instruments,

(ii) it is not intended to offer or purchase or subscribe to or acquire any financial instruments

(iii) does not constitute advertising of any financial instruments

This publication has been prepared with due diligence, reliability and principles of objectivity based on generally available information. The information and opinions contained in this document have been collected or developed by OANDA TMS Brokers based on sources considered reliable, however OANDA TMS Brokers and related entities are not responsible for any inaccuracies or omissions. This document expresses the knowledge and views of its authors, as at the date of preparation.

The results achieved in the past should not be treated as an indication of whether the guarantee of future results. OANDA TMS Brokers is not responsible for investment decisions taken on the basis of this publication or for damages incurred as a result of investment decisions based on this publication.

The date on the first page of this publication is the date of its preparation and publication.

The Stocks service variant is offered in cross-selling together with the CFDs service variant. Detailed information on the risks arising from the various services being part of the cross-selling, as well as information on the costs and fees associated with these services, is available at OANDA TMS Brokers website in the Documents section.

CFDs are complex instruments and involve a high risk of a quick loss of cash due to leverage. 76% of retail investors' accounts record losses as a result of trading CFDs at this supplier. Consider if you understand how CFDs work and whether you can afford a high risk of losing money.

Detailed information about OANDA TMS Brokers, principles of preparing and disseminating recommendations, sources of information, determining recipients of recommendations, professional terminology, conflicts of interest, as well as frequency of issuing and validity of recommendations, are available at www.tmsbrokers.com in the section https://www.tmsbrokers.com/disclaimer

Scroll to top