Daily market news

Forex
22:08 - 22.05.2026
Author:
Elior Manier

A final path to peace? Markets Weekly Outlook

A week ahead preview: Traders are hungry for a peace treaty, after a rollercoaster week. Get ready for the upcoming week by looking at the past week's Market performance, what changed and the key events to expect in next week)

Forex
19:48 - 22.05.2026
Author:
Krzysztof Kamiński

ECB between fighting inflation and weaker growth

Analysis of the ECB’s dilemma as persistent inflation in the eurozone’s largest economies raises the possibility of a June rate hike despite weaker growth prospects.

indices Indices
18:02 - 22.05.2026
Author:
Elior Manier

Stock Markets dance towards new records ahead of a long weekend – Dow Jones, Nasdaq and S&P 500 Intraday Levels

S&P 500, Dow Jones, Nasdaq Analysis and Trading Levels: US stock benchmarks surge toward uncharted territory as a massive wave of geopolitical optimism sweeps Wall Street. Fueled by reports of a Qatari negotiating team arriving in Tehran to help secure a US-Iran peace deal, crude oil prices are sliding lower, allowing the Dow Jones, Nasdaq, and S&P 500 to resume their relentless bullish expansion. Explore the intraday technical levels for the Dow, Nasdaq, and S&P 500.

Forex
15:37 - 22.05.2026
Author:
Elior Manier

USD/JPY trades close to 160.00 after Japan's CPI – More interventions required? – FX Analysis

USD/JPY Technical Analysis: The Japanese Yen faces fresh capitulation risks as Japan's April core CPI drops to a dovish 1.4%, well below the Bank of Japan's 2% target. Driven by domestic fuel subsidies masking Middle East oil shocks, the stark policy divergence with a hawkish Federal Reserve has pushed USD/JPY perilously close to the historic 160.00 handle. Explore our comprehensive technical breakdown and FX intervention outlook.

13:00 - 22.05.2026
Author:

WTI Oil steadies below $98.00 amid mild hopes of an US-Iran peace deal

Crude Oil prices are hovering near 10-day lows, with upside attempts limited below the $98.00 line on Friday, on track to a nearly 4% weekly decline.

commodities Commodities
12:09 - 22.05.2026
Author:

Gold Price Forecast: XAU/USD keeps looking for direction above $4,500

Gold (XAU/USD) trades lower for the second consecutive day on Friday, but remains contained within previous ranges, with downside attempts limited above the $4,500 line for now.

commodities Commodities
11:00 - 22.05.2026
Author:

Silver Price Forecast: XAG/USD struggles around $76 amid US-Iran deal uncertainty

Silver price (XAG/USD) faces selling pressure near $76.00 during the European trading session on Friday. The white metal trades lower due to uncertainty over whether the United States (US) and Iran will reach a deal.

indices Indices
10:00 - 22.05.2026
Author:

S&P 500: Modest gains with Iran-linked relief – Deutsche Bank

Deutsche Bank’s Jim Reid notes that improved sentiment around a potential Iran deal helped the S&P 500 recover earlier losses and close slightly higher.

forex Forex
09:00 - 22.05.2026
Author:

Forex Today: US Dollar holds ground despite US-Iran peace deal optimism

Here is what you need to know on Friday, May 22:

forex Forex
08:00 - 22.05.2026
Author:

AUD/USD Price Forecast: Holds losses below 0.7150 as descending wedge emerges

AUD/USD extends its losses after a slight decline in the previous day, trading around 0.7140 during the Asian hours on Friday.

OANDA's pick for the day

22:39 - 07.05.2026
Is the party over already? – North American Session Market Wrap for May 7
22:29 - 06.05.2026
The Peace rally can't be stopped – North American Session Market Wrap for May 6
22:11 - 04.05.2026
Sentiment waves are on a shore-break – North American Session Market Wrap for May 4
22:03 - 30.04.2026
It's an all-out rally after the Central Bank holds – North American Session Market Wrap for April 30
forex Forex
06:00 - 21.05.2026
Forex
06:00 - 21.05.2026

USD/JPY Price Forecast: Trades flat near 159.00 as investors seek fresh developments on Iran war

  • USD/JPY flattens around 159.00 in countdown to US-Iran deal announcement.
  • US President Trump said that Washington is in final stages over deal with Iran.
  • 10-year JGB yields remain firm due to growing Japan fiscal worries.

The USD/JPY pair trades calmly around 159.00 during the Asian trading session on Thursday. The pair turns sideways as investors await fresh developments regarding negotiations between the United States (US) and Iran, after President Donald Trump stated on Wednesday that talks are in “final stages”.

As of writing, the US Dollar Index (DXY), which tracks the Greenback's value against six major currencies, trades marginally higher to near 99.20. The DXY’s rally hit pause on Wednesday after posting a fresh six-week high at 99.47, following US President Trump expressing confidence that a deal with Iran would be finalized soon.

We’re in the final stages of Iran. We’ll see what happens. Either have a deal or we’re going to do some things that are a little bit nasty, but hopefully that won’t happen,” Trump said, Bloomberg reported.

The optimism over the US-Iran, which resulted in a sharp decline in oil prices, has also slightly diminished expectations supporting the Federal Reserve (Fed) to hike interest rates this year. According to the CME FedWatch tool, the odds of the Fed delivering at least one interest rate hike this year have cooled down to 51% from 61.3% seen on Tuesday. Still, there is a sharp turnaround from two interest rate cuts anticipated before the Middle East war started.

In Japan, the announcement of an extra budget by Prime Minister (PM) Sanae Takaichi, which aims to offset the impact of the Middle East situation has raised fiscal concerns. 10-year Japan Government Bond (JGB) yields are up 0.11% to near 2.77%, close to its multi-decade high of 2.81% posted on Tuesday.

USD/JPY technical analysis

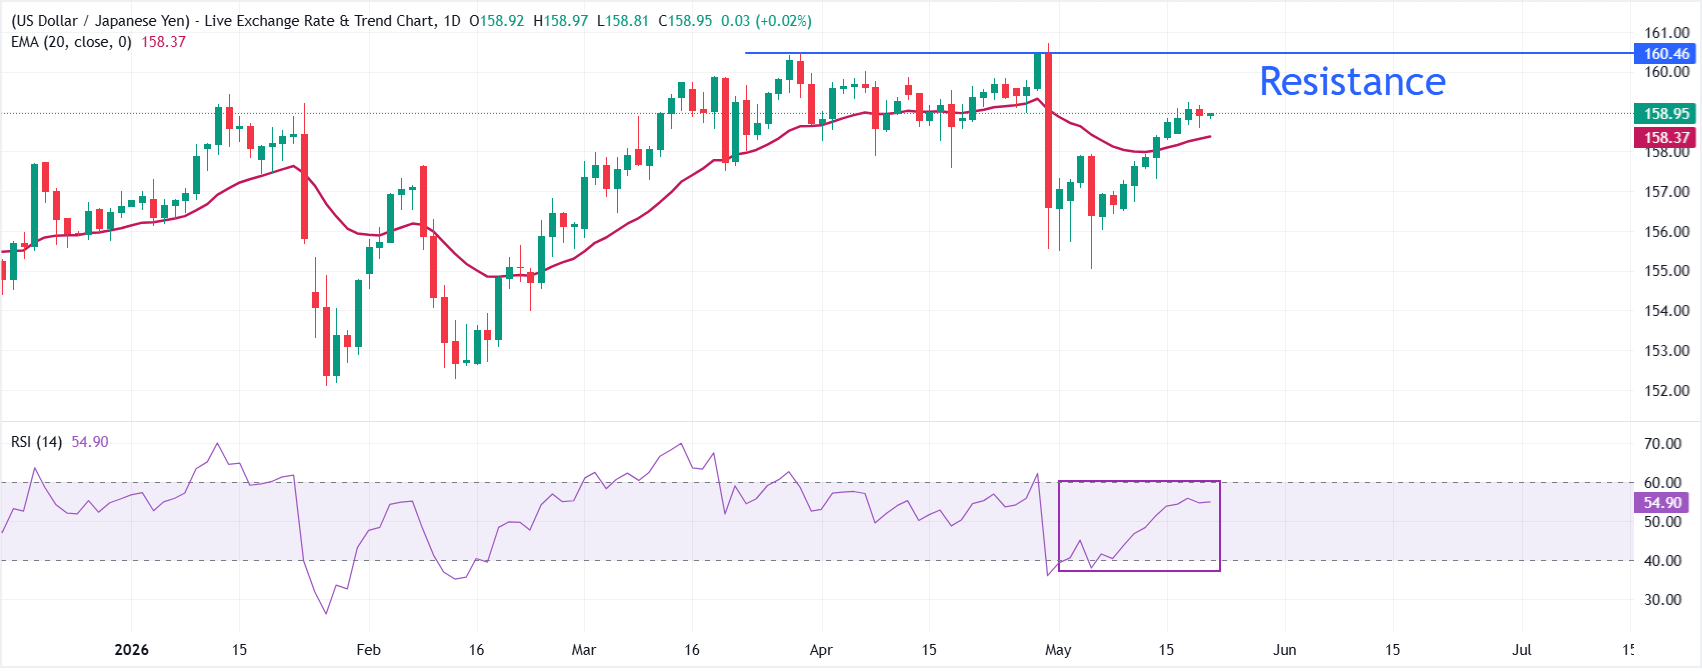
USD/JPY trades almost flat at around 159.00 at the press time. The pair holds a modest bullish bias as it remains above the 20-day exponential moving average (EMA) at 158.37.

The Relative Strength Index (RSI) is around 55 points to neutral-to-positive momentum, hinting that buyers still have the upper hand while avoiding overbought conditions.

On the downside, immediate support is located at the 20-day EMA near 158.37, where a daily close below would weaken the constructive tone and open the door to a deeper corrective slide towards the May 14 low of 157.31. Looking up, the pair aims to revisit the April 30 high of 160.73.

(The technical analysis of this story was written with the help of an AI tool.)

US Dollar FAQs

What is the US Dollar?

The US Dollar (USD) is the official currency of the United States of America, and the ‘de facto’ currency of a significant number of other countries where it is found in circulation alongside local notes. It is the most heavily traded currency in the world, accounting for over 88% of all global foreign exchange turnover, or an average of $6.6 trillion in transactions per day, according to data from 2022. Following the second world war, the USD took over from the British Pound as the world’s reserve currency. For most of its history, the US Dollar was backed by Gold, until the Bretton Woods Agreement in 1971 when the Gold Standard went away.

How do the decisions of the Federal Reserve impact the US Dollar?

The most important single factor impacting on the value of the US Dollar is monetary policy, which is shaped by the Federal Reserve (Fed). The Fed has two mandates: to achieve price stability (control inflation) and foster full employment. Its primary tool to achieve these two goals is by adjusting interest rates. When prices are rising too quickly and inflation is above the Fed’s 2% target, the Fed will raise rates, which helps the USD value. When inflation falls below 2% or the Unemployment Rate is too high, the Fed may lower interest rates, which weighs on the Greenback.

What is Quantitative Easing and how does it influence the US Dollar?

In extreme situations, the Federal Reserve can also print more Dollars and enact quantitative easing (QE). QE is the process by which the Fed substantially increases the flow of credit in a stuck financial system. It is a non-standard policy measure used when credit has dried up because banks will not lend to each other (out of the fear of counterparty default). It is a last resort when simply lowering interest rates is unlikely to achieve the necessary result. It was the Fed’s weapon of choice to combat the credit crunch that occurred during the Great Financial Crisis in 2008. It involves the Fed printing more Dollars and using them to buy US government bonds predominantly from financial institutions. QE usually leads to a weaker US Dollar.

What is Quantitative Tightening and how does it influence the US Dollar?

Quantitative tightening (QT) is the reverse process whereby the Federal Reserve stops buying bonds from financial institutions and does not reinvest the principal from the bonds it holds maturing in new purchases. It is usually positive for the US Dollar.

This publication has been prepared by OANDA TMS Brokers S.A. with its registered office in Warsaw, Warsaw UNIT, Daszyńskiego 1, 00-843 Warsaw, registered by the District Court for the Capital City of Warsaw in Warsaw, XIII Commercial Division of the National Court Register under KRS number 0000204776, NIP number 5262759131, with a share capital amounting to PLN 3,537.560, fully paid up, operating in accordance with the Act on Trading in Financial Instruments dated July 29th 2005, exclusively for the needs of OANDA TMS Brokers' clients. OANDA TMS Brokers is subject to the supervision of the Polish Financial Supervision Authority on the basis of an authorization of April 26th 2004 (KPWiG-4021-54-1/2004)

This publication is a commercial publication within the meaning of art. 36 par. 2 of Commission Delegated Regulation (EU) 2017/565 of 25 April 2016 supplementing Directive 2014/65 / EU of the European Parliament and of the Council with regard to the organizational requirements and operating conditions of investment firms and the concepts defined for the purposes of this directive.

Recipients of this publication should consult the financial adviser before taking any investment decision on the basis of this publication.

In the preparation of this document OANDA TMS Brokers not take into account the individual needs and situation of the investor. Investments and services presented or included in this document may not be suitable for a specific investor, therefore, in case of doubts concerning such investments or investment services, it is recommended to consult an independent investment advisor.

Recipients of this report must make their own determination of the appropriateness of an investment in any financial instruments referred to herein based on the merits and risks involved, their own investment strategy and their legal and financial position.

None of the information presented in this publication constitutes investment, legal, accounting or tax advice or a statement that any investment strategy is adequate or appropriate due to individual circumstances related to the recipient, as well as does not constitute any other personal recommendation. OANDA TMS Brokers does not provide tax advisory services related to investing in financial instruments and recommends to contact an independent tax advisor.

OANDA TMS Brokers informs that in the case of a general recommendation service, there is a conflict of interest consisting in the issuance by OANDA TMS Brokers recommendation of a general nature, while OANDA TMS Brokers concluded transactions on the trading portfolio.

This publication is only informative and:

(i) does not constitute or form part of a sale, subscription or invitation to subscribe for any financial instruments,

(ii) it is not intended to offer or purchase or subscribe to or acquire any financial instruments

(iii) does not constitute advertising of any financial instruments

This publication has been prepared with due diligence, reliability and principles of objectivity based on generally available information. The information and opinions contained in this document have been collected or developed by OANDA TMS Brokers based on sources considered reliable, however OANDA TMS Brokers and related entities are not responsible for any inaccuracies or omissions. This document expresses the knowledge and views of its authors, as at the date of preparation.

The results achieved in the past should not be treated as an indication of whether the guarantee of future results. OANDA TMS Brokers is not responsible for investment decisions taken on the basis of this publication or for damages incurred as a result of investment decisions based on this publication.

The date on the first page of this publication is the date of its preparation and publication.

The Stocks service variant is offered in cross-selling together with the CFDs service variant. Detailed information on the risks arising from the various services being part of the cross-selling, as well as information on the costs and fees associated with these services, is available at OANDA TMS Brokers website in the Documents section.

CFDs are complex instruments and involve a high risk of a quick loss of cash due to leverage. 76% of retail investors' accounts record losses as a result of trading CFDs at this supplier. Consider if you understand how CFDs work and whether you can afford a high risk of losing money.

Detailed information about OANDA TMS Brokers, principles of preparing and disseminating recommendations, sources of information, determining recipients of recommendations, professional terminology, conflicts of interest, as well as frequency of issuing and validity of recommendations, are available at www.tmsbrokers.com in the section https://www.tmsbrokers.com/disclaimer

Scroll to top