Daily market news

commodities Commodities
13:00 - 07.05.2026
Author:

Silver Price Forecasts: XAG/USD rallies beyond $80.00 amid risk appetite, lower US yields

Silver (XAG/USD) keeps rallying on Thursday, with precious metals buoyed by lower Treasury yields amid a pullback in oil prices that has eased bets on US Federal Reserve (Fed) rate hikes.

forex Forex
12:00 - 07.05.2026
Author:

Forex Today: US Dollar retreats on US-Iran peace hopes

Here is what you need to know on Thursday, May 7:

11:00 - 07.05.2026
Author:

WTI Oil dips to levels approaching $90.00 amid Hormuz opening rumours

Crude Oil prices extend losses for the third consecutive day on Thursday, with the US benchmark West Texas Intermediate (WTI) trading at $90.66 at the time of writing, as progress in the US-Iran peace talks has sparked speculation about the reopening of the Strait of Hormuz.

commodities Commodities
10:00 - 07.05.2026
Author:

Silver Price Forecasts: XAG/USD extends gains with bulls eyeing $80.00

Silver (XAG/USD) appreciates for the second consecutive day on Thursday, with precious metals buoyed amid lower Treasury yields, as the decline in Oil prices has eased bets on US Federal Reserve (Fed) rate hikes.

forex Forex
09:00 - 07.05.2026
Author:

USD/JPY: Intervention risks and 155 target – OCBC

OCBC strategists Sim Moh Siong and Christopher Wong highlight that recent USD/JPY moves likely reflect Japanese intervention, with 158 replacing 160 as the key line.

forex Forex
08:00 - 07.05.2026
Author:

AUD/USD Price Forecast: Retains bullish bias near 0.7250, multi-year top on softer USD

The AUD/USD pair attracts some dip-buyers during the Asian session on Thursday and stalls the previous day's late pullback from the 0.7275-0.7280 region, or its highest level since June 2022. Spot prices currently trade around mid-0.7200s, up for the third straight day.

commodities Commodities
07:51 - 07.05.2026
Author:
kelvin_wong
Kelvin Wong

Chart alert: Gold (XAU/USD) rally faces roadblock at 20-day and 50-day moving averages

Gold (XAU/USD) surged 3% as easing US–Iran tensions and expectations of a more dovish Federal Reserve weakened the US dollar. However, the rally is facing resistance near the 20-day and 50-day moving averages, while firm US real yields continue to cap upside momentum. Technical indicators suggest bullish momentum is fading, with bearish divergence on RSI and resistance at 4,775 remaining a key hurdle. Traders are now watching whether gold can sustain gains or resume its broader correction.

forex Forex
07:00 - 07.05.2026
Author:

GBP/USD Price Forecast: Holds gains near 1.3600 as bullish bias prevails

GBP/USD remains stronger for the third consecutive day, trading around 1.3600 during the Asian hours on Thursday. The technical analysis of the daily chart indicates an improving bullish trend as the pair rebounds from the lower boundary of the ascending channel.

forex Forex
06:00 - 07.05.2026
Author:

EUR/JPY trades flat around 183.75 while investors remain on toes amid intervention hopes

The EUR/JPY pair trades in a tight range around 183.75 during the Asian trading session on Thursday. The pair struggles for a direction as investors remain on the sidelines amid hopes that Japan’s Ministry of Finance (MoF) could intervene again.

commodities Commodities
04:23 - 07.05.2026
Author:
kelvin_wong
Kelvin Wong

Asia open: Stock markets rally on US-Iran peace hopes; tech drives S&P 500 to record highs

Global stock markets rallied to record highs as hopes for a US–Iran peace agreement boosted investor risk appetite and pushed oil prices sharply lower. Semiconductor stocks led the advance, with Intel and AMD surging on strong AI-driven momentum and partnership optimism. The weaker US dollar fueled a sharp rebound in gold above $4,700, while the Japanese yen strengthened amid suspected intervention. Asian markets also climbed, supported by easing energy risks and tech-led gains.

OANDA's pick for the day

22:29 - 06.05.2026
The Peace rally can't be stopped – North American Session Market Wrap for May 6
22:11 - 04.05.2026
Sentiment waves are on a shore-break – North American Session Market Wrap for May 4
22:03 - 30.04.2026
It's an all-out rally after the Central Bank holds – North American Session Market Wrap for April 30
22:51 - 28.04.2026
Tech gives up its advantage as fears return – North American Session Market Wrap for April 28
commodities Commodities
10:00 - 07.05.2026
Commodities
10:00 - 07.05.2026

Silver Price Forecasts: XAG/USD extends gains with bulls eyeing $80.00

  • XAG/USD pierces April 22 highs at the $78.70 area, aiming for $80.00.
  • Precious metals rally as lower Oil prices push US Treasury yields down.
  • Technical momentum indicators are reaching overbought levels.

Silver (XAG/USD) appreciates for the second consecutive day on Thursday, with precious metals buoyed amid lower Treasury yields, as the decline in Oil prices has eased bets on US Federal Reserve (Fed) rate hikes. XAG/USD is now testing April 22 highs at $78.70, with bulls aiming for the $80.00 psychological area.

News that the US and Iran are getting close to a peace deal boosted investors’ appetite for risk on Wednesday and sent the US Dollar (USD) tumbling, providing a fresh boost to precious metals. Apart from that, Oil prices declined nearly 8%, pushing US Treasury yields lower and providing additional support to the yieldless precious metals.

Technical Analysis: Technical indicators are reaching overbought levels

XAG/USD Chart Analysis


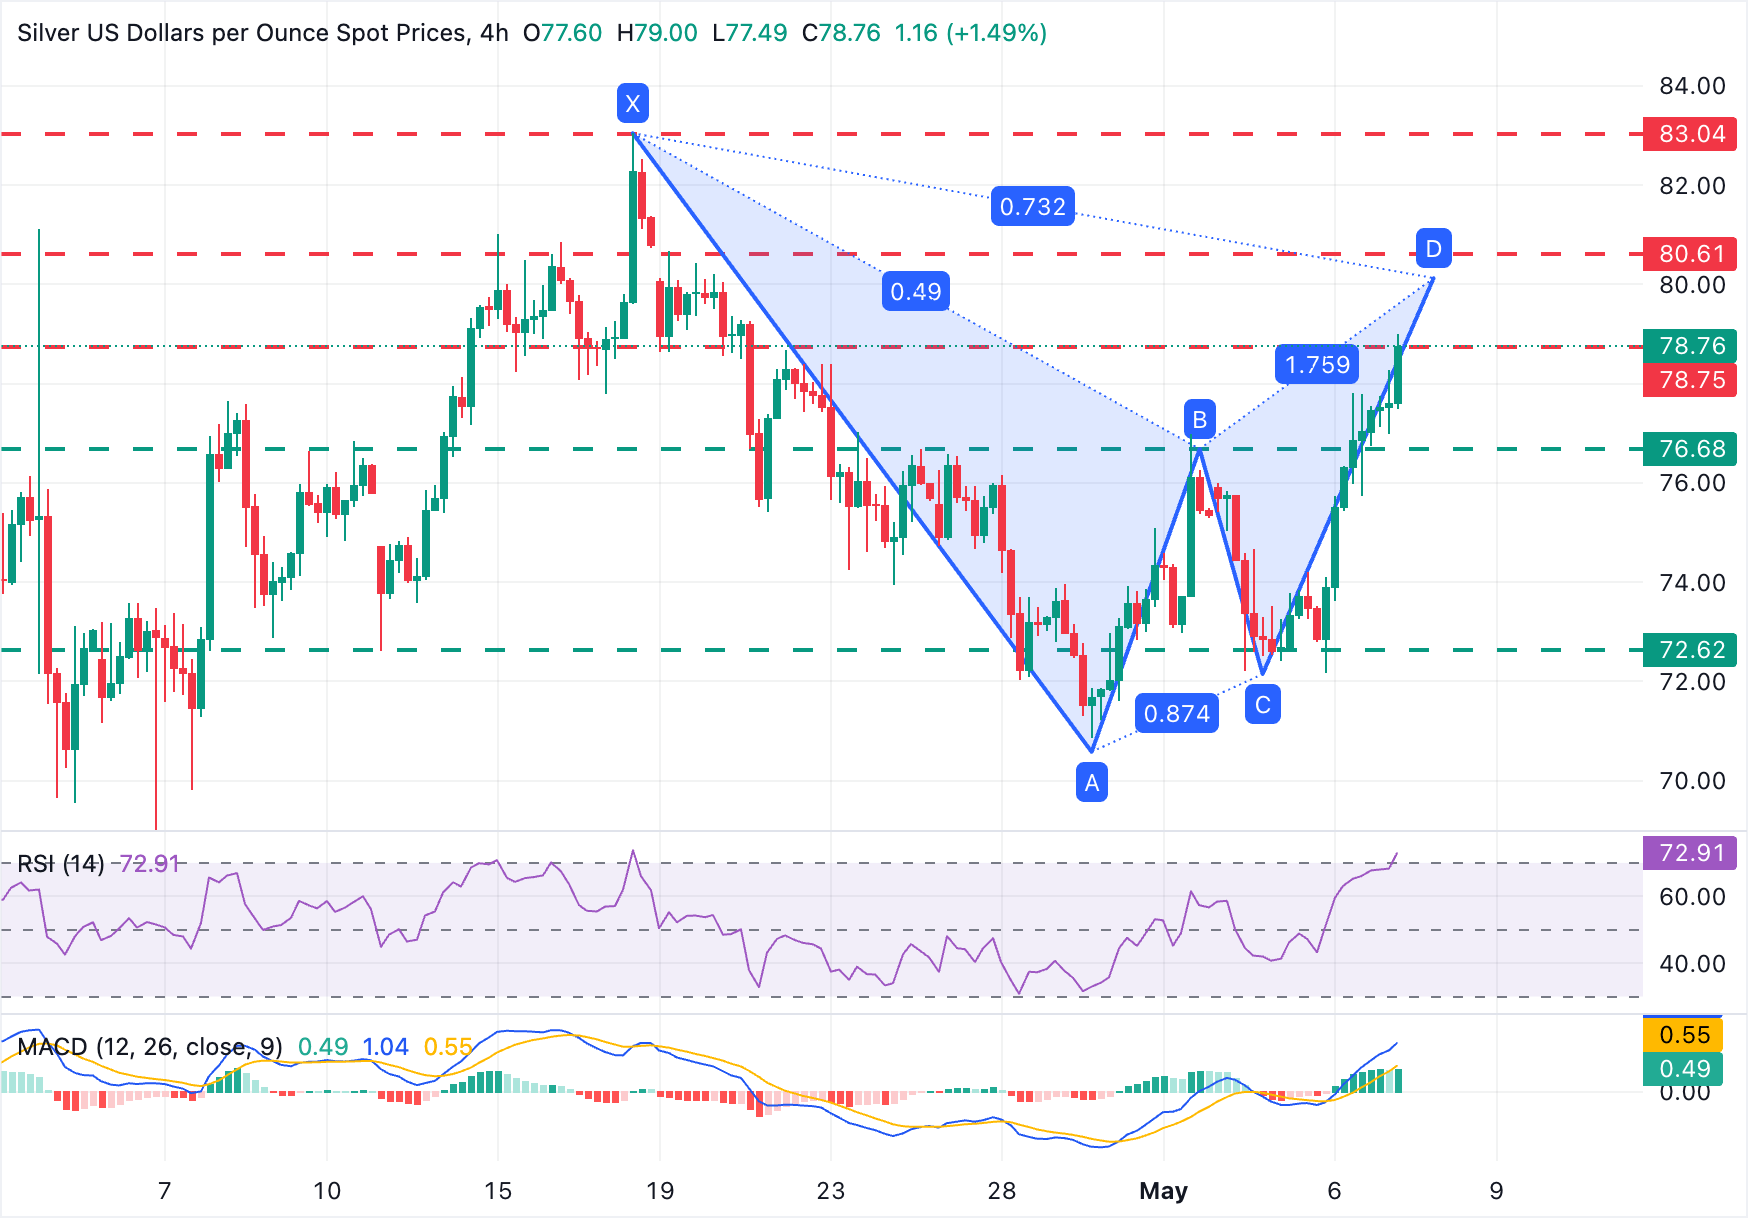
XAG/USD performed a sharp recovery on Wednesday, printing a bullish engulfing candle on the daily chart, which, together with the higher low on Monday, confirms that a trend shift is in progress.

Technical indicators are in bullish territory, but the oversold levels in the 4-hour Relative Strength Index (RSI) suggest that the latest advance is stretched and a consolidation or some pullback might be ahead. The Moving Average Convergence Divergence (MACD) in the same timeframe, however, remains positive, reinforcing upside pressure.

Recent price action suggests that we are in the C-D leg of a Gartley pattern, aiming for the April 20 highs, right above the $80.00 psychological level. Here, the pair might take a rest before setting its focus on April's peak at $83.06. On the downside, the previous range top, at the $76.70 area, might provide some support ahead of the weekly low, at the $72.15 area.

(The technical analysis of this story was written with the help of an AI tool.)

Silver FAQs

Why do people invest in Silver?

Silver is a precious metal highly traded among investors. It has been historically used as a store of value and a medium of exchange. Although less popular than Gold, traders may turn to Silver to diversify their investment portfolio, for its intrinsic value or as a potential hedge during high-inflation periods. Investors can buy physical Silver, in coins or in bars, or trade it through vehicles such as Exchange Traded Funds, which track its price on international markets.

Which factors influence Silver prices?

Silver prices can move due to a wide range of factors. Geopolitical instability or fears of a deep recession can make Silver price escalate due to its safe-haven status, although to a lesser extent than Gold's. As a yieldless asset, Silver tends to rise with lower interest rates. Its moves also depend on how the US Dollar (USD) behaves as the asset is priced in dollars (XAG/USD). A strong Dollar tends to keep the price of Silver at bay, whereas a weaker Dollar is likely to propel prices up. Other factors such as investment demand, mining supply – Silver is much more abundant than Gold – and recycling rates can also affect prices.

How does industrial demand affect Silver prices?

Silver is widely used in industry, particularly in sectors such as electronics or solar energy, as it has one of the highest electric conductivity of all metals – more than Copper and Gold. A surge in demand can increase prices, while a decline tends to lower them. Dynamics in the US, Chinese and Indian economies can also contribute to price swings: for the US and particularly China, their big industrial sectors use Silver in various processes; in India, consumers’ demand for the precious metal for jewellery also plays a key role in setting prices.

How do Silver prices react to Gold’s moves?

Silver prices tend to follow Gold's moves. When Gold prices rise, Silver typically follows suit, as their status as safe-haven assets is similar. The Gold/Silver ratio, which shows the number of ounces of Silver needed to equal the value of one ounce of Gold, may help to determine the relative valuation between both metals. Some investors may consider a high ratio as an indicator that Silver is undervalued, or Gold is overvalued. On the contrary, a low ratio might suggest that Gold is undervalued relative to Silver.

This publication has been prepared by OANDA TMS Brokers S.A. with its registered office in Warsaw, Warsaw UNIT, Daszyńskiego 1, 00-843 Warsaw, registered by the District Court for the Capital City of Warsaw in Warsaw, XIII Commercial Division of the National Court Register under KRS number 0000204776, NIP number 5262759131, with a share capital amounting to PLN 3,537.560, fully paid up, operating in accordance with the Act on Trading in Financial Instruments dated July 29th 2005, exclusively for the needs of OANDA TMS Brokers' clients. OANDA TMS Brokers is subject to the supervision of the Polish Financial Supervision Authority on the basis of an authorization of April 26th 2004 (KPWiG-4021-54-1/2004)

This publication is a commercial publication within the meaning of art. 36 par. 2 of Commission Delegated Regulation (EU) 2017/565 of 25 April 2016 supplementing Directive 2014/65 / EU of the European Parliament and of the Council with regard to the organizational requirements and operating conditions of investment firms and the concepts defined for the purposes of this directive.

Recipients of this publication should consult the financial adviser before taking any investment decision on the basis of this publication.

In the preparation of this document OANDA TMS Brokers not take into account the individual needs and situation of the investor. Investments and services presented or included in this document may not be suitable for a specific investor, therefore, in case of doubts concerning such investments or investment services, it is recommended to consult an independent investment advisor.

Recipients of this report must make their own determination of the appropriateness of an investment in any financial instruments referred to herein based on the merits and risks involved, their own investment strategy and their legal and financial position.

None of the information presented in this publication constitutes investment, legal, accounting or tax advice or a statement that any investment strategy is adequate or appropriate due to individual circumstances related to the recipient, as well as does not constitute any other personal recommendation. OANDA TMS Brokers does not provide tax advisory services related to investing in financial instruments and recommends to contact an independent tax advisor.

OANDA TMS Brokers informs that in the case of a general recommendation service, there is a conflict of interest consisting in the issuance by OANDA TMS Brokers recommendation of a general nature, while OANDA TMS Brokers concluded transactions on the trading portfolio.

This publication is only informative and:

(i) does not constitute or form part of a sale, subscription or invitation to subscribe for any financial instruments,

(ii) it is not intended to offer or purchase or subscribe to or acquire any financial instruments

(iii) does not constitute advertising of any financial instruments

This publication has been prepared with due diligence, reliability and principles of objectivity based on generally available information. The information and opinions contained in this document have been collected or developed by OANDA TMS Brokers based on sources considered reliable, however OANDA TMS Brokers and related entities are not responsible for any inaccuracies or omissions. This document expresses the knowledge and views of its authors, as at the date of preparation.

The results achieved in the past should not be treated as an indication of whether the guarantee of future results. OANDA TMS Brokers is not responsible for investment decisions taken on the basis of this publication or for damages incurred as a result of investment decisions based on this publication.

The date on the first page of this publication is the date of its preparation and publication.

The Stocks service variant is offered in cross-selling together with the CFDs service variant. Detailed information on the risks arising from the various services being part of the cross-selling, as well as information on the costs and fees associated with these services, is available at OANDA TMS Brokers website in the Documents section.

CFDs are complex instruments and involve a high risk of a quick loss of cash due to leverage. 76% of retail investors' accounts record losses as a result of trading CFDs at this supplier. Consider if you understand how CFDs work and whether you can afford a high risk of losing money.

Detailed information about OANDA TMS Brokers, principles of preparing and disseminating recommendations, sources of information, determining recipients of recommendations, professional terminology, conflicts of interest, as well as frequency of issuing and validity of recommendations, are available at www.tmsbrokers.com in the section https://www.tmsbrokers.com/disclaimer

Scroll to top