Daily market news

forex Forex
14:00 - 13.05.2026
Author:

GBP/USD Price Forecast: Extends decline below 20-day EMA

The GBP/USD pair is down 0.25% to near 1.3500 during the European trading session on Wednesday. The Cable faces selling pressure as the US Dollar (USD) trades firmly due to growing expectations that the Federal Reserve (Fed) will deliver at least one interest rate hike this year.

13:00 - 13.05.2026
Author:

ECB to hike interest rates in June – Reuters poll

According to a Reuters poll, the European Central Bank (ECB) will hike the deposit rate by 25 basis points (bps) to 2.25% in June, said 59 of 70 economists (vs 44 of 85 in April survey).

forex Forex
12:00 - 13.05.2026
Author:

NZD/USD Price Forecast: Bears taking control with 0.5930 support under pressure

The New Zealand Dollar (NZD) is showing the weakest performance of the G8 currencies on Wednesday, heading lower for the second consecutive day against a stronger US Dollar (USD), with NZD/USD bears testing the bottom of the weekly range at 0.5930 at the time of writing.

indices Indices
11:00 - 13.05.2026
Author:

S&P 500: Equities pressured by Oil and inflation – Deutsche Bank

Deutsche Bank’s Jim Reid notes that higher Oil prices and hawkish US inflation data created a challenging backdrop for equities.

10:00 - 13.05.2026
Author:

WTI Price Forecast: Struggles to reclaim $100, outlook remains firm

West Texas Intermediate (WTI), futures on NYMEX, corrects to near $97.20 during the European trading session on Wednesday. The Oil price gives back some of its recent gains as escalating hawkish Federal Reserve (Fed) bets have raised concerns over the oil demand outlook.

forex Forex
09:00 - 13.05.2026
Author:

GBP/USD Price Forecast: Holds modest upside while staying anchored above 100-day EMA support

The GBP/USD pair trades on a positive note around 1.3550 during the early European trading hours on Wednesday.

commodities Commodities
08:00 - 13.05.2026
Author:

Silver Price Forecast: XAG/USD holds onto gains around $87, ignoring hawkish Fed bets

Silver price (XAG/USD) trades firmly near $87.00 in the early European trade on Wednesday. Earlier in the day, the white metal posted a fresh two-month high of $87.82.

indices Indices
07:34 - 13.05.2026
Author:
kelvin_wong
Kelvin Wong

Chart alert: Nasdaq 100 faces pullback risk as semiconductor rally shows signs of exhaustion

Nasdaq 100 surged to a fresh all-time high of 29,390 as semiconductor and AI-related stocks continued to fuel the rally. However, growing signs of bullish exhaustion in the semiconductor sector, particularly within the SOXX ETF, are raising the risk of a short-term corrective pullback. Bearish RSI divergence, stretched price action above the 20-day moving average, and elevated volatility conditions suggest the Nasdaq 100 may face a minor mean reversion decline below the 29,505/615 resistance.

06:00 - 13.05.2026
Author:

WTI corrects to near $97.20 amid oil demand concerns, Trump-Xi meeting in focus

West Texas Intermediate (WTI), futures on NYMEX, is down 1.5% to near $97.20 during the Asian trading session on Wednesday.

commodities Commodities
04:01 - 13.05.2026
Author:
kelvin_wong
Kelvin Wong

Asia open: US inflation reaccelerates to 3.8%, and chip stocks falter

US inflation surged to 3.8% in April, the highest level in three years, wiping out Federal Reserve rate cut expectations and pushing Treasury yields and the US dollar higher. Meanwhile, semiconductor stocks sharply reversed after a massive six-week rally, dragging the Nasdaq 100 lower. USD/JPY climbed toward the key 157.90 intervention risk level as traders monitored possible Japanese authorities’ action amid rising market volatility and fading US-Iran peace hopes.

OANDA's pick for the day

22:39 - 07.05.2026
Is the party over already? – North American Session Market Wrap for May 7
22:29 - 06.05.2026
The Peace rally can't be stopped – North American Session Market Wrap for May 6
22:11 - 04.05.2026
Sentiment waves are on a shore-break – North American Session Market Wrap for May 4
22:03 - 30.04.2026
It's an all-out rally after the Central Bank holds – North American Session Market Wrap for April 30
commodities Commodities
17:00 - 14.08.2024
Commodities
17:00 - 14.08.2024

Silver Price Forecast: XAG/USD remains subdued near $28 as Fed big rate-cut bets wane

Silver price remains below $28.00 as expectations for Fed big interest-rate cut diminishes. US headline and core inflation decelerated one-tenth to 2.9% and 3.2%, respectively, in July. The next trigger for the Silver price will be the monthly US Retail Sales, scheduled for Thursday.

Silver price (XAG/USD) exhibits a subdued performance near $28.00 in Wednesday’s New York session. The white metal faces pressure as market expectations for the Federal Reserve (Fed) big interest-rate cut announcement in September have waned after the release of the United States (US) Consumer Price Index (CPI) report for July.

According to the CME FedWatch tool, the probability for reduction in key borrowing rates by 50 basis points (bps) has declined to 41.5% from 54% in September after the release of the inflation report. However, the data gives a clear signal that the Fed will cut interest rates next month.

The CPI report showed that annual headline and core inflation, which excludes volatile items such as food and energy, decelerated by one-tenth to 2.9% and 3.2%, respectively. The decline in price pressures was broadly in line with market consensus. The month-on-month headline and core inflation also rose by 0.2%, as expected.

Meanwhile, the US Dollar (USD) has dropped further as the inflation data has boosted investors’ confidence that price pressures on track to return to the desired rate of 2%. The US Dollar Index (DXY), which tracks the Greenback’s value against six major currencies, posts fresh weekly low at 103.30.

Going forward, the next trigger for the Silver price will be the US monthly Retail Sales data for July, which will be published on Thursday.

Silver technical forecast

Silver price continues to remain below the 20-day Exponential Moving Average (EMA) near $28.20, suggesting that near-term trend is bearish. While the 200-day EMA near $26.90 continues to provide support to the Silver price bulls.

The major cushion for the Silver price will be the horizontal support plotted from May 5 high at $26.14.

The 14-day Relative Strength Index (RSI) hovers near 40.00. A decisive break below the same will trigger a bearish momentum.

Silver daily chart

Silver FAQs
Why do people invest in Silver?

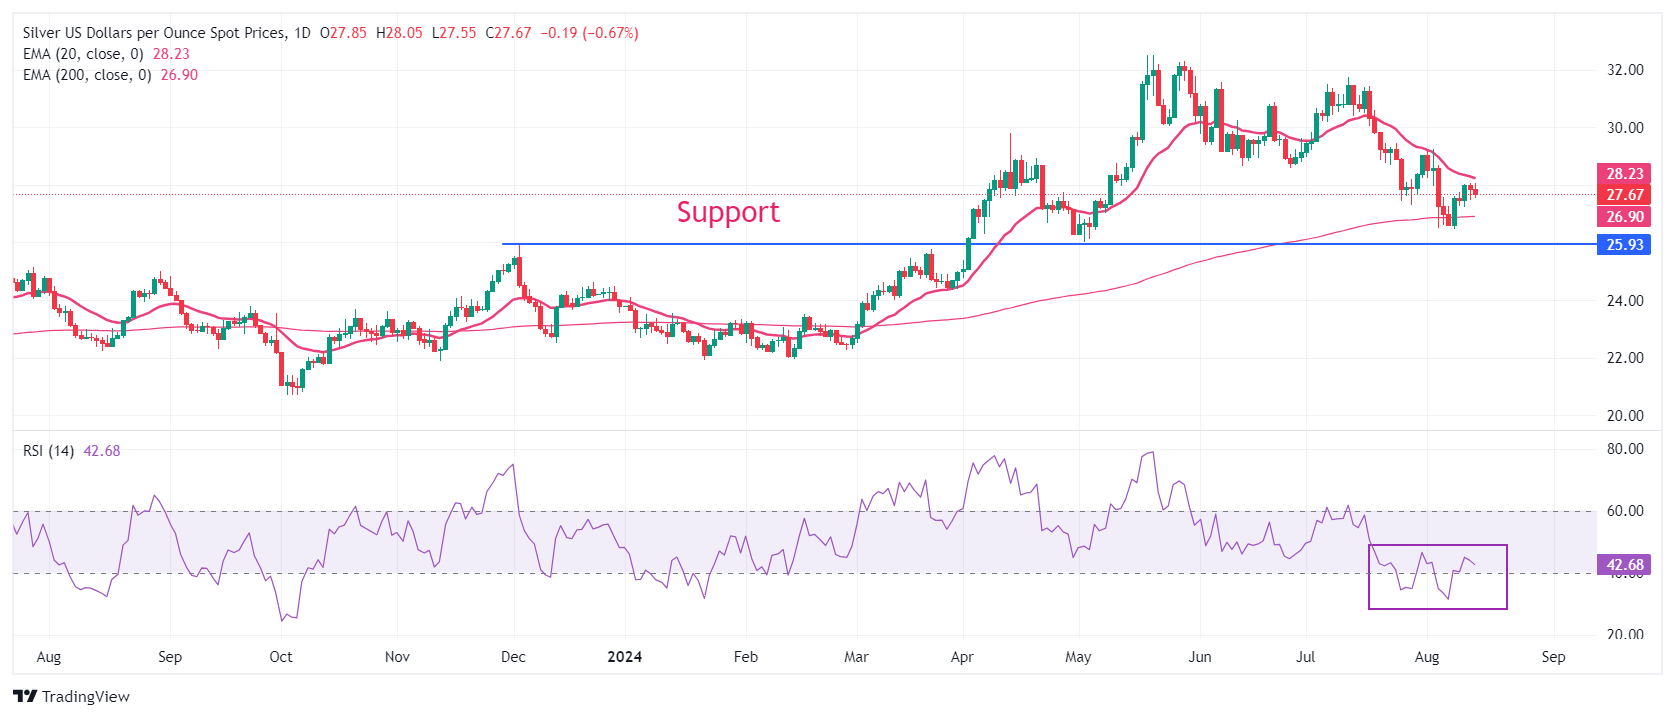
Silver is a precious metal highly traded among investors. It has been historically used as a store of value and a medium of exchange. Although less popular than Gold, traders may turn to Silver to diversify their investment portfolio, for its intrinsic value or as a potential hedge during high-inflation periods. Investors can buy physical Silver, in coins or in bars, or trade it through vehicles such as Exchange Traded Funds, which track its price on international markets.

Which factors influence Silver prices?

Silver prices can move due to a wide range of factors. Geopolitical instability or fears of a deep recession can make Silver price escalate due to its safe-haven status, although to a lesser extent than Gold's. As a yieldless asset, Silver tends to rise with lower interest rates. Its moves also depend on how the US Dollar (USD) behaves as the asset is priced in dollars (XAG/USD). A strong Dollar tends to keep the price of Silver at bay, whereas a weaker Dollar is likely to propel prices up. Other factors such as investment demand, mining supply – Silver is much more abundant than Gold – and recycling rates can also affect prices.

How does industrial demand affect Silver prices?

Silver is widely used in industry, particularly in sectors such as electronics or solar energy, as it has one of the highest electric conductivity of all metals – more than Copper and Gold. A surge in demand can increase prices, while a decline tends to lower them. Dynamics in the US, Chinese and Indian economies can also contribute to price swings: for the US and particularly China, their big industrial sectors use Silver in various processes; in India, consumers’ demand for the precious metal for jewellery also plays a key role in setting prices.

How do Silver prices react to Gold’s moves?

Silver prices tend to follow Gold's moves. When Gold prices rise, Silver typically follows suit, as their status as safe-haven assets is similar. The Gold/Silver ratio, which shows the number of ounces of Silver needed to equal the value of one ounce of Gold, may help to determine the relative valuation between both metals. Some investors may consider a high ratio as an indicator that Silver is undervalued, or Gold is overvalued. On the contrary, a low ratio might suggest that Gold is undervalued relative to Silver.


This publication has been prepared by OANDA TMS Brokers S.A. with its registered office in Warsaw, Warsaw UNIT, Daszyńskiego 1, 00-843 Warsaw, registered by the District Court for the Capital City of Warsaw in Warsaw, XIII Commercial Division of the National Court Register under KRS number 0000204776, NIP number 5262759131, with a share capital amounting to PLN 3,537.560, fully paid up, operating in accordance with the Act on Trading in Financial Instruments dated July 29th 2005, exclusively for the needs of OANDA TMS Brokers' clients. OANDA TMS Brokers is subject to the supervision of the Polish Financial Supervision Authority on the basis of an authorization of April 26th 2004 (KPWiG-4021-54-1/2004)

This publication is a commercial publication within the meaning of art. 36 par. 2 of Commission Delegated Regulation (EU) 2017/565 of 25 April 2016 supplementing Directive 2014/65 / EU of the European Parliament and of the Council with regard to the organizational requirements and operating conditions of investment firms and the concepts defined for the purposes of this directive.

Recipients of this publication should consult the financial adviser before taking any investment decision on the basis of this publication.

In the preparation of this document OANDA TMS Brokers not take into account the individual needs and situation of the investor. Investments and services presented or included in this document may not be suitable for a specific investor, therefore, in case of doubts concerning such investments or investment services, it is recommended to consult an independent investment advisor.

Recipients of this report must make their own determination of the appropriateness of an investment in any financial instruments referred to herein based on the merits and risks involved, their own investment strategy and their legal and financial position.

None of the information presented in this publication constitutes investment, legal, accounting or tax advice or a statement that any investment strategy is adequate or appropriate due to individual circumstances related to the recipient, as well as does not constitute any other personal recommendation. OANDA TMS Brokers does not provide tax advisory services related to investing in financial instruments and recommends to contact an independent tax advisor.

OANDA TMS Brokers informs that in the case of a general recommendation service, there is a conflict of interest consisting in the issuance by OANDA TMS Brokers recommendation of a general nature, while OANDA TMS Brokers concluded transactions on the trading portfolio.

This publication is only informative and:

(i) does not constitute or form part of a sale, subscription or invitation to subscribe for any financial instruments,

(ii) it is not intended to offer or purchase or subscribe to or acquire any financial instruments

(iii) does not constitute advertising of any financial instruments

This publication has been prepared with due diligence, reliability and principles of objectivity based on generally available information. The information and opinions contained in this document have been collected or developed by OANDA TMS Brokers based on sources considered reliable, however OANDA TMS Brokers and related entities are not responsible for any inaccuracies or omissions. This document expresses the knowledge and views of its authors, as at the date of preparation.

The results achieved in the past should not be treated as an indication of whether the guarantee of future results. OANDA TMS Brokers is not responsible for investment decisions taken on the basis of this publication or for damages incurred as a result of investment decisions based on this publication.

The date on the first page of this publication is the date of its preparation and publication.

The Stocks service variant is offered in cross-selling together with the CFDs service variant. Detailed information on the risks arising from the various services being part of the cross-selling, as well as information on the costs and fees associated with these services, is available at OANDA TMS Brokers website in the Documents section.

CFDs are complex instruments and involve a high risk of a quick loss of cash due to leverage. 76% of retail investors' accounts record losses as a result of trading CFDs at this supplier. Consider if you understand how CFDs work and whether you can afford a high risk of losing money.

Detailed information about OANDA TMS Brokers, principles of preparing and disseminating recommendations, sources of information, determining recipients of recommendations, professional terminology, conflicts of interest, as well as frequency of issuing and validity of recommendations, are available at www.tmsbrokers.com in the section https://www.tmsbrokers.com/disclaimer

Scroll to top