Daily market news

forex Forex
18:00 - 01.06.2026
Author:

EUR/USD slips as renewed Middle East tensions boost the Greenback

EUR/USD comes under renewed selling pressure on Monday as initial optimism surrounding a potential US-Iran peace deal fades amid escalating tensions in the Middle East. At the time of writing, the pair trades around 1.1626, down nearly 0.30% on the day.

commodities Commodities
17:00 - 01.06.2026
Author:

Gold slips below $4,500 as US-Iran stalemate and strong Dollar cap XAU/USD

Gold (XAU/USD) kicks off the week with a negative bias as slow progress toward a US-Iran ceasefire extension deal and fresh attacks in the Middle East keep buyers cautious. At the time of writing, XAU/USD is trading around $4,455 after hitting a two-week high near $4,595 on Friday.

forex Forex
15:00 - 01.06.2026
Author:

Japanese Yen slips as Middle East tensions lift USD/JPY ahead data

USD/JPY trades around 159.50 on Monday at the time of writing, up 0.13% on the day, as the US Dollar (USD) benefits from renewed safe-haven demand amid a worsening market sentiment backdrop.

forex Forex
14:00 - 01.06.2026
Author:

GBP/USD Price Forecast: Pound hesitates around 1.3450 amid geopolitical woes 

The British Pound (GBP) remains practically flat against the US Dollar (USD) on Monday, trading both sides of the 1.3450 level, with investors wary of taking excessive risks.

commodities Commodities
13:00 - 01.06.2026
Author:

Gold Price Forecast: XAU/USD dives to $4,500 amid simmering tensions in Iran

Gold (XAU/USD) trades lower on Monday, reverting Friday’s gains and returning to the $4,500 atrea following rejection at the $4,590 resistance area.

10:00 - 01.06.2026
Author:

WTI Oil returns above $89.00 as tensions in the Middle East rise

Crude prices are trading higher on Monday, with the barrel of the US benchmark West Texas Intermediate (WTI) changing hands at $89.40 at the time of writing, nearly $3 higher than last week’s closing price.

commodities Commodities
09:00 - 01.06.2026
Author:

Silver Price Forecast: XAG/USD rises to near $75.70 on US-Iran deal hopes

Silver price (XAG/USD) is up 0.5% to near $75.75 during the European trading session on Monday. The white metal trades higher amid hopes that the United States (US) and Iran will reach a permanent peace deal soon.

08:00 - 01.06.2026
Author:

WTI US Oil Price Forecast: Rises to near $88.50 as Kuwait under attack, uptrend remains intact

West Texas Intermediate (WTI), the US crude oil benchmark, is trading around $88.45 during the early European trading hours on Monday. WTI price attracts some buyers following the Kuwaiti military reports of a missile and drone attack.

forex Forex
07:00 - 01.06.2026
Author:

EUR/JPY Price Forecast: Edges lower from upper descending channel top around 186.00

EUR/JPY steadies after six days of gains, trading around 185.70 during the Asian hours on Monday. The currency cross is maintaining a constructive bullish bias as it holds above both the nine-day and 50-day Exponential Moving Averages (EMAs).

forex Forex
06:00 - 01.06.2026
Author:

EUR/USD Price Forecast: Starts the US NFP week cautiously

The EUR/USD pair trades slightly lower to near 1.1645 during the Asian trading session on Monday.

OANDA's pick for the day

22:04 - 27.05.2026
Traders are desperate for more news, but the status quo is positive
22:16 - 25.05.2026
The Memorial Day session brought with it some great news
22:39 - 07.05.2026
Is the party over already? – North American Session Market Wrap for May 7
22:29 - 06.05.2026
The Peace rally can't be stopped – North American Session Market Wrap for May 6
commodities Commodities
09:00 - 01.06.2026
Commodities
09:00 - 01.06.2026

Silver Price Forecast: XAG/USD rises to near $75.70 on US-Iran deal hopes

  • Silver price rises to near $75.75 amid optimism on US-Iran permanent peace deal.
  • US President Trump said earlier in the day that Iran wants a deal badly.
  • Washington wants Iran to destroy its nuclear dust for a deal.

Silver price (XAG/USD) is up 0.5% to near $75.75 during the European trading session on Monday. The white metal trades higher amid hopes that the United States (US) and Iran will reach a permanent peace deal soon.

In the late Asian trade, US President Donald Trump said through a post on Truth Social that Iran wants a deal badly, while warning that the option of military action remains on the table.

Over the weekend, US President Trump said in an interview with Fox Business that the terms of the deal with Iran have been revised, adding that destroying Tehran’s nuclear dust and the reopening of the Strait of Hormuz remain key demands.

Meanwhile, the oil price has rebounded, following the exchange of attacks between Israel and Lebanon. The Silver and oil prices have carried a negative relationship since the onset of the war, as elevated energy prices have prompted inflationary pressures globally and forced traders to price out dovish Federal Reserve (Fed) bets.

Theoretically, the scenario of vanishing dovish Fed bets bodes poorly for non-yielding assets, such as Silver.

Going forward, investors will focus on the US Nonfarm Payrolls (NFP) data for May, which will be released on Friday.

Silver technical analysis

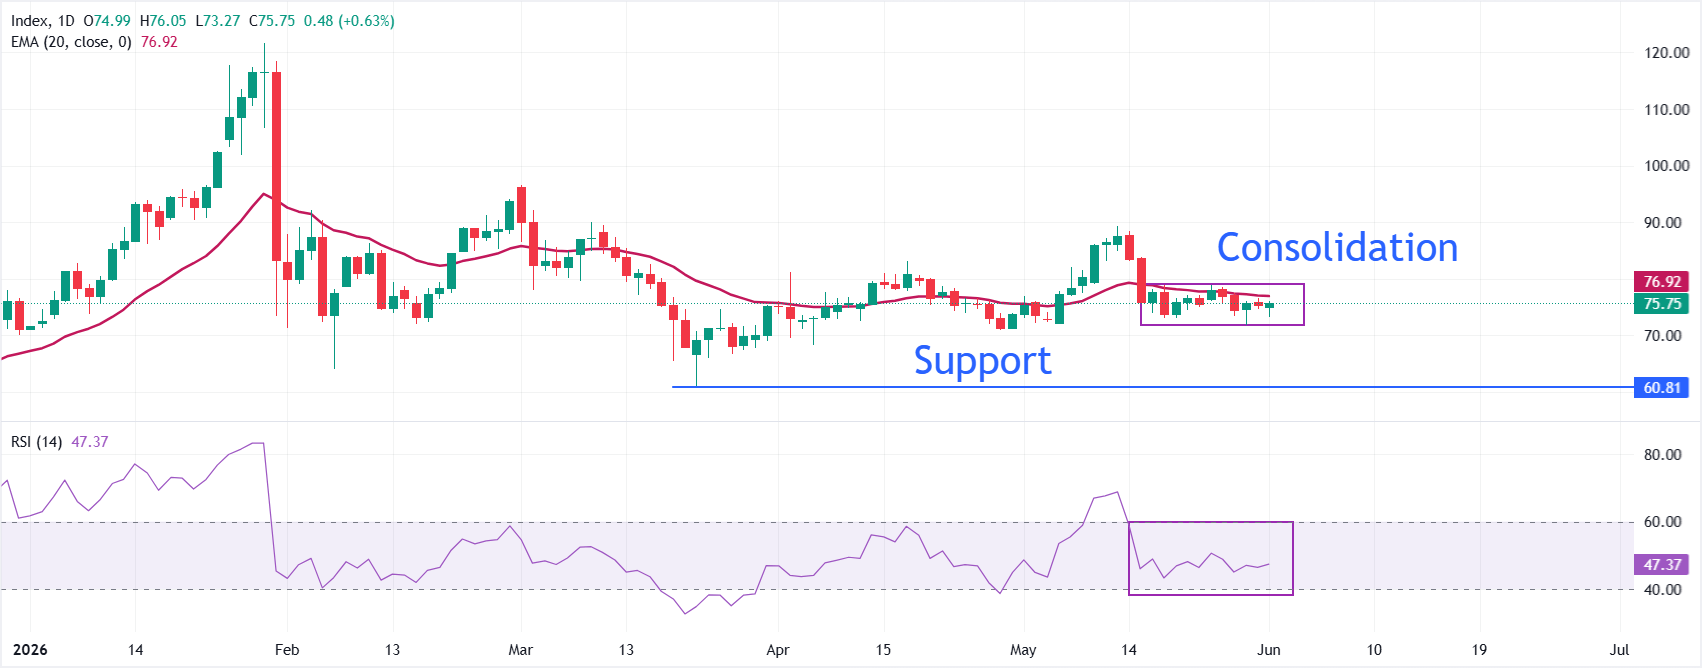
XAG/USD trades higher at around $75.75, but is broadly sideways from the last two weeks in the range between $71.79 and $78.83. The white metal maintains a bearish near-term tone as it holds beneath the 20-day exponential moving average (EMA) at $76.92. The downside bias is reinforced by the Relative Strength Index (RSI) hovering just below the neutral 50 mark near 47, which suggests subdued bullish momentum after the recent pullback from higher levels.

On the topside, the May 25 high at $78.83 is the first hurdle bulls need to clear to ease immediate downside pressure and open the way for a more sustained recovery towards the May 15 high at $83.88. On the downside, the asset could slide to the April 7 low at $68.28 if it drops below the May 28 low at $71.79. The major support level for the Silver price is the March 23 low at $61.01.

(The technical analysis of this story was written with the help of an AI tool.)

Silver FAQs

Why do people invest in Silver?

Silver is a precious metal highly traded among investors. It has been historically used as a store of value and a medium of exchange. Although less popular than Gold, traders may turn to Silver to diversify their investment portfolio, for its intrinsic value or as a potential hedge during high-inflation periods. Investors can buy physical Silver, in coins or in bars, or trade it through vehicles such as Exchange Traded Funds, which track its price on international markets.

Which factors influence Silver prices?

Silver prices can move due to a wide range of factors. Geopolitical instability or fears of a deep recession can make Silver price escalate due to its safe-haven status, although to a lesser extent than Gold's. As a yieldless asset, Silver tends to rise with lower interest rates. Its moves also depend on how the US Dollar (USD) behaves as the asset is priced in dollars (XAG/USD). A strong Dollar tends to keep the price of Silver at bay, whereas a weaker Dollar is likely to propel prices up. Other factors such as investment demand, mining supply – Silver is much more abundant than Gold – and recycling rates can also affect prices.

How does industrial demand affect Silver prices?

Silver is widely used in industry, particularly in sectors such as electronics or solar energy, as it has one of the highest electric conductivity of all metals – more than Copper and Gold. A surge in demand can increase prices, while a decline tends to lower them. Dynamics in the US, Chinese and Indian economies can also contribute to price swings: for the US and particularly China, their big industrial sectors use Silver in various processes; in India, consumers’ demand for the precious metal for jewellery also plays a key role in setting prices.

How do Silver prices react to Gold’s moves?

Silver prices tend to follow Gold's moves. When Gold prices rise, Silver typically follows suit, as their status as safe-haven assets is similar. The Gold/Silver ratio, which shows the number of ounces of Silver needed to equal the value of one ounce of Gold, may help to determine the relative valuation between both metals. Some investors may consider a high ratio as an indicator that Silver is undervalued, or Gold is overvalued. On the contrary, a low ratio might suggest that Gold is undervalued relative to Silver.

This publication has been prepared by OANDA TMS Brokers S.A. with its registered office in Warsaw, Warsaw UNIT, Daszyńskiego 1, 00-843 Warsaw, registered by the District Court for the Capital City of Warsaw in Warsaw, XIII Commercial Division of the National Court Register under KRS number 0000204776, NIP number 5262759131, with a share capital amounting to PLN 3,537.560, fully paid up, operating in accordance with the Act on Trading in Financial Instruments dated July 29th 2005, exclusively for the needs of OANDA TMS Brokers' clients. OANDA TMS Brokers is subject to the supervision of the Polish Financial Supervision Authority on the basis of an authorization of April 26th 2004 (KPWiG-4021-54-1/2004)

This publication is a commercial publication within the meaning of art. 36 par. 2 of Commission Delegated Regulation (EU) 2017/565 of 25 April 2016 supplementing Directive 2014/65 / EU of the European Parliament and of the Council with regard to the organizational requirements and operating conditions of investment firms and the concepts defined for the purposes of this directive.

Recipients of this publication should consult the financial adviser before taking any investment decision on the basis of this publication.

In the preparation of this document OANDA TMS Brokers not take into account the individual needs and situation of the investor. Investments and services presented or included in this document may not be suitable for a specific investor, therefore, in case of doubts concerning such investments or investment services, it is recommended to consult an independent investment advisor.

Recipients of this report must make their own determination of the appropriateness of an investment in any financial instruments referred to herein based on the merits and risks involved, their own investment strategy and their legal and financial position.

None of the information presented in this publication constitutes investment, legal, accounting or tax advice or a statement that any investment strategy is adequate or appropriate due to individual circumstances related to the recipient, as well as does not constitute any other personal recommendation. OANDA TMS Brokers does not provide tax advisory services related to investing in financial instruments and recommends to contact an independent tax advisor.

OANDA TMS Brokers informs that in the case of a general recommendation service, there is a conflict of interest consisting in the issuance by OANDA TMS Brokers recommendation of a general nature, while OANDA TMS Brokers concluded transactions on the trading portfolio.

This publication is only informative and:

(i) does not constitute or form part of a sale, subscription or invitation to subscribe for any financial instruments,

(ii) it is not intended to offer or purchase or subscribe to or acquire any financial instruments

(iii) does not constitute advertising of any financial instruments

This publication has been prepared with due diligence, reliability and principles of objectivity based on generally available information. The information and opinions contained in this document have been collected or developed by OANDA TMS Brokers based on sources considered reliable, however OANDA TMS Brokers and related entities are not responsible for any inaccuracies or omissions. This document expresses the knowledge and views of its authors, as at the date of preparation.

The results achieved in the past should not be treated as an indication of whether the guarantee of future results. OANDA TMS Brokers is not responsible for investment decisions taken on the basis of this publication or for damages incurred as a result of investment decisions based on this publication.

The date on the first page of this publication is the date of its preparation and publication.

The Stocks service variant is offered in cross-selling together with the CFDs service variant. Detailed information on the risks arising from the various services being part of the cross-selling, as well as information on the costs and fees associated with these services, is available at OANDA TMS Brokers website in the Documents section.

CFDs are complex instruments and involve a high risk of a quick loss of cash due to leverage. 76% of retail investors' accounts record losses as a result of trading CFDs at this supplier. Consider if you understand how CFDs work and whether you can afford a high risk of losing money.

Detailed information about OANDA TMS Brokers, principles of preparing and disseminating recommendations, sources of information, determining recipients of recommendations, professional terminology, conflicts of interest, as well as frequency of issuing and validity of recommendations, are available at www.tmsbrokers.com in the section https://www.tmsbrokers.com/disclaimer

Scroll to top