Daily market news

Forex
22:08 - 22.05.2026
Author:
Elior Manier

A final path to peace? Markets Weekly Outlook

A week ahead preview: Traders are hungry for a peace treaty, after a rollercoaster week. Get ready for the upcoming week by looking at the past week's Market performance, what changed and the key events to expect in next week)

Forex
19:48 - 22.05.2026
Author:
Krzysztof Kamiński

ECB between fighting inflation and weaker growth

Analysis of the ECB’s dilemma as persistent inflation in the eurozone’s largest economies raises the possibility of a June rate hike despite weaker growth prospects.

indices Indices
18:02 - 22.05.2026
Author:
Elior Manier

Stock Markets dance towards new records ahead of a long weekend – Dow Jones, Nasdaq and S&P 500 Intraday Levels

S&P 500, Dow Jones, Nasdaq Analysis and Trading Levels: US stock benchmarks surge toward uncharted territory as a massive wave of geopolitical optimism sweeps Wall Street. Fueled by reports of a Qatari negotiating team arriving in Tehran to help secure a US-Iran peace deal, crude oil prices are sliding lower, allowing the Dow Jones, Nasdaq, and S&P 500 to resume their relentless bullish expansion. Explore the intraday technical levels for the Dow, Nasdaq, and S&P 500.

Forex
15:37 - 22.05.2026
Author:
Elior Manier

USD/JPY trades close to 160.00 after Japan's CPI – More interventions required? – FX Analysis

USD/JPY Technical Analysis: The Japanese Yen faces fresh capitulation risks as Japan's April core CPI drops to a dovish 1.4%, well below the Bank of Japan's 2% target. Driven by domestic fuel subsidies masking Middle East oil shocks, the stark policy divergence with a hawkish Federal Reserve has pushed USD/JPY perilously close to the historic 160.00 handle. Explore our comprehensive technical breakdown and FX intervention outlook.

13:00 - 22.05.2026
Author:

WTI Oil steadies below $98.00 amid mild hopes of an US-Iran peace deal

Crude Oil prices are hovering near 10-day lows, with upside attempts limited below the $98.00 line on Friday, on track to a nearly 4% weekly decline.

commodities Commodities
12:09 - 22.05.2026
Author:

Gold Price Forecast: XAU/USD keeps looking for direction above $4,500

Gold (XAU/USD) trades lower for the second consecutive day on Friday, but remains contained within previous ranges, with downside attempts limited above the $4,500 line for now.

commodities Commodities
11:00 - 22.05.2026
Author:

Silver Price Forecast: XAG/USD struggles around $76 amid US-Iran deal uncertainty

Silver price (XAG/USD) faces selling pressure near $76.00 during the European trading session on Friday. The white metal trades lower due to uncertainty over whether the United States (US) and Iran will reach a deal.

indices Indices
10:00 - 22.05.2026
Author:

S&P 500: Modest gains with Iran-linked relief – Deutsche Bank

Deutsche Bank’s Jim Reid notes that improved sentiment around a potential Iran deal helped the S&P 500 recover earlier losses and close slightly higher.

forex Forex
09:00 - 22.05.2026
Author:

Forex Today: US Dollar holds ground despite US-Iran peace deal optimism

Here is what you need to know on Friday, May 22:

forex Forex
08:00 - 22.05.2026
Author:

AUD/USD Price Forecast: Holds losses below 0.7150 as descending wedge emerges

AUD/USD extends its losses after a slight decline in the previous day, trading around 0.7140 during the Asian hours on Friday.

OANDA's pick for the day

22:39 - 07.05.2026
Is the party over already? – North American Session Market Wrap for May 7
22:29 - 06.05.2026
The Peace rally can't be stopped – North American Session Market Wrap for May 6
22:11 - 04.05.2026
Sentiment waves are on a shore-break – North American Session Market Wrap for May 4
22:03 - 30.04.2026
It's an all-out rally after the Central Bank holds – North American Session Market Wrap for April 30
commodities Commodities
09:00 - 21.05.2026
Commodities
09:00 - 21.05.2026

Silver Price Forecast: XAG/USD faces pressure near $76.60 as US yields rebound

  • Silver price falls back from $76.60 as US Treasury yields bounce back.
  • US Treasury Yields corrected after President Donald Trump expressed confidence about a deal with Iran.
  • The Fed is unlikely to cut interest rates this year.

Silver price (XAG/USD) is down 0.7% to near $75.20 during the early European trading session on Thursday. The white metal drops after failing to extend the recovery above $76.60 earlier in the day.

The precious metal faces pressure as the United States (US) Treasury yields rebound after a steep correction on Wednesday. 10-year US Treasury yields are 0.3% higher to near 4.6%, but have corrected from their multi-year high of 4.69% posted on Tuesday.

US Treasury yields came under pressure, following comments from US President Donald Trump that Washington is in the “final stages” of finalizing a deal with Iran. Bond yields were rallying in the past two weeks as traders raised bets supporting the Federal Reserve’s (Fed) interest rate hikes this year due to elevated oil prices amid the Strait of Hormuz closure.

The CME FedWatch tool shows that the odds of the Fed delivering at least one interest rate hike this year are 51%, a sharp turnaround from two interest rate cuts anticipated before the onset of the Middle East war.

Theoretically, higher yields on interest-bearing assets diminish the appeal of non-yielding assets, such as Silver.

The outlook of US bond yields is expected to remain bullish unless the US inflation starts showing signs of cooling down.

Silver technical analysis

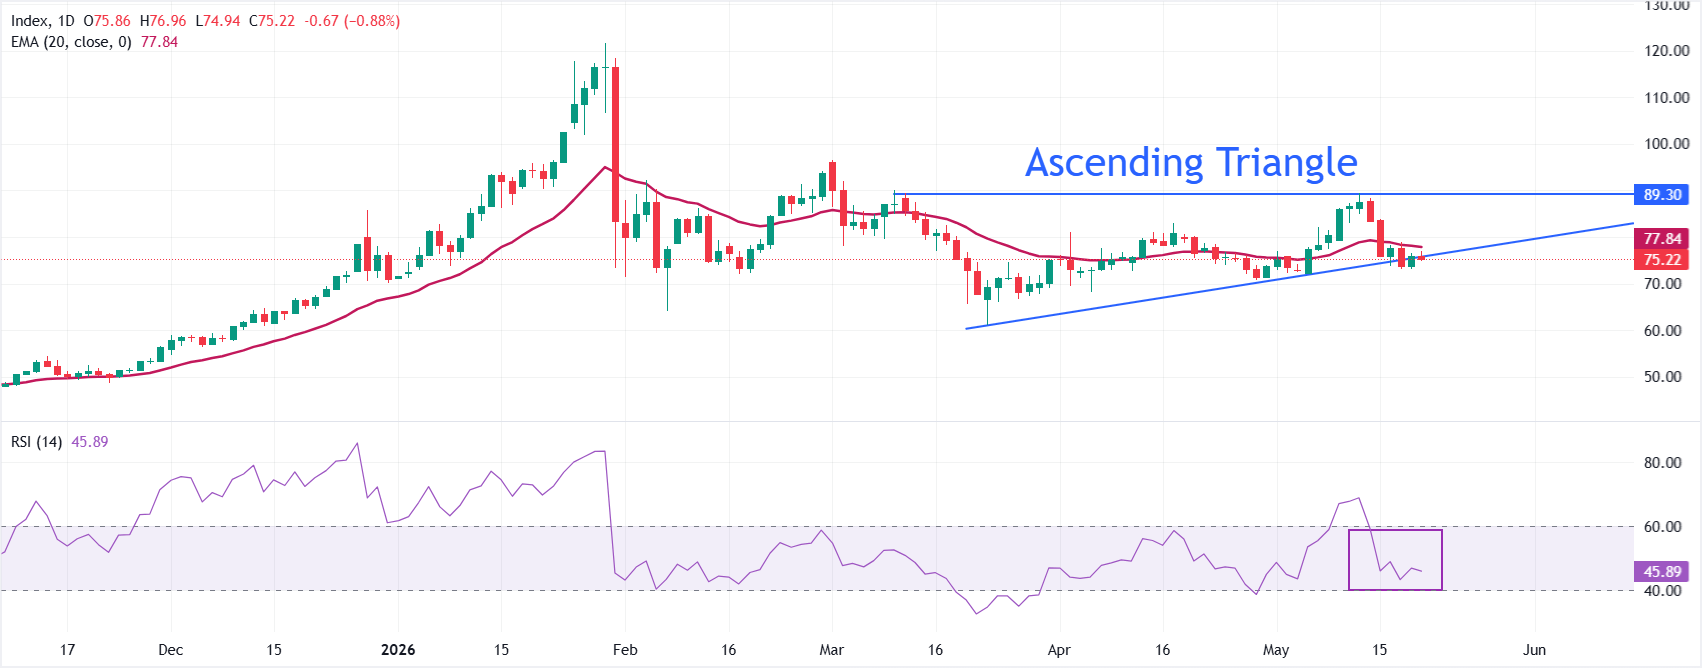
XAG/USD trades lower at around $75.22 at the press time. The white metal holds a bearish near-term bias as price sits below the 20-day Exponential Moving Average (EMA) at $77.84 and beneath the upward-sloping border of the Ascending Triangle formation, now acting as resistance around $78.31. The loss of that trend support hints at a corrective phase within the broader advance, while the Relative Strength Index (14) near 46 stays in neutral-to-soft territory, suggesting downside pressure persists but without oversold extremes.

On the topside, initial resistance is located at the 20-day EMA around $77.84, which caps immediate recovery attempts, followed by the May 15 high at $83.88. Looking down, the Silver price ould slide towards $70 if it fails to return above the Triangle's upward-sloping border. A downside move below $70.00 would expose the Silver price to the March 26 low at $66.71.

(The technical analysis of this story was written with the help of an AI tool.)

Silver FAQs

Why do people invest in Silver?

Silver is a precious metal highly traded among investors. It has been historically used as a store of value and a medium of exchange. Although less popular than Gold, traders may turn to Silver to diversify their investment portfolio, for its intrinsic value or as a potential hedge during high-inflation periods. Investors can buy physical Silver, in coins or in bars, or trade it through vehicles such as Exchange Traded Funds, which track its price on international markets.

Which factors influence Silver prices?

Silver prices can move due to a wide range of factors. Geopolitical instability or fears of a deep recession can make Silver price escalate due to its safe-haven status, although to a lesser extent than Gold's. As a yieldless asset, Silver tends to rise with lower interest rates. Its moves also depend on how the US Dollar (USD) behaves as the asset is priced in dollars (XAG/USD). A strong Dollar tends to keep the price of Silver at bay, whereas a weaker Dollar is likely to propel prices up. Other factors such as investment demand, mining supply – Silver is much more abundant than Gold – and recycling rates can also affect prices.

How does industrial demand affect Silver prices?

Silver is widely used in industry, particularly in sectors such as electronics or solar energy, as it has one of the highest electric conductivity of all metals – more than Copper and Gold. A surge in demand can increase prices, while a decline tends to lower them. Dynamics in the US, Chinese and Indian economies can also contribute to price swings: for the US and particularly China, their big industrial sectors use Silver in various processes; in India, consumers’ demand for the precious metal for jewellery also plays a key role in setting prices.

How do Silver prices react to Gold’s moves?

Silver prices tend to follow Gold's moves. When Gold prices rise, Silver typically follows suit, as their status as safe-haven assets is similar. The Gold/Silver ratio, which shows the number of ounces of Silver needed to equal the value of one ounce of Gold, may help to determine the relative valuation between both metals. Some investors may consider a high ratio as an indicator that Silver is undervalued, or Gold is overvalued. On the contrary, a low ratio might suggest that Gold is undervalued relative to Silver.

This publication has been prepared by OANDA TMS Brokers S.A. with its registered office in Warsaw, Warsaw UNIT, Daszyńskiego 1, 00-843 Warsaw, registered by the District Court for the Capital City of Warsaw in Warsaw, XIII Commercial Division of the National Court Register under KRS number 0000204776, NIP number 5262759131, with a share capital amounting to PLN 3,537.560, fully paid up, operating in accordance with the Act on Trading in Financial Instruments dated July 29th 2005, exclusively for the needs of OANDA TMS Brokers' clients. OANDA TMS Brokers is subject to the supervision of the Polish Financial Supervision Authority on the basis of an authorization of April 26th 2004 (KPWiG-4021-54-1/2004)

This publication is a commercial publication within the meaning of art. 36 par. 2 of Commission Delegated Regulation (EU) 2017/565 of 25 April 2016 supplementing Directive 2014/65 / EU of the European Parliament and of the Council with regard to the organizational requirements and operating conditions of investment firms and the concepts defined for the purposes of this directive.

Recipients of this publication should consult the financial adviser before taking any investment decision on the basis of this publication.

In the preparation of this document OANDA TMS Brokers not take into account the individual needs and situation of the investor. Investments and services presented or included in this document may not be suitable for a specific investor, therefore, in case of doubts concerning such investments or investment services, it is recommended to consult an independent investment advisor.

Recipients of this report must make their own determination of the appropriateness of an investment in any financial instruments referred to herein based on the merits and risks involved, their own investment strategy and their legal and financial position.

None of the information presented in this publication constitutes investment, legal, accounting or tax advice or a statement that any investment strategy is adequate or appropriate due to individual circumstances related to the recipient, as well as does not constitute any other personal recommendation. OANDA TMS Brokers does not provide tax advisory services related to investing in financial instruments and recommends to contact an independent tax advisor.

OANDA TMS Brokers informs that in the case of a general recommendation service, there is a conflict of interest consisting in the issuance by OANDA TMS Brokers recommendation of a general nature, while OANDA TMS Brokers concluded transactions on the trading portfolio.

This publication is only informative and:

(i) does not constitute or form part of a sale, subscription or invitation to subscribe for any financial instruments,

(ii) it is not intended to offer or purchase or subscribe to or acquire any financial instruments

(iii) does not constitute advertising of any financial instruments

This publication has been prepared with due diligence, reliability and principles of objectivity based on generally available information. The information and opinions contained in this document have been collected or developed by OANDA TMS Brokers based on sources considered reliable, however OANDA TMS Brokers and related entities are not responsible for any inaccuracies or omissions. This document expresses the knowledge and views of its authors, as at the date of preparation.

The results achieved in the past should not be treated as an indication of whether the guarantee of future results. OANDA TMS Brokers is not responsible for investment decisions taken on the basis of this publication or for damages incurred as a result of investment decisions based on this publication.

The date on the first page of this publication is the date of its preparation and publication.

The Stocks service variant is offered in cross-selling together with the CFDs service variant. Detailed information on the risks arising from the various services being part of the cross-selling, as well as information on the costs and fees associated with these services, is available at OANDA TMS Brokers website in the Documents section.

CFDs are complex instruments and involve a high risk of a quick loss of cash due to leverage. 76% of retail investors' accounts record losses as a result of trading CFDs at this supplier. Consider if you understand how CFDs work and whether you can afford a high risk of losing money.

Detailed information about OANDA TMS Brokers, principles of preparing and disseminating recommendations, sources of information, determining recipients of recommendations, professional terminology, conflicts of interest, as well as frequency of issuing and validity of recommendations, are available at www.tmsbrokers.com in the section https://www.tmsbrokers.com/disclaimer

Scroll to top