




Daily market news

08:00 - 12.05.2026
Author:

WTI rises to near $96.00 as supply concerns prevail

West Texas Intermediate (WTI) oil price extends its gains for the second successive day, trading around $95.80 during the Asian hours on Tuesday. Crude oil prices are surging as Middle East tensions are threatening the world’s most critical energy transit route.

indices Indices
07:04 - 12.05.2026
Author:
kelvin_wong
Kelvin Wong

Chart alert: Nikkei 225 bullish run is facing minor exhaustion below 64,145

The Nikkei 225 rallied to a fresh all-time high of 63,788 after a powerful technology-led surge driven by SoftBank Group and Murata Manufacturing. However, technical indicators now signal growing exhaustion risks beneath the 64,145 resistance level. A developing bearish Head & Shoulders formation, combined with RSI bearish divergence and Elliott Wave analysis, suggests the Japanese benchmark may enter a short-term corrective pullback despite its broader medium-term bullish trend remaining intact

forex Forex
07:00 - 12.05.2026
Author:

EUR/USD Price Forecast: Falls toward 1.1750 near nine-day EMA

EUR/USD extends its losses for the second successive day, trading around 1.1760 during the Asian hours on Tuesday. The daily chart technical analysis indicates an ongoing bullish bias as the pair is remaining within the ascending channel pattern.

commodities Commodities
06:00 - 12.05.2026
Author:

Silver Price Forecast: XAG/USD trades firmly near two-month high of $86.50 ahead of US CPI

Silver price (XAG/USD) holds onto its almost week-long rally to near $86.50 during the Asian trading session on Tuesday. The white metal trades firmly even as oil prices are broadly stable amid fears that military actions between the United States (US) and Iran could resume.

forex Forex
04:00 - 12.05.2026
Author:

AUD/USD Price Forecast: Eyes nine-day EMA support near 0.7200

AUD/USD loses ground after two days of gains, trading around 0.7240 during the Asian hours on Tuesday. The technical analysis of the daily chart indicates that the pair is moving upwards within the ascending channel, suggesting an ongoing bullish bias.

commodities Commodities
03:00 - 12.05.2026
Author:
kelvin_wong
Kelvin Wong

Asia open: Stocks hit new highs on AI optimism as US-Iran ceasefire hangs by a thread

Global stocks surged to new record highs as AI optimism continued to dominate market sentiment despite escalating concerns over the fragile US-Iran ceasefire. The Nasdaq 100, S&P 500, Nikkei 225, and KOSPI extended gains while semiconductor shares and AI infrastructure themes remained key drivers. Meanwhile, rising oil prices and stronger inflation expectations lifted Treasury yields and reinforced a hawkish Federal Reserve outlook ahead of the crucial US CPI report.

commodities Commodities
21:46 - 11.05.2026
Author:
Elior Manier

Silver (XAG/USD) is in breakout mode, pushing above $85 – In-depth Silver technical analysis

Silver (XAG/USD) update: The Grey metal officially enters a major breakout phase, surging 7% to clear the $85 handle. Decoupling from Gold's typical lead and fueled by signs of an industrial recovery in China, Silver is reclaiming its role as a high-demand industrial asset. Explore our in-depth technical analysis for XAG/USD.

indices Indices
18:31 - 11.05.2026
Author:
Elior Manier

Tech does not wait on CPI and Geopolitics – Dow Jones, Nasdaq and S&P 500 CPI Levels

S&P 500, Dow Jones, Nasdaq Analysis and Trading Levels: US stock benchmarks settle into a cautious range as markets brace for tomorrow's high-stakes CPI report. Despite a weekend diplomatic stalemate between the US and Iran and steadily rising oil prices, the "China Summit" optimism continues to bolster the Nasdaq and S&P 500. Explore our pre-CPI technical analysis of the major indexes.

18:00 - 11.05.2026
Author:

WTI Oil climbs on Trump rejection of Iran peace plan, Hormuz closure fears

West Texas Intermediate (WTI) Oil posts strong gains on Monday, with the US benchmark trading around $94.70 at the time of writing, up 3.18% on the day after opening the week with a significant bullish gap.

forex Forex
16:00 - 11.05.2026
Author:

GBP/USD Price Forecast: Buyers retain control above 200-day SMA

GBP/USD recovers some ground after opening the week with a bearish gap as geopolitical headlines surrounding the Middle East continue to stir volatility across financial markets.

OANDA's pick for the day

22:39 - 07.05.2026
Is the party over already? – North American Session Market Wrap for May 7
22:29 - 06.05.2026
The Peace rally can't be stopped – North American Session Market Wrap for May 6
22:11 - 04.05.2026
Sentiment waves are on a shore-break – North American Session Market Wrap for May 4
22:03 - 30.04.2026
It's an all-out rally after the Central Bank holds – North American Session Market Wrap for April 30
commodities Commodities
10:00 - 23.01.2024
Commodities
10:00 - 23.01.2024

Silver Price Analysis: XAG/USD moves away from over two-month low, not out of the woods yet

Silver stages a goodish recovery from over a two-month low touched on Monday. The setup favours bears and supports prospects for the emergence of fresh selling. A sustained strength beyond the $23.00 mark is needed to negate the negative bias.

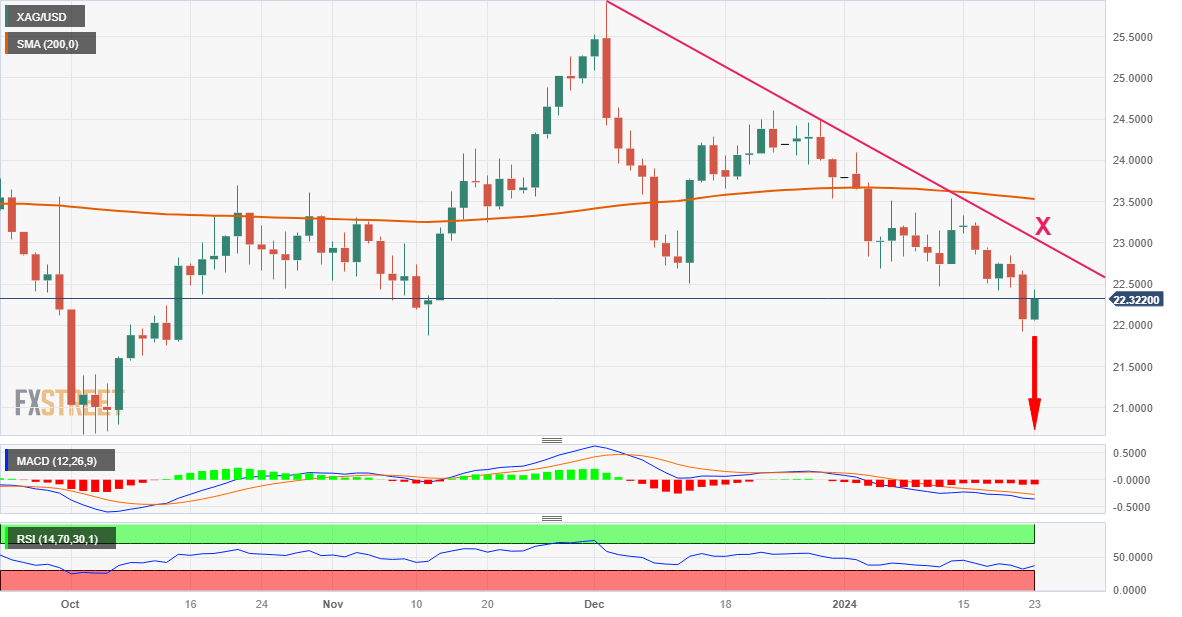
Silver (XAG/USD) attracts some buyers on Tuesday and for now, seems to have snapped a two-day losing streak to sub-$22.00 levels, or its lowest level since November 13 touched the previous day. The white metal sticks to its intraday gains through the first half of the European session and currently trades around the $22.30-$22.35 region, up over 1% for the day.

From a technical perspective, the recent repeated failures near the 200-day Simple Moving Average (SMA) resistance, which coincided with a downward sloping trend-line extending from the December swing high, favours bearish traders. Moreover, oscillators on the daily chart are holding deep in the negative territory and are still far from being in the oversold zone. This, in turn, suggests that the path of least resistance for the XAG/USD is to the downside.

Hence, any subsequent move up might still be seen as a selling opportunity and runs the risk of fizzling out rather quickly near the $22.70-$22.75 region. This is followed by the $23.00 round-figure mark, which should now act as a pivotal point. A sustained strength beyond the latter might trigger a short-covering rally and lift the XAG/USD beyond the $23.20-$23.25 intermediate hurdle, towards retesting the 200-day SMA barrier, currently pegged near mid-$23.00s.

Some follow-through buying will suggest that the white metal has formed a near-term bottom and shift the bias in favour of bullish traders. The subsequent move up might then allow the XAG/USD to reclaim the $24.00 round figure and climb further towards the next relevant resistance around the $24.40-$24.50 region.

On the flip side, bearish traders need to wait for acceptance below the $22.00 mark. The XAG/USD might then turn vulnerable to test the $21.40-$21.35 intermediate support before eventually dropping to the $21.00 round figure. The downward trajectory could extend further towards challenging the October monthly swing low, around the $20.70-$20.65 region.

Silver daily chart
fxsoriginal

Technical levels to watch


This publication has been prepared by OANDA TMS Brokers S.A. with its registered office in Warsaw, Warsaw UNIT, Daszyńskiego 1, 00-843 Warsaw, registered by the District Court for the Capital City of Warsaw in Warsaw, XIII Commercial Division of the National Court Register under KRS number 0000204776, NIP number 5262759131, with a share capital amounting to PLN 3,537.560, fully paid up, operating in accordance with the Act on Trading in Financial Instruments dated July 29th 2005, exclusively for the needs of OANDA TMS Brokers' clients. OANDA TMS Brokers is subject to the supervision of the Polish Financial Supervision Authority on the basis of an authorization of April 26th 2004 (KPWiG-4021-54-1/2004)

This publication is a commercial publication within the meaning of art. 36 par. 2 of Commission Delegated Regulation (EU) 2017/565 of 25 April 2016 supplementing Directive 2014/65 / EU of the European Parliament and of the Council with regard to the organizational requirements and operating conditions of investment firms and the concepts defined for the purposes of this directive.

Recipients of this publication should consult the financial adviser before taking any investment decision on the basis of this publication.

In the preparation of this document OANDA TMS Brokers not take into account the individual needs and situation of the investor. Investments and services presented or included in this document may not be suitable for a specific investor, therefore, in case of doubts concerning such investments or investment services, it is recommended to consult an independent investment advisor.

Recipients of this report must make their own determination of the appropriateness of an investment in any financial instruments referred to herein based on the merits and risks involved, their own investment strategy and their legal and financial position.

None of the information presented in this publication constitutes investment, legal, accounting or tax advice or a statement that any investment strategy is adequate or appropriate due to individual circumstances related to the recipient, as well as does not constitute any other personal recommendation. OANDA TMS Brokers does not provide tax advisory services related to investing in financial instruments and recommends to contact an independent tax advisor.

OANDA TMS Brokers informs that in the case of a general recommendation service, there is a conflict of interest consisting in the issuance by OANDA TMS Brokers recommendation of a general nature, while OANDA TMS Brokers concluded transactions on the trading portfolio.

This publication is only informative and:

(i) does not constitute or form part of a sale, subscription or invitation to subscribe for any financial instruments,

(ii) it is not intended to offer or purchase or subscribe to or acquire any financial instruments

(iii) does not constitute advertising of any financial instruments

This publication has been prepared with due diligence, reliability and principles of objectivity based on generally available information. The information and opinions contained in this document have been collected or developed by OANDA TMS Brokers based on sources considered reliable, however OANDA TMS Brokers and related entities are not responsible for any inaccuracies or omissions. This document expresses the knowledge and views of its authors, as at the date of preparation.

The results achieved in the past should not be treated as an indication of whether the guarantee of future results. OANDA TMS Brokers is not responsible for investment decisions taken on the basis of this publication or for damages incurred as a result of investment decisions based on this publication.

The date on the first page of this publication is the date of its preparation and publication.

The Stocks service variant is offered in cross-selling together with the CFDs service variant. Detailed information on the risks arising from the various services being part of the cross-selling, as well as information on the costs and fees associated with these services, is available at OANDA TMS Brokers website in the Documents section.

CFDs are complex instruments and involve a high risk of a quick loss of cash due to leverage. 76% of retail investors' accounts record losses as a result of trading CFDs at this supplier. Consider if you understand how CFDs work and whether you can afford a high risk of losing money.

Detailed information about OANDA TMS Brokers, principles of preparing and disseminating recommendations, sources of information, determining recipients of recommendations, professional terminology, conflicts of interest, as well as frequency of issuing and validity of recommendations, are available at www.tmsbrokers.com in the section https://www.tmsbrokers.com/disclaimer

Scroll to top