Daily market news

commodities Commodities
16:00 - 04.06.2026
Author:

Silver Price Forecast: XAG/USD recovery stalls below the 50-day SMA

Silver (XAG/USD) climbs more than 2% on Thursday as a ceasefire agreement between Israel and Lebanon weighs on the US Dollar (USD). At the time of writing, XAG/USD is trading around $74.80, but remains stuck within a familiar range between $72-$78 that has held since mid-May.

14:00 - 04.06.2026
Author:

WTI Price Forecast: Trades flat slightly above $93.00 amid US-Iran deadlock

West Texas Intermediate (WTI), futures on NYMEX, trades in a tight range around $93.20 during the European trading session on Thursday. The oil price consolidates as negotiations between the United States (US) and Iran towards a permanent peace deal are going nowhere.

forex Forex
13:00 - 04.06.2026
Author:

Eurozone Retail Sales contract more-than-expected: What weak Retail Sales mean for EUR/USD

The Eurozone Retail Sales data for April declines at a faster pace of 0.4% in April, compared to the 0.3% contraction expected. In March, the Retail Sales data, a key measure of consumer spending, rose by 0.8%, revised sharply higher from 0.1% decline.

indices Indices
12:07 - 04.06.2026
Author:
kelvin_wong
Kelvin Wong

Chart alert: Dow Jones (DJIA) under pressure, medium-term uptrend at risk

The Dow Jones Industrial Average is showing signs of technical deterioration after underperforming other major US equity indices throughout the current bull cycle. Rising geopolitical tensions in the Middle East, higher Treasury yields, and a bear-flattening yield curve are tightening financial conditions and weighing on cyclical sectors. Technical indicators, including a breakdown below ascending channel support and bearish RSI divergence, suggest near-term downside risks remain elevated.

forex Forex
11:00 - 04.06.2026
Author:

NZD/USD Price Forecast: Falls to near 0.5850 after slipping below moving averages

NZD/USD extends its losses for the fourth successive day, trading around 0.5860 during the European hours on Thursday. The technical analysis of the daily chart shows the spot price moving sideways within a rectangle pattern, indicating a period of market consolidation and indecision.

forex Forex
10:00 - 04.06.2026
Author:

BoJ to raise interest rates at June meeting – Reuters

According to sources, the Bank of Japan (BoJ) will raise interest rates in the June policy meeting, Reuters reports. The report also states that the central bank is leaning towards pausing or slowing the pace of its bond-buying taper from Fiscal 2027.

09:00 - 04.06.2026
Author:

WTI slumps to near $93.00 as Israel, Lebanon agree to renew ceasefire

West Texas Intermediate (WTI), the US crude oil benchmark, is trading around $93.10 during the early European trading hours on Thursday. The WTI price falls as a ceasefire agreement between Israel and Lebanon renewed hopes for diplomatic progress. 

commodities Commodities
08:16 - 04.06.2026
Author:
kelvin_wong
Kelvin Wong

Asia open: Middle East tensions drive oil higher as S&P 500 snaps winning streak

Global markets retreated as renewed U.S.-Iran tensions disrupted ceasefire hopes and pushed oil prices higher. The S&P 500 snapped a nine-day winning streak while technology shares came under pressure after Broadcom issued weaker-than-expected AI growth guidance. Meanwhile, rising energy costs, strong labour markets, and persistent inflation reinforced expectations of further monetary tightening from major central banks, weighing on investor sentiment worldwide.

forex Forex
08:00 - 04.06.2026
Author:

EUR/USD Price Forecast: Sees fresh leg of downfall below 1.1570

The EUR/USD pair trades marginally higher to near 1.1600 during the early European trading session on Thursday. The major currency pair edges up, but is close to its Wednesday’s low, suggesting that the outlook is still uncertain.

forex Forex
07:00 - 04.06.2026
Author:

EUR/JPY Price Forecast: Holds modest gains above 185.50, bullish bias remains intact

The EUR/JPY cross posts modest gains around 185.65 during the early European session on Thursday. The potential upside might be limited for the cross amid fears of foreign exchange intervention from Japanese authorities. 

OANDA's pick for the day

22:04 - 27.05.2026
Traders are desperate for more news, but the status quo is positive
22:16 - 25.05.2026
The Memorial Day session brought with it some great news
22:39 - 07.05.2026
Is the party over already? – North American Session Market Wrap for May 7
22:29 - 06.05.2026
The Peace rally can't be stopped – North American Session Market Wrap for May 6
commodities Commodities
14:00 - 29.05.2026
Commodities
14:00 - 29.05.2026

Gold Price Forecast: XAU/USD recovers further to near $4,530 amid falling Oil prices

  • Gold price jumps to near $4,530 on renewed US-Iran deal optimism.
  • US-Iran deal hopes have weighed heavily on the Oil price.
  • Gulf oil infrastructure damage and the need to rebuild energy inventory could keep oil prices higher.

Gold price (XAU/USD) is up 0.7% to near $4,530 during the European trading session on Friday. The precious metal extends its Thursday’s recovery move, as Oil prices decline due to renewed hopes of a permanent peace deal between the United States (US) and Iran.

As of writing, the WTI Oil price trades 1.6% lower, hitting a fresh five-week low near $86.30.

On Thursday, a report from Axios showed that the US and Iran had reached an agreement over a 60-day Memorandum of Understanding (MoU), which includes “unrestricted” energy flow through the Strait of Hormuz, a critical passage to almost 20% of global energy supply, and the removal of the US blockade on Iranian sea ports. However, the agreement still needs approval from US President Donald Trump.

Gold price has been underperforming in the past few months as higher Oil prices due to Middle East conflicts fueled US inflation, which forced traders to price out the possibility of interest rate cuts by the Federal Reserve (Fed) this year, with markets even beginning to price in potential rate hikes by December. Higher-for-longer interest rate expectations reduce the appeal of non-yielding assets like Gold.

However, falling Oil prices this week have reduced expectations for additional Fed tightening, with markets now pricing in a 44% chance of higher rates by December, down from nearly 62% a week earlier.

Meanwhile, market experts are of the view that damage to Gulf energy infrastructure and the need to rebuild oil inventory would keep Oil prices higher even as Middle East conflicts get resolved.

Analysts at Goldman Sachs expect Brent and WTI to hold stable around $80 and $75 per barrel, respectively, through 2027. They note that global inventory rebuilding and structural supply responses will offset downward pressure even if shipping chokepoints like the Strait of Hormuz reopen.

The projected Oil price will still be almost 30% higher than what was seen before the onset of the war.

Also, US President Trump’s refusal to approve the latest US-Iran framework could lead to fresh concerns over the Gold price.

Gold technical analysis

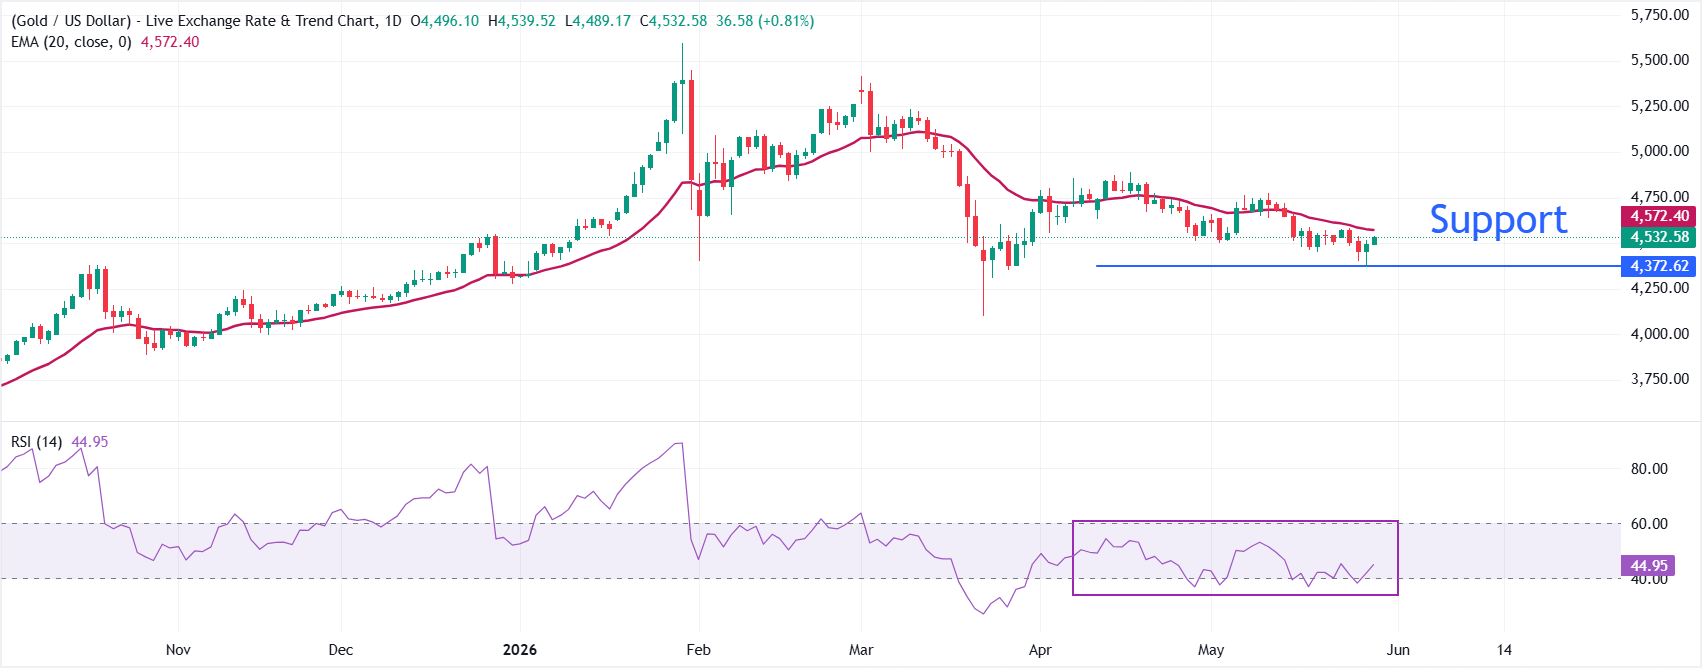
XAU/USD trades higher at around $4,530 as of writing. However, the near-term tone of the precious metal remains bearish as it holds beneath the 20-day Exponential Moving Average (EMA) at around $4,572.

The proximity of price to this EMA suggests the metal remains capped by short-term trend resistance, while the 14-day Relative Strength Index (RSI) near 45 hints at subdued, mildly bearish momentum rather than outright oversold conditions.

On the topside, the 20-day EMA at $4,572 is the first barrier bulls must reclaim to ease immediate downside pressure and open the way for a more sustained recovery towards the May 15 high at $4,665. Looking down, the yellow metal could slide to $4,300 if it falls back below the May 28 low at $4,366.

(The technical analysis of this story was written with the help of an AI tool.)

Gold FAQs

Why do people invest in Gold?

Gold has played a key role in human’s history as it has been widely used as a store of value and medium of exchange. Currently, apart from its shine and usage for jewelry, the precious metal is widely seen as a safe-haven asset, meaning that it is considered a good investment during turbulent times. Gold is also widely seen as a hedge against inflation and against depreciating currencies as it doesn’t rely on any specific issuer or government.

Who buys the most Gold?

Central banks are the biggest Gold holders. In their aim to support their currencies in turbulent times, central banks tend to diversify their reserves and buy Gold to improve the perceived strength of the economy and the currency. High Gold reserves can be a source of trust for a country’s solvency. Central banks added 1,136 tonnes of Gold worth around $70 billion to their reserves in 2022, according to data from the World Gold Council. This is the highest yearly purchase since records began. Central banks from emerging economies such as China, India and Turkey are quickly increasing their Gold reserves.

How is Gold correlated with other assets?

Gold has an inverse correlation with the US Dollar and US Treasuries, which are both major reserve and safe-haven assets. When the Dollar depreciates, Gold tends to rise, enabling investors and central banks to diversify their assets in turbulent times. Gold is also inversely correlated with risk assets. A rally in the stock market tends to weaken Gold price, while sell-offs in riskier markets tend to favor the precious metal.

What does the price of Gold depend on?

The price can move due to a wide range of factors. Geopolitical instability or fears of a deep recession can quickly make Gold price escalate due to its safe-haven status. As a yield-less asset, Gold tends to rise with lower interest rates, while higher cost of money usually weighs down on the yellow metal. Still, most moves depend on how the US Dollar (USD) behaves as the asset is priced in dollars (XAU/USD). A strong Dollar tends to keep the price of Gold controlled, whereas a weaker Dollar is likely to push Gold prices up.

This publication has been prepared by OANDA TMS Brokers S.A. with its registered office in Warsaw, Warsaw UNIT, Daszyńskiego 1, 00-843 Warsaw, registered by the District Court for the Capital City of Warsaw in Warsaw, XIII Commercial Division of the National Court Register under KRS number 0000204776, NIP number 5262759131, with a share capital amounting to PLN 3,537.560, fully paid up, operating in accordance with the Act on Trading in Financial Instruments dated July 29th 2005, exclusively for the needs of OANDA TMS Brokers' clients. OANDA TMS Brokers is subject to the supervision of the Polish Financial Supervision Authority on the basis of an authorization of April 26th 2004 (KPWiG-4021-54-1/2004)

This publication is a commercial publication within the meaning of art. 36 par. 2 of Commission Delegated Regulation (EU) 2017/565 of 25 April 2016 supplementing Directive 2014/65 / EU of the European Parliament and of the Council with regard to the organizational requirements and operating conditions of investment firms and the concepts defined for the purposes of this directive.

Recipients of this publication should consult the financial adviser before taking any investment decision on the basis of this publication.

In the preparation of this document OANDA TMS Brokers not take into account the individual needs and situation of the investor. Investments and services presented or included in this document may not be suitable for a specific investor, therefore, in case of doubts concerning such investments or investment services, it is recommended to consult an independent investment advisor.

Recipients of this report must make their own determination of the appropriateness of an investment in any financial instruments referred to herein based on the merits and risks involved, their own investment strategy and their legal and financial position.

None of the information presented in this publication constitutes investment, legal, accounting or tax advice or a statement that any investment strategy is adequate or appropriate due to individual circumstances related to the recipient, as well as does not constitute any other personal recommendation. OANDA TMS Brokers does not provide tax advisory services related to investing in financial instruments and recommends to contact an independent tax advisor.

OANDA TMS Brokers informs that in the case of a general recommendation service, there is a conflict of interest consisting in the issuance by OANDA TMS Brokers recommendation of a general nature, while OANDA TMS Brokers concluded transactions on the trading portfolio.

This publication is only informative and:

(i) does not constitute or form part of a sale, subscription or invitation to subscribe for any financial instruments,

(ii) it is not intended to offer or purchase or subscribe to or acquire any financial instruments

(iii) does not constitute advertising of any financial instruments

This publication has been prepared with due diligence, reliability and principles of objectivity based on generally available information. The information and opinions contained in this document have been collected or developed by OANDA TMS Brokers based on sources considered reliable, however OANDA TMS Brokers and related entities are not responsible for any inaccuracies or omissions. This document expresses the knowledge and views of its authors, as at the date of preparation.

The results achieved in the past should not be treated as an indication of whether the guarantee of future results. OANDA TMS Brokers is not responsible for investment decisions taken on the basis of this publication or for damages incurred as a result of investment decisions based on this publication.

The date on the first page of this publication is the date of its preparation and publication.

The Stocks service variant is offered in cross-selling together with the CFDs service variant. Detailed information on the risks arising from the various services being part of the cross-selling, as well as information on the costs and fees associated with these services, is available at OANDA TMS Brokers website in the Documents section.

CFDs are complex instruments and involve a high risk of a quick loss of cash due to leverage. 76% of retail investors' accounts record losses as a result of trading CFDs at this supplier. Consider if you understand how CFDs work and whether you can afford a high risk of losing money.

Detailed information about OANDA TMS Brokers, principles of preparing and disseminating recommendations, sources of information, determining recipients of recommendations, professional terminology, conflicts of interest, as well as frequency of issuing and validity of recommendations, are available at www.tmsbrokers.com in the section https://www.tmsbrokers.com/disclaimer

Scroll to top