




Daily market news

18:00 - 23.09.2026
Author:

WTI snaps five-day losing streak as US-Iran talks fall short of breakthrough

West Texas Intermediate (WTI) Oil rebounds on Wednesday after five straight days of losses as traders assess the latest Middle East developments and US inventory data.

commodities Commodities
12:00 - 23.09.2026
Author:

Gold Price Forecast: XAU/USD drifts toward $4.300 with bears gaining traction

Gold (XAU/USD) retraces Tuesday’s gains on Wednesday and drifts lower, approaching the $4,300 area as the US Dollar Index (DXY) rallies further amid high US Treasury yields.

10:00 - 23.09.2026
Author:

WTI Oil hovers at two-week lows near $89.00 awaiting Middle East developments

Oil prices maintain their negative trend on Wednesday, with the price of the US benchmark West Texas Intermediate (WTI) barrel flatlining at the $89.00 area, its lowest level in nearly three weeks and 13% below last week’s highs.

forex Forex
08:00 - 23.09.2026
Author:

AUD/USD Price Forecast: 20-day EMA remains key barrier amid firm US Dollar

The Australian Dollar (AUD) is down 0.15% at around 0.7100 against the US Dollar (USD) during the early European trading session on Wednesday.

forex Forex
18:00 - 22.09.2026
Author:

USD/JPY Price Forecast: Recovery stalls below key moving averages

USD/JPY trades flat on Tuesday as the Japanese Yen (JPY) holds firm in thin holiday trading during Japan’s Silver Week. However, a broadly stronger US Dollar (USD) keeps the Yen’s gains in check. At the time of writing, USD/JPY trades around 157.46.

forex Forex
14:00 - 22.09.2026
Author:

EUR/GBP Price Forecast: 100-day SMA blocks recovery as momentum remains subdued

EUR/GBP edges higher on Tuesday as the British Pound (GBP) remains under pressure across the board, weighed by concerns over the UK’s deteriorating fiscal outlook and the Bank of England’s (BoE) reluctance to raise interest rates while several major central banks have moved toward tighter policy.

forex Forex
12:18 - 22.09.2026
Author:
kelvin_wong
Kelvin Wong

Trump-Xi summit: five issues to watch and the trading playbook

The 24 September Trump–Xi meeting could set the next direction for global risk sentiment as markets await an extension of the US–China trade truce, targeted tariff cuts and agricultural purchases. This trading playbook highlights five assets most exposed to the outcome: USD/CNH, Hang Seng Tech, AUD/USD, the Nasdaq 100, and Singapore’s STI, and explains how traders can position for a deal, disappointment, or a sell-the-fact reversal.

commodities Commodities
12:00 - 22.09.2026
Author:

Gold Price Forecast: XAU/USD approaches $4,300 after rejection at the $4,400 area

Gold (XAU/USD) trades lower for the second consecutive day on Tuesday, extending its decline to levels below $4,320 during the European session, as the recovery attempt from last week’s low was capped at $4,400.

forex Forex
10:00 - 22.09.2026
Author:

NZD/USD Price Forecast: Upside attempts likely to be tested at 0.5800 

The New Zealand Dollar (NZD) shows a modest recovery against the US Dollar (USD) on Thursday, favoured by somewhat brighter market sentiment as Brent Oil prices remain below the $100 level, which provides some relief to Oil-importing economies like New Zealand’s.

forex Forex
08:00 - 22.09.2026
Author:

EUR/USD Price Forecast: Holds gains above 1.1450, but remains technically bearish below 100-day SMA

The EUR/USD pair trades in positive territory around 1.1475 during the early European session on Tuesday. The Euro (EUR) edges higher against the US Dollar (USD) amid improved risk sentiment as traders pinned their hopes on US-Iran talks.

OANDA's pick for the day

22:04 - 27.05.2026
Traders are desperate for more news, but the status quo is positive
22:16 - 25.05.2026
The Memorial Day session brought with it some great news
22:39 - 07.05.2026
Is the party over already? – North American Session Market Wrap for May 7
22:29 - 06.05.2026
The Peace rally can't be stopped – North American Session Market Wrap for May 6
commodities Commodities
12:00 - 23.09.2026
Commodities
12:00 - 23.09.2026

Gold Price Forecast: XAU/USD drifts toward $4.300 with bears gaining traction

  • XAU/USD nears $4.300 after rejection at $4,375 on Tuesday.
  • The US Dollar appreciates across the board amid Fed tightening hopes and high US Treasury yields.
  • The decline in Oil prices is providing some cushioning for Gold depreciation.

Gold (XAU/USD) retraces Tuesday’s gains on Wednesday and drifts lower, approaching the $4,300 area as the US Dollar Index (DXY) rallies further amid high US Treasury yields. Markets are still pondering the hawkish turn of the Federal Reserve (Fed) last week, while awaiting US business activity data to confirm monetary policy expectations, and keeping one eye on the UN summit in New York as US and Iran negotiate to reach a peace deal.

Investors' optimism about a positive outcome of the US-Iran talks has sent Oil prices tumbling this week, with the US benchmark WTI trading nearly 12% below last week’s highs, which is providing some support to precious metals. The DXY, however, keeps heading north and trades just below 101.00, its highest level in nearly two months, which is weighing heavily on Gold. 

The focus this week is on the United Nations General Assembly, where US and Iranian officials are working on the sidelines to advance towards a peace deal. The US Special Envoy, Steve Wickoff, has confirmed that negotiations are going on, and US President Donald Trump affirmed on Tuesday that the US had ”a very good meeting, a very productive meeting” with Iranian officials, and that there was “a lot of momentum” towards an agreement.

Technical Analysis: Rangebound trading with bears gaining momentum
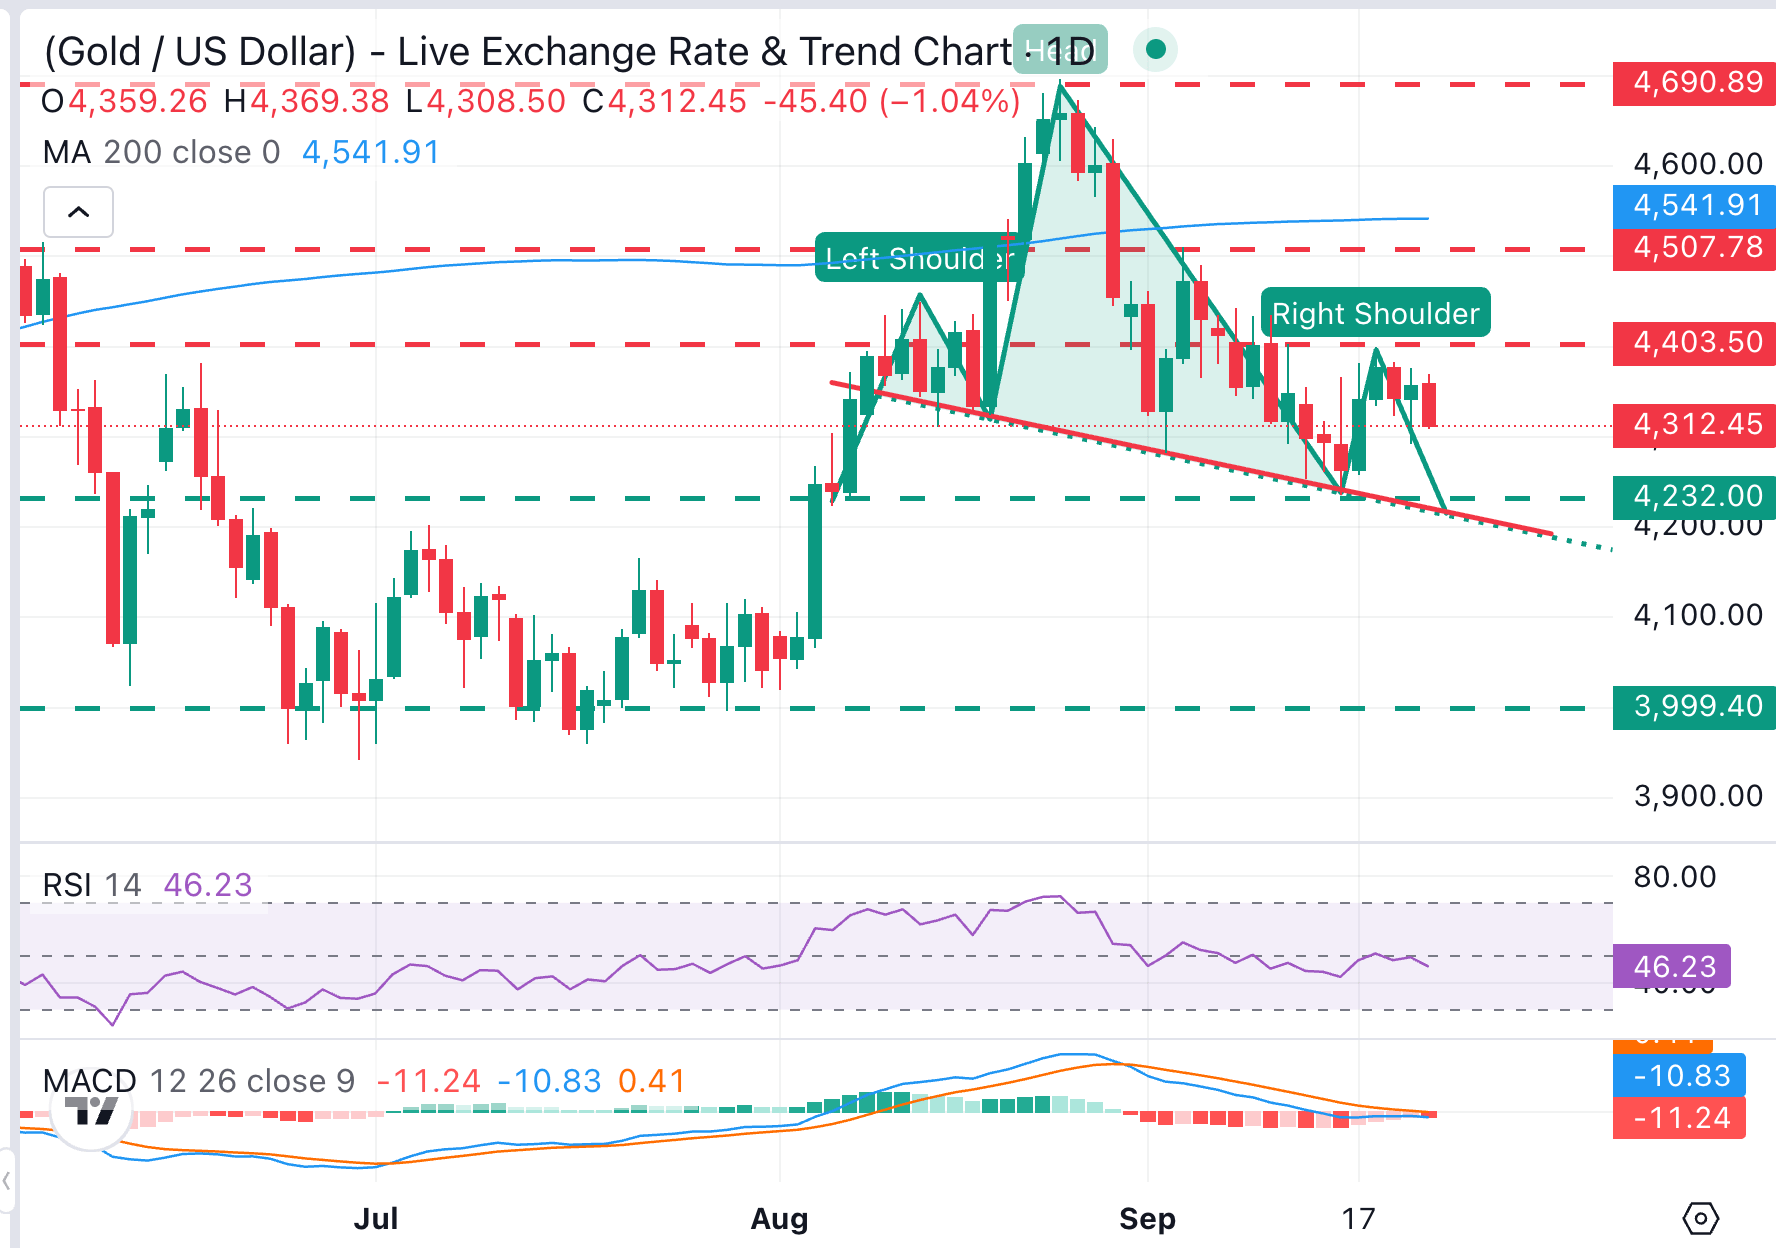
XAU/USD Chart Analysis


XAU/USD trades rangebound roughly between $4,300 and $4,400 with the immediate trend showing growing bearish momentum. Technical Indicators in the daily chart endorse that view, as the Relative Strength Index (RSI) remains capped below the key 50 level, with the Moving Average Convergence Divergence (MACD) in negative territory.

Bears are likely to be tested at Tuesday's low, near $4,290. A confirmation below here exposes the August 7 and September 16 lows, around $4,230, which is also the neckline of a bearish Head & Shoulders (H&S) formation.

On the topside, immediate resistance is at the mentioned $4,400 area, which has capped bulls several times in recent days, closing the path towards the September 3 high at $4,510 and the key 200-day Simple Moving Average (SMA) at $4,541.

(The technical analysis of this story was written with the help of an AI tool. Know more.)


Scroll to top