Daily market news

forex Forex
18:00 - 01.06.2026
Author:

EUR/USD slips as renewed Middle East tensions boost the Greenback

EUR/USD comes under renewed selling pressure on Monday as initial optimism surrounding a potential US-Iran peace deal fades amid escalating tensions in the Middle East. At the time of writing, the pair trades around 1.1626, down nearly 0.30% on the day.

commodities Commodities
17:00 - 01.06.2026
Author:

Gold slips below $4,500 as US-Iran stalemate and strong Dollar cap XAU/USD

Gold (XAU/USD) kicks off the week with a negative bias as slow progress toward a US-Iran ceasefire extension deal and fresh attacks in the Middle East keep buyers cautious. At the time of writing, XAU/USD is trading around $4,455 after hitting a two-week high near $4,595 on Friday.

forex Forex
15:00 - 01.06.2026
Author:

Japanese Yen slips as Middle East tensions lift USD/JPY ahead data

USD/JPY trades around 159.50 on Monday at the time of writing, up 0.13% on the day, as the US Dollar (USD) benefits from renewed safe-haven demand amid a worsening market sentiment backdrop.

forex Forex
14:00 - 01.06.2026
Author:

GBP/USD Price Forecast: Pound hesitates around 1.3450 amid geopolitical woes 

The British Pound (GBP) remains practically flat against the US Dollar (USD) on Monday, trading both sides of the 1.3450 level, with investors wary of taking excessive risks.

commodities Commodities
13:00 - 01.06.2026
Author:

Gold Price Forecast: XAU/USD dives to $4,500 amid simmering tensions in Iran

Gold (XAU/USD) trades lower on Monday, reverting Friday’s gains and returning to the $4,500 atrea following rejection at the $4,590 resistance area.

10:00 - 01.06.2026
Author:

WTI Oil returns above $89.00 as tensions in the Middle East rise

Crude prices are trading higher on Monday, with the barrel of the US benchmark West Texas Intermediate (WTI) changing hands at $89.40 at the time of writing, nearly $3 higher than last week’s closing price.

commodities Commodities
09:00 - 01.06.2026
Author:

Silver Price Forecast: XAG/USD rises to near $75.70 on US-Iran deal hopes

Silver price (XAG/USD) is up 0.5% to near $75.75 during the European trading session on Monday. The white metal trades higher amid hopes that the United States (US) and Iran will reach a permanent peace deal soon.

08:00 - 01.06.2026
Author:

WTI US Oil Price Forecast: Rises to near $88.50 as Kuwait under attack, uptrend remains intact

West Texas Intermediate (WTI), the US crude oil benchmark, is trading around $88.45 during the early European trading hours on Monday. WTI price attracts some buyers following the Kuwaiti military reports of a missile and drone attack.

forex Forex
07:00 - 01.06.2026
Author:

EUR/JPY Price Forecast: Edges lower from upper descending channel top around 186.00

EUR/JPY steadies after six days of gains, trading around 185.70 during the Asian hours on Monday. The currency cross is maintaining a constructive bullish bias as it holds above both the nine-day and 50-day Exponential Moving Averages (EMAs).

forex Forex
06:00 - 01.06.2026
Author:

EUR/USD Price Forecast: Starts the US NFP week cautiously

The EUR/USD pair trades slightly lower to near 1.1645 during the Asian trading session on Monday.

OANDA's pick for the day

22:04 - 27.05.2026
Traders are desperate for more news, but the status quo is positive
22:16 - 25.05.2026
The Memorial Day session brought with it some great news
22:39 - 07.05.2026
Is the party over already? – North American Session Market Wrap for May 7
22:29 - 06.05.2026
The Peace rally can't be stopped – North American Session Market Wrap for May 6
commodities Commodities
13:00 - 01.06.2026
Commodities
13:00 - 01.06.2026

Gold Price Forecast: XAU/USD dives to $4,500 amid simmering tensions in Iran

  • Gold retreats to $4,500 affter failing to breach resistance at the $4,590 area.
  • Growing concerns about the resumption of hostilities in Iran are buoying the safe-haven USD.
  • The ISM Manufacturing PMI is likely to provide additional support to the USD.

Gold (XAU/USD) trades lower on Monday, reverting Friday’s gains and returning to the $4,500 atrea following rejection at the $4,590 resistance area. Precious metals remain weighed, as tensions between Iran and the US escalate and Israel ramps up operations in Lebanon, and with a data-busy week ahead in the US.
speaker
The US and Iran exchanged attacks earlier on Monday, and Israel extended its occupation in Lebanon, adding strain to a frail ceasefire in the region. US President Donald Trump is still due to sign the memorandum of understanding that would extend the truce, while in Iran, the speaker of the parliament vowed retaliation to “clear evidence of US non-compliance with the ceasefire.”

On the data front, the US ISM Manufacturing Purchasing Manager’s Index (PMI) report, due later on Monday, is expected to show a healthy business activity, likely to support the Greenback. Investors, however, will wait for a string of labour data, with particular interest on Friday’s Nonfarm Payrolls for further insight into the Federal Reserve’s (Fed) monetary policy plans.

Technical Analysis: Gold remains vulnerable below $4,600

XAU/USD Chart Analysis

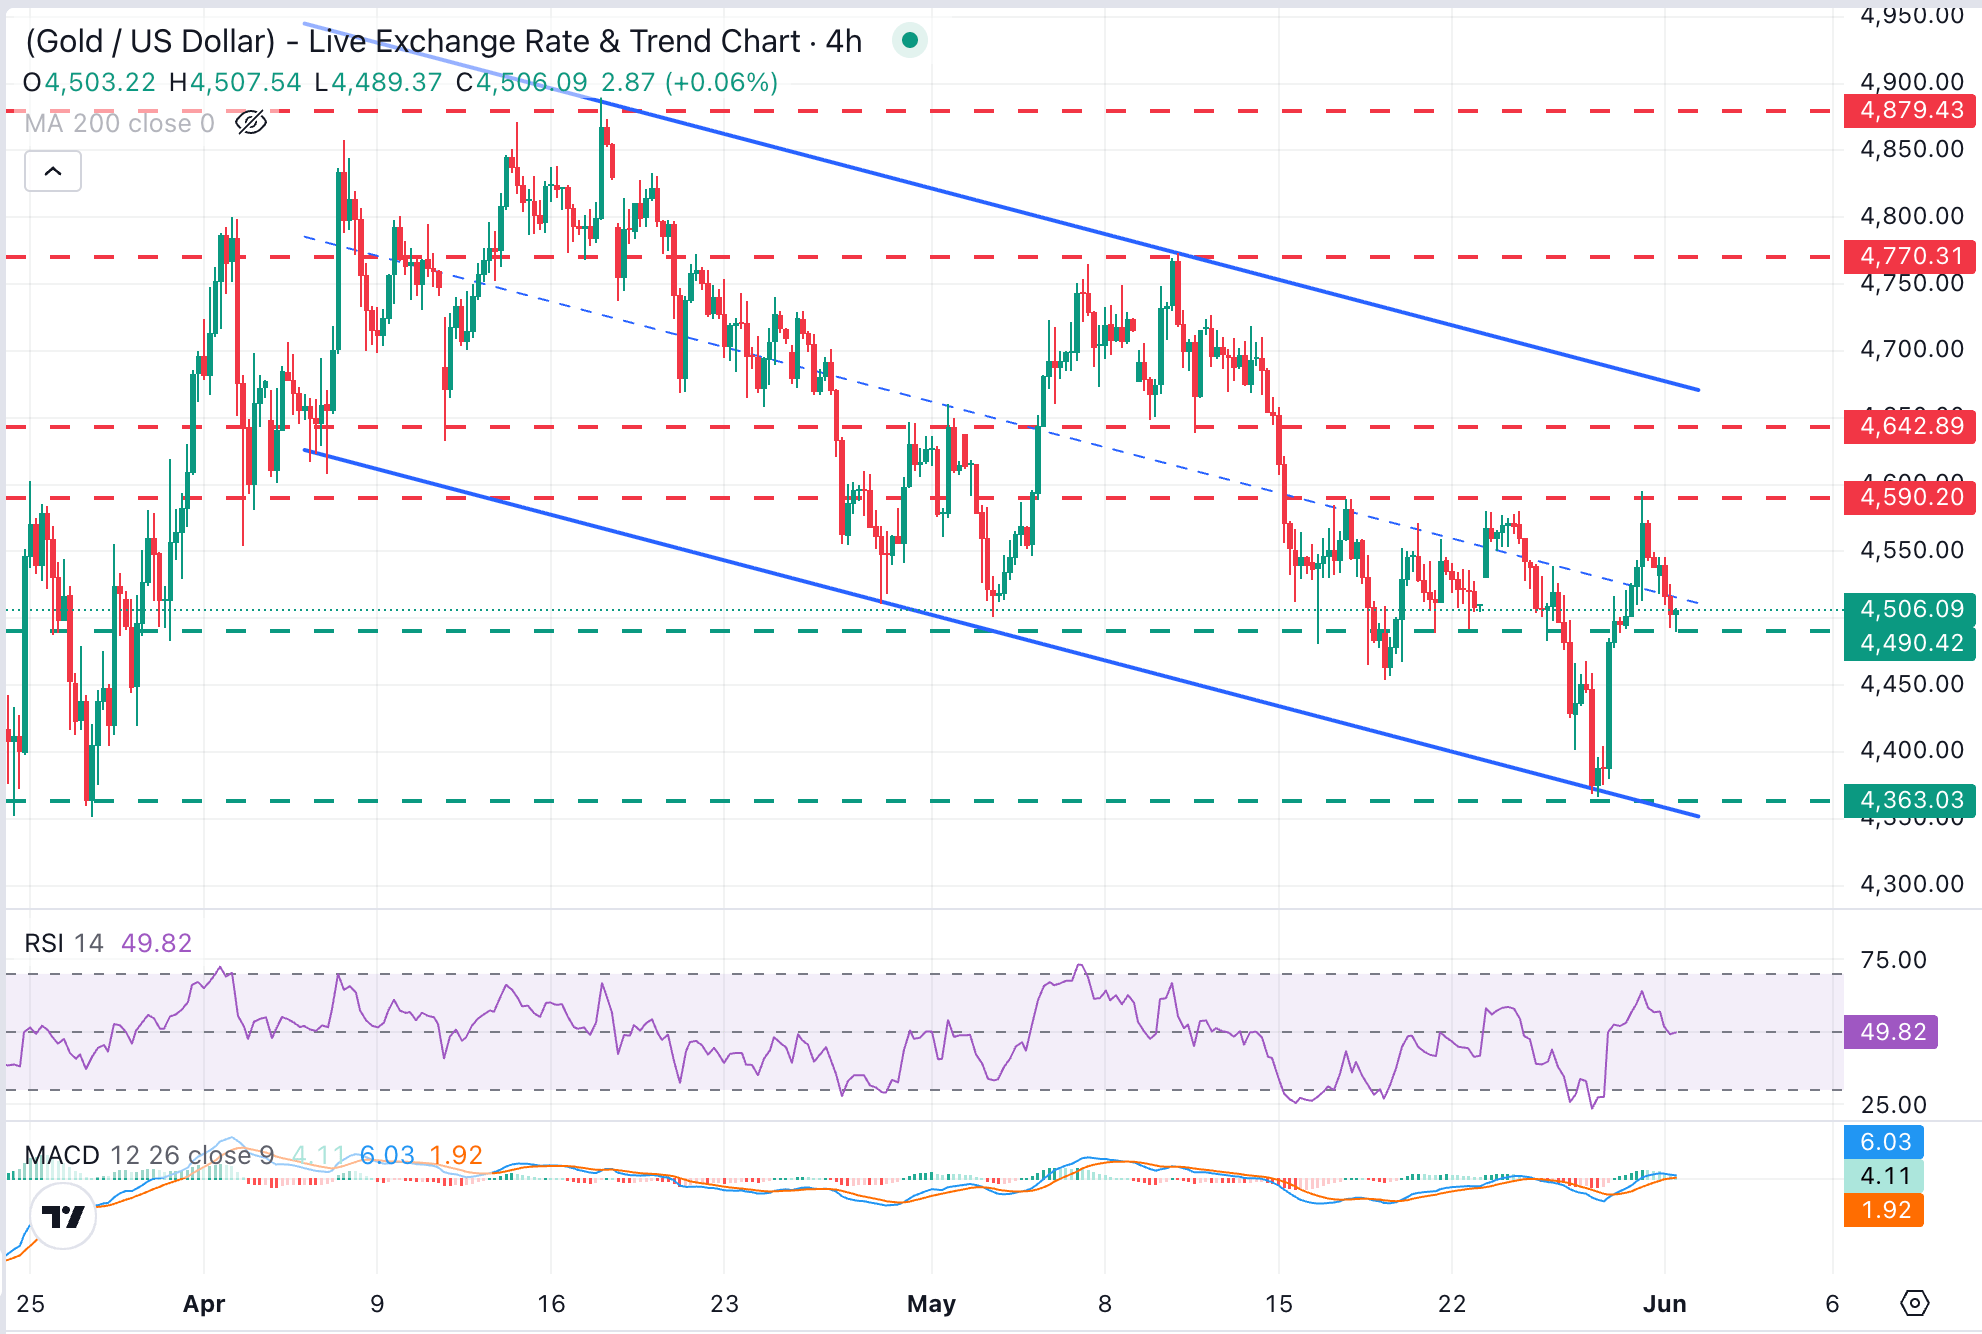
XAU/USD trades at $4,500, after yet another rejection at the $4,590 area on Friday. Momentum indicators in the 4-hour chart hint at fading bullish pressure, with the Relative Strength Index (RSI) hovering near 50 and the Moving Average Convergence Divergence (MACD) indicator flattening near the zero level

Bears are set to test Friday's low in the $4,490 area, which is likely to provide some support. Further down, the May 28 low, near $4,365, will come into focus. On the upside, bulls need to break the mentioned $4,590 resistance area (May 19, 25, 26, and 29 highs) to shift the focus towards mid-May lows at the $4,645 area and the top of the bearish channel, at $4,670.

(The technical analysis of this story was written with the help of an AI tool.)

Gold FAQs

Why do people invest in Gold?

Gold has played a key role in human’s history as it has been widely used as a store of value and medium of exchange. Currently, apart from its shine and usage for jewelry, the precious metal is widely seen as a safe-haven asset, meaning that it is considered a good investment during turbulent times. Gold is also widely seen as a hedge against inflation and against depreciating currencies as it doesn’t rely on any specific issuer or government.

Who buys the most Gold?

Central banks are the biggest Gold holders. In their aim to support their currencies in turbulent times, central banks tend to diversify their reserves and buy Gold to improve the perceived strength of the economy and the currency. High Gold reserves can be a source of trust for a country’s solvency. Central banks added 1,136 tonnes of Gold worth around $70 billion to their reserves in 2022, according to data from the World Gold Council. This is the highest yearly purchase since records began. Central banks from emerging economies such as China, India and Turkey are quickly increasing their Gold reserves.

How is Gold correlated with other assets?

Gold has an inverse correlation with the US Dollar and US Treasuries, which are both major reserve and safe-haven assets. When the Dollar depreciates, Gold tends to rise, enabling investors and central banks to diversify their assets in turbulent times. Gold is also inversely correlated with risk assets. A rally in the stock market tends to weaken Gold price, while sell-offs in riskier markets tend to favor the precious metal.

What does the price of Gold depend on?

The price can move due to a wide range of factors. Geopolitical instability or fears of a deep recession can quickly make Gold price escalate due to its safe-haven status. As a yield-less asset, Gold tends to rise with lower interest rates, while higher cost of money usually weighs down on the yellow metal. Still, most moves depend on how the US Dollar (USD) behaves as the asset is priced in dollars (XAU/USD). A strong Dollar tends to keep the price of Gold controlled, whereas a weaker Dollar is likely to push Gold prices up.

This publication has been prepared by OANDA TMS Brokers S.A. with its registered office in Warsaw, Warsaw UNIT, Daszyńskiego 1, 00-843 Warsaw, registered by the District Court for the Capital City of Warsaw in Warsaw, XIII Commercial Division of the National Court Register under KRS number 0000204776, NIP number 5262759131, with a share capital amounting to PLN 3,537.560, fully paid up, operating in accordance with the Act on Trading in Financial Instruments dated July 29th 2005, exclusively for the needs of OANDA TMS Brokers' clients. OANDA TMS Brokers is subject to the supervision of the Polish Financial Supervision Authority on the basis of an authorization of April 26th 2004 (KPWiG-4021-54-1/2004)

This publication is a commercial publication within the meaning of art. 36 par. 2 of Commission Delegated Regulation (EU) 2017/565 of 25 April 2016 supplementing Directive 2014/65 / EU of the European Parliament and of the Council with regard to the organizational requirements and operating conditions of investment firms and the concepts defined for the purposes of this directive.

Recipients of this publication should consult the financial adviser before taking any investment decision on the basis of this publication.

In the preparation of this document OANDA TMS Brokers not take into account the individual needs and situation of the investor. Investments and services presented or included in this document may not be suitable for a specific investor, therefore, in case of doubts concerning such investments or investment services, it is recommended to consult an independent investment advisor.

Recipients of this report must make their own determination of the appropriateness of an investment in any financial instruments referred to herein based on the merits and risks involved, their own investment strategy and their legal and financial position.

None of the information presented in this publication constitutes investment, legal, accounting or tax advice or a statement that any investment strategy is adequate or appropriate due to individual circumstances related to the recipient, as well as does not constitute any other personal recommendation. OANDA TMS Brokers does not provide tax advisory services related to investing in financial instruments and recommends to contact an independent tax advisor.

OANDA TMS Brokers informs that in the case of a general recommendation service, there is a conflict of interest consisting in the issuance by OANDA TMS Brokers recommendation of a general nature, while OANDA TMS Brokers concluded transactions on the trading portfolio.

This publication is only informative and:

(i) does not constitute or form part of a sale, subscription or invitation to subscribe for any financial instruments,

(ii) it is not intended to offer or purchase or subscribe to or acquire any financial instruments

(iii) does not constitute advertising of any financial instruments

This publication has been prepared with due diligence, reliability and principles of objectivity based on generally available information. The information and opinions contained in this document have been collected or developed by OANDA TMS Brokers based on sources considered reliable, however OANDA TMS Brokers and related entities are not responsible for any inaccuracies or omissions. This document expresses the knowledge and views of its authors, as at the date of preparation.

The results achieved in the past should not be treated as an indication of whether the guarantee of future results. OANDA TMS Brokers is not responsible for investment decisions taken on the basis of this publication or for damages incurred as a result of investment decisions based on this publication.

The date on the first page of this publication is the date of its preparation and publication.

The Stocks service variant is offered in cross-selling together with the CFDs service variant. Detailed information on the risks arising from the various services being part of the cross-selling, as well as information on the costs and fees associated with these services, is available at OANDA TMS Brokers website in the Documents section.

CFDs are complex instruments and involve a high risk of a quick loss of cash due to leverage. 76% of retail investors' accounts record losses as a result of trading CFDs at this supplier. Consider if you understand how CFDs work and whether you can afford a high risk of losing money.

Detailed information about OANDA TMS Brokers, principles of preparing and disseminating recommendations, sources of information, determining recipients of recommendations, professional terminology, conflicts of interest, as well as frequency of issuing and validity of recommendations, are available at www.tmsbrokers.com in the section https://www.tmsbrokers.com/disclaimer

Scroll to top