Daily market news

commodities Commodities
16:00 - 04.06.2026
Author:

Silver Price Forecast: XAG/USD recovery stalls below the 50-day SMA

Silver (XAG/USD) climbs more than 2% on Thursday as a ceasefire agreement between Israel and Lebanon weighs on the US Dollar (USD). At the time of writing, XAG/USD is trading around $74.80, but remains stuck within a familiar range between $72-$78 that has held since mid-May.

14:00 - 04.06.2026
Author:

WTI Price Forecast: Trades flat slightly above $93.00 amid US-Iran deadlock

West Texas Intermediate (WTI), futures on NYMEX, trades in a tight range around $93.20 during the European trading session on Thursday. The oil price consolidates as negotiations between the United States (US) and Iran towards a permanent peace deal are going nowhere.

forex Forex
13:00 - 04.06.2026
Author:

Eurozone Retail Sales contract more-than-expected: What weak Retail Sales mean for EUR/USD

The Eurozone Retail Sales data for April declines at a faster pace of 0.4% in April, compared to the 0.3% contraction expected. In March, the Retail Sales data, a key measure of consumer spending, rose by 0.8%, revised sharply higher from 0.1% decline.

indices Indices
12:07 - 04.06.2026
Author:
kelvin_wong
Kelvin Wong

Chart alert: Dow Jones (DJIA) under pressure, medium-term uptrend at risk

The Dow Jones Industrial Average is showing signs of technical deterioration after underperforming other major US equity indices throughout the current bull cycle. Rising geopolitical tensions in the Middle East, higher Treasury yields, and a bear-flattening yield curve are tightening financial conditions and weighing on cyclical sectors. Technical indicators, including a breakdown below ascending channel support and bearish RSI divergence, suggest near-term downside risks remain elevated.

forex Forex
11:00 - 04.06.2026
Author:

NZD/USD Price Forecast: Falls to near 0.5850 after slipping below moving averages

NZD/USD extends its losses for the fourth successive day, trading around 0.5860 during the European hours on Thursday. The technical analysis of the daily chart shows the spot price moving sideways within a rectangle pattern, indicating a period of market consolidation and indecision.

forex Forex
10:00 - 04.06.2026
Author:

BoJ to raise interest rates at June meeting – Reuters

According to sources, the Bank of Japan (BoJ) will raise interest rates in the June policy meeting, Reuters reports. The report also states that the central bank is leaning towards pausing or slowing the pace of its bond-buying taper from Fiscal 2027.

09:00 - 04.06.2026
Author:

WTI slumps to near $93.00 as Israel, Lebanon agree to renew ceasefire

West Texas Intermediate (WTI), the US crude oil benchmark, is trading around $93.10 during the early European trading hours on Thursday. The WTI price falls as a ceasefire agreement between Israel and Lebanon renewed hopes for diplomatic progress. 

commodities Commodities
08:16 - 04.06.2026
Author:
kelvin_wong
Kelvin Wong

Asia open: Middle East tensions drive oil higher as S&P 500 snaps winning streak

Global markets retreated as renewed U.S.-Iran tensions disrupted ceasefire hopes and pushed oil prices higher. The S&P 500 snapped a nine-day winning streak while technology shares came under pressure after Broadcom issued weaker-than-expected AI growth guidance. Meanwhile, rising energy costs, strong labour markets, and persistent inflation reinforced expectations of further monetary tightening from major central banks, weighing on investor sentiment worldwide.

forex Forex
08:00 - 04.06.2026
Author:

EUR/USD Price Forecast: Sees fresh leg of downfall below 1.1570

The EUR/USD pair trades marginally higher to near 1.1600 during the early European trading session on Thursday. The major currency pair edges up, but is close to its Wednesday’s low, suggesting that the outlook is still uncertain.

forex Forex
07:00 - 04.06.2026
Author:

EUR/JPY Price Forecast: Holds modest gains above 185.50, bullish bias remains intact

The EUR/JPY cross posts modest gains around 185.65 during the early European session on Thursday. The potential upside might be limited for the cross amid fears of foreign exchange intervention from Japanese authorities. 

OANDA's pick for the day

22:04 - 27.05.2026
Traders are desperate for more news, but the status quo is positive
22:16 - 25.05.2026
The Memorial Day session brought with it some great news
22:39 - 07.05.2026
Is the party over already? – North American Session Market Wrap for May 7
22:29 - 06.05.2026
The Peace rally can't be stopped – North American Session Market Wrap for May 6
forex Forex
08:00 - 29.05.2026
Forex
08:00 - 29.05.2026

GBP/USD Price Forecast: Broader trend remains sideways amid Triangle formation

  • GBP/USD trades marginally lower at around 1.3440 as the US Dollar edges higher.
  • Investors await US President Trump’s approval of the US-Iran 60-day MoU.
  • 10-year UK gilt yields extend their decline to near 4.81%.

The GBP/USD pair trades subduedly at around 1.3440 during the early European trading session on Friday. The Cable is marginally under pressure as the US Dollar (USD) trades higher, with investors awaiting United States (US) President Donald Trump’s approval to the 60-day Memorandum of Understanding (MoU) with Iran, as reported by Axios.

As of writing, the US Dollar Index (DXY), which tracks the Greenback’s value against six major currencies, trades slightly higher to near 99.06. However, the DXY corrected sharply from its over seven-week high of 99.10 on Thursday, following media reports that the US and Iran have reached an agreement.

The US-Iran 60-day MoU includes unrestricted energy flow through the Strait of Hormuz, removal of the US blockade on Iranian sea ports, and Tehran's surrendering its plans to build nuclear weapons.

Meanwhile, declining 10-year United Kingdom (UK) gilt yields due to easing expectations of a near-term Bank of England (BoE) interest rate hike are also weighing on the British Pound (GBP). At press time, 10-year UK gilt yields trade 1% lower at around 4.81%, the lowest level seen in almost six weeks.

GBP/USD technical analysis

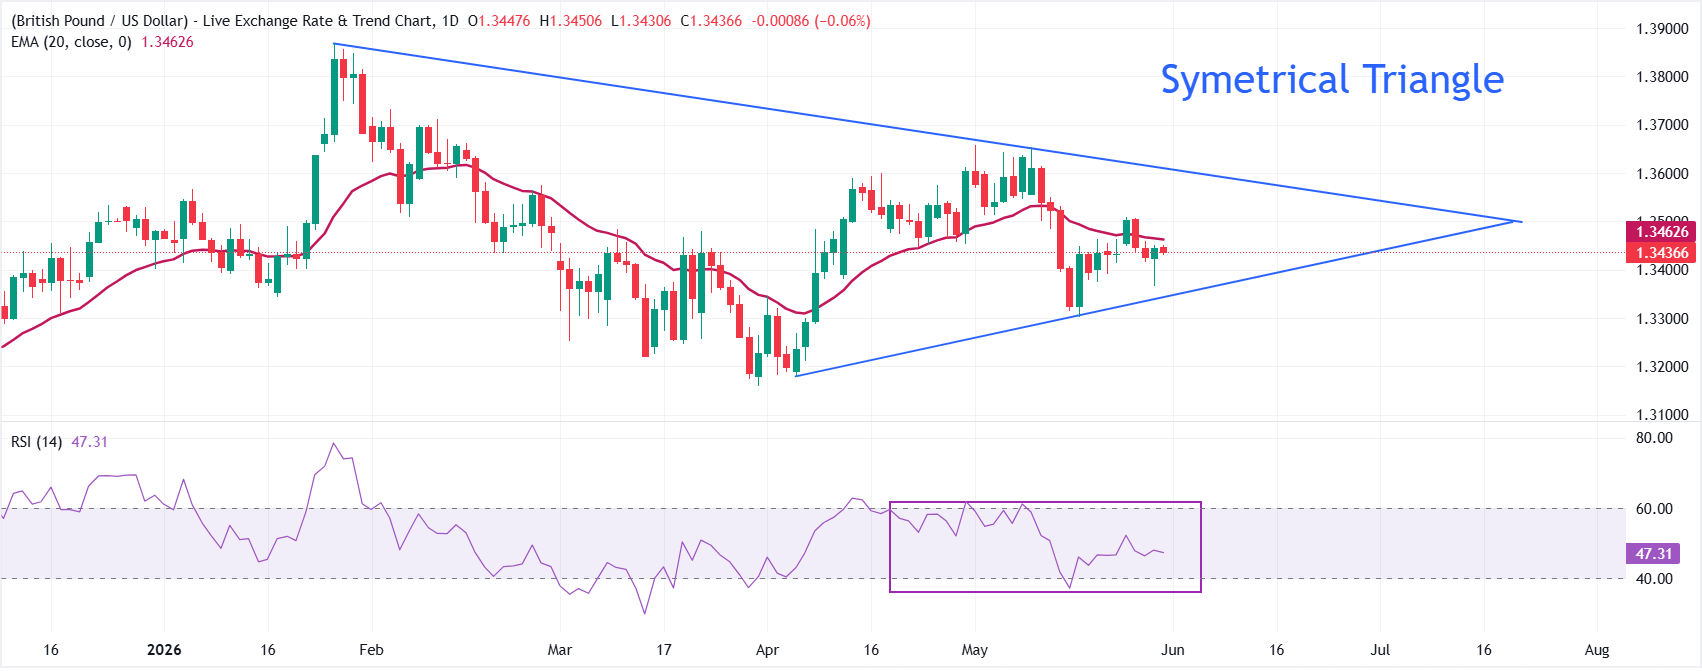
GBP/USD trades marginally lower at around 1.3440 as of writing. The pair holds below the 20-day Exponential Moving Average (EMA) at 1.3463 and thus retains a mildly bearish near-term bias. The pair sits between a reclaimed upward support trend line around 1.3340 and the descending resistance trend line that was last broken near 1.3611, suggesting broader consolidation within a still-capped structure.

The Relative Strength Index (14) wobbles inside the 40.00-60.00 zone, signaling a lack of directional conviction.

On the topside, initial resistance is located at the 20-day EMA near 1.3463, and a sustained break above this level would open the way toward the May 25 high at 1.3505. While the descending resistance trend line will be the next key hurdle emerging around 1.3611. On the downside, immediate support is defined by the rising trend line drawn from the 1.3180 area, currently coming in close to 1.3340, and a clear drop below this floor would expose a deeper pullback towards 1.3300.

(The technical analysis of this story was written with the help of an AI tool.)

Pound Sterling FAQs

What is the Pound Sterling?

The Pound Sterling (GBP) is the oldest currency in the world (886 AD) and the official currency of the United Kingdom. It is the fourth most traded unit for foreign exchange (FX) in the world, accounting for 12% of all transactions, averaging $630 billion a day, according to 2022 data. Its key trading pairs are GBP/USD, also known as ‘Cable’, which accounts for 11% of FX, GBP/JPY, or the ‘Dragon’ as it is known by traders (3%), and EUR/GBP (2%). The Pound Sterling is issued by the Bank of England (BoE).

How do the decisions of the Bank of England impact on the Pound Sterling?

The single most important factor influencing the value of the Pound Sterling is monetary policy decided by the Bank of England. The BoE bases its decisions on whether it has achieved its primary goal of “price stability” – a steady inflation rate of around 2%. Its primary tool for achieving this is the adjustment of interest rates. When inflation is too high, the BoE will try to rein it in by raising interest rates, making it more expensive for people and businesses to access credit. This is generally positive for GBP, as higher interest rates make the UK a more attractive place for global investors to park their money. When inflation falls too low it is a sign economic growth is slowing. In this scenario, the BoE will consider lowering interest rates to cheapen credit so businesses will borrow more to invest in growth-generating projects.

How does economic data influence the value of the Pound?

Data releases gauge the health of the economy and can impact the value of the Pound Sterling. Indicators such as GDP, Manufacturing and Services PMIs, and employment can all influence the direction of the GBP. A strong economy is good for Sterling. Not only does it attract more foreign investment but it may encourage the BoE to put up interest rates, which will directly strengthen GBP. Otherwise, if economic data is weak, the Pound Sterling is likely to fall.

How does the Trade Balance impact the Pound?

Another significant data release for the Pound Sterling is the Trade Balance. This indicator measures the difference between what a country earns from its exports and what it spends on imports over a given period. If a country produces highly sought-after exports, its currency will benefit purely from the extra demand created from foreign buyers seeking to purchase these goods. Therefore, a positive net Trade Balance strengthens a currency and vice versa for a negative balance.

This publication has been prepared by OANDA TMS Brokers S.A. with its registered office in Warsaw, Warsaw UNIT, Daszyńskiego 1, 00-843 Warsaw, registered by the District Court for the Capital City of Warsaw in Warsaw, XIII Commercial Division of the National Court Register under KRS number 0000204776, NIP number 5262759131, with a share capital amounting to PLN 3,537.560, fully paid up, operating in accordance with the Act on Trading in Financial Instruments dated July 29th 2005, exclusively for the needs of OANDA TMS Brokers' clients. OANDA TMS Brokers is subject to the supervision of the Polish Financial Supervision Authority on the basis of an authorization of April 26th 2004 (KPWiG-4021-54-1/2004)

This publication is a commercial publication within the meaning of art. 36 par. 2 of Commission Delegated Regulation (EU) 2017/565 of 25 April 2016 supplementing Directive 2014/65 / EU of the European Parliament and of the Council with regard to the organizational requirements and operating conditions of investment firms and the concepts defined for the purposes of this directive.

Recipients of this publication should consult the financial adviser before taking any investment decision on the basis of this publication.

In the preparation of this document OANDA TMS Brokers not take into account the individual needs and situation of the investor. Investments and services presented or included in this document may not be suitable for a specific investor, therefore, in case of doubts concerning such investments or investment services, it is recommended to consult an independent investment advisor.

Recipients of this report must make their own determination of the appropriateness of an investment in any financial instruments referred to herein based on the merits and risks involved, their own investment strategy and their legal and financial position.

None of the information presented in this publication constitutes investment, legal, accounting or tax advice or a statement that any investment strategy is adequate or appropriate due to individual circumstances related to the recipient, as well as does not constitute any other personal recommendation. OANDA TMS Brokers does not provide tax advisory services related to investing in financial instruments and recommends to contact an independent tax advisor.

OANDA TMS Brokers informs that in the case of a general recommendation service, there is a conflict of interest consisting in the issuance by OANDA TMS Brokers recommendation of a general nature, while OANDA TMS Brokers concluded transactions on the trading portfolio.

This publication is only informative and:

(i) does not constitute or form part of a sale, subscription or invitation to subscribe for any financial instruments,

(ii) it is not intended to offer or purchase or subscribe to or acquire any financial instruments

(iii) does not constitute advertising of any financial instruments

This publication has been prepared with due diligence, reliability and principles of objectivity based on generally available information. The information and opinions contained in this document have been collected or developed by OANDA TMS Brokers based on sources considered reliable, however OANDA TMS Brokers and related entities are not responsible for any inaccuracies or omissions. This document expresses the knowledge and views of its authors, as at the date of preparation.

The results achieved in the past should not be treated as an indication of whether the guarantee of future results. OANDA TMS Brokers is not responsible for investment decisions taken on the basis of this publication or for damages incurred as a result of investment decisions based on this publication.

The date on the first page of this publication is the date of its preparation and publication.

The Stocks service variant is offered in cross-selling together with the CFDs service variant. Detailed information on the risks arising from the various services being part of the cross-selling, as well as information on the costs and fees associated with these services, is available at OANDA TMS Brokers website in the Documents section.

CFDs are complex instruments and involve a high risk of a quick loss of cash due to leverage. 76% of retail investors' accounts record losses as a result of trading CFDs at this supplier. Consider if you understand how CFDs work and whether you can afford a high risk of losing money.

Detailed information about OANDA TMS Brokers, principles of preparing and disseminating recommendations, sources of information, determining recipients of recommendations, professional terminology, conflicts of interest, as well as frequency of issuing and validity of recommendations, are available at www.tmsbrokers.com in the section https://www.tmsbrokers.com/disclaimer

Scroll to top