




Daily market news

forex Forex
22:00 - 24.07.2026
Author:

NZD/USD Price Forecast: Tests 0.5800 as bullish momentum fades

The New Zealand Dollar gains over 0.30% against the US Dollar, poised to test key resistance levels, with the 50-day Simple Moving Average (SMA) at 0.5793, slightly below the 0.5800 figure. At the time of writing, the NZD/USD trades at 0.5789, after bouncing off daily lows of 0.5767.

commodities Commodities
20:00 - 24.07.2026
Author:

Silver Price Forecast: XAG/USD consolidates as bulls struggle to clear the 21-day SMA

Silver (XAG/USD) edges higher on Friday as a pullback in Oil prices pushes US Treasury yields lower, while the US Dollar (USD) fluctuates near recent highs. At the time of writing, XAG/USD trades around $58.60, up 2.40% on the day.

16:00 - 24.07.2026
Author:

WTI Price Forecast: Bulls retest 100-day SMA as momentum stays bullish

West Texas Intermediate (WTI) eases on Friday as traders lock in profits following a 6% jump the previous day. However, the widening Middle East war limits the downside as supply risks intensify around two major energy-shipping routes, the Strait of Hormuz and Bab el-Mandeb.

commodities Commodities
15:00 - 24.07.2026
Author:

Silver Price Forecast: XAG/USD recovers as the US Dollar eases

Silver (XAG/USD) trades around $58.55 at the time of writing on Friday, up 2.24% on the day, benefiting from a modest pullback in the US Dollar (USD) following its recent rally.

forex Forex
10:00 - 24.07.2026
Author:

Forex Today: New wave of US tariffs, deepening Middle East conflict keep markets on edge

Here is what you need to know on Friday, July 24:

forex Forex
09:00 - 24.07.2026
Author:

AUD/USD Price Forecast: Surging US bond yields warrant downside

The Australian Dollar (AUD) trades marginally higher at around 0.6976 against the US Dollar (USD) during the European trading session on Friday.

08:00 - 24.07.2026
Author:

WTI Price Forecast: Falls to near $90.00, while bullish structure stays intact

West Texas Intermediate (WTI), the US crude oil benchmark, is trading around $90.05 during the early European trading hours on Friday. WTI tumbles as traders book some profits.

forex Forex
07:00 - 24.07.2026
Author:

EUR/JPY Price Forecast: Eyes rising wedge top near 187.00

EUR/JPY extends its gains for the fourth consecutive day, trading around 186.50 during the Asian hours on Friday. The currency cross is maintaining a bullish near-term bias as price holds above both the nine-period and 50-period Exponential Moving Averages (EMAs).

04:00 - 24.07.2026
Author:

10% weekly surge: WTI holds above $90.00 amid Middle East escalation

West Texas Intermediate (WTI) oil price halts its three-day winning streak, trading around $90.20 per barrel during the Asian hours on Friday. However, WTI crude price is on track to surge over 10% this week.

forex Forex
22:00 - 23.07.2026
Author:

AUD/USD Price Forecast: Bulls struggle below the 50-day SMA

AUD/USD edges lower on Thursday as a stronger US Dollar (USD) outweighs support from stronger-than-expected Australian employment data. At the time of writing, the pair trades around 0.6966, down 0.45% on the day.

OANDA's pick for the day

22:04 - 27.05.2026
Traders are desperate for more news, but the status quo is positive
22:16 - 25.05.2026
The Memorial Day session brought with it some great news
22:39 - 07.05.2026
Is the party over already? – North American Session Market Wrap for May 7
22:29 - 06.05.2026
The Peace rally can't be stopped – North American Session Market Wrap for May 6
forex Forex
18:00 - 22.01.2024
Forex
18:00 - 22.01.2024

EUR/GBP edges lower ahead of ECB decision

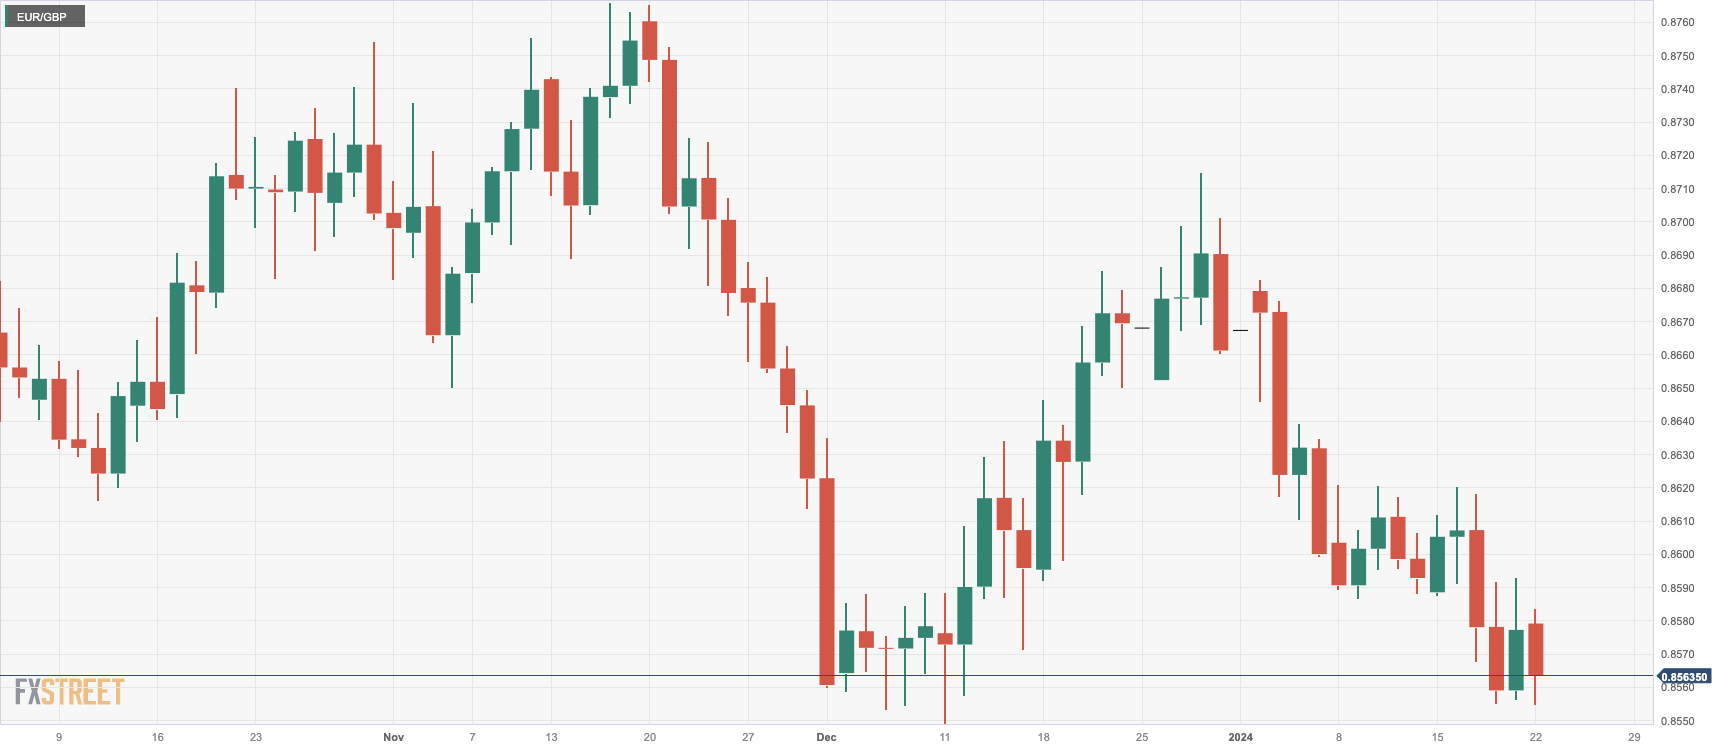
The EUR/GBP records 0.20% losses standing at 0.8562. The ECB meets on Thursday, no policy change expected. Daily chart indicators present bearish sentiment: RSI indicates a negative slope in unfavorable territory with MACD's rising red bars hinting at a selling momentum.

On Monday's session, the EUR/GBP pair was seen trading at the 0.8562 level, depicting a 0.20% loss. The daily chart indicates a neutral to bearish outlook with bulls struggling to find solid ground. On the four-hour chart, indicators suggest a flattened momentum within negative territory, pointing to a domination of sellers over buyers. Overall, the Pound seems to have a slight command over the Euro mainly due to the British economy holding stronger than the majority of the EU countries and markets betting on a more dovish European Central Bank (ECB).

In that sense, markets are pricing in the European Central Bank to begin its rate cuts in Q2, with nearly 150 bp of total easing seen this year due to the latest round of weak economic data. On Thursday the ECB meets,  were markets await the bank to hold its policy rate unchanged for the fourth consecutive time and investors will look for clues forward guidance, which may affect the crosses’s dynamics. As for the Bank of England (BoE), despite the relative robustness of the UK economy, market sentiments project the first rate cut in Q2, with approximately 125 bp of total rate cuts anticipated throughout the year.

EUR/GBP levels to watch

On the daily chart, the Relative Strength Index (RSI) is in a downward trajectory within the negative region, indicating an ongoing selling pressure. The positioning of the pair under the three key Simple Moving Averages (SMAs) - the 20, 100 and 200-day SMAs - corroborates this bearishness. This unfavorable climate is further solidified by the increasing red bars observed on the Moving Average Convergence Divergence (MACD) histogram.

Zooming into the four-hour chart, the indicators have stagnated within the negative arena, portraying a pause in the bearish momentum. The four-hour RSI is hovering flat in the negative space, yet the MACD histogram displays rising red bars. This suggests a lukewarm selling momentum, implying buyers yet have to exhibit concrete attempts to shift the scales.


EUR/GBP daily chart
Scroll to top