Daily market news

commodities Commodities
16:00 - 15.05.2026
Author:

Silver Price Forecast: XAG/USD drops 8% as hawkish Fed expectations pressure metals

Silver (XAG/USD) plunges on Friday, erasing all gains recorded earlier this week as hawkish Federal Reserve (Fed) expectations push US Treasury yields and the US Dollar (USD) higher.

forex Forex
15:00 - 15.05.2026
Author:

EUR/USD Price forecast: Hits lows at 1.1620 on risk aversion, high Oil prices 

The Euro (EUR) extends its decline against the Dollar (USD) on Friday, falling below 1.1650 for the first time since early April, on track for a 1.2% weekly depreciation.

forex Forex
14:00 - 15.05.2026
Author:

NZD/USD Price Forecast: Dips below 0.5850 amid high Oil prices, risk-off markets

The New Zealand Dollar (NZD) accelerates its reversal against a stronger US Dollar (USD) on Friday.

12:00 - 15.05.2026
Author:

WTI Price Forecast: Breaks above $100 as Trump says China will buy US Oil

Crude Oil prices maintain their bullish trend on Friday, with the US Benchmark West Texas Intermediate (WTI) barrel pushing to fresh weekly highs above $100.00, after US President Donald Trump affirmed that China agreed to buy US Crude, but no specific plan to reopen the critical Strait of Hormuz ha

forex Forex
11:00 - 15.05.2026
Author:

Forex Today: US Dollar extends rally on hawkish Fed repricing

Here is what you need to know on Friday, May 15:

forex Forex
10:00 - 15.05.2026
Author:

USD/CHF Price Forecast: Advances to two-week high to test 0.7865 confluence on bullish USD

The USD/CHF pair prolongs its weekly uptrend for the fifth consecutive day on Friday and touches over a two-week high, near the 0.7860-0.7865 region during the early European session amid a broadly firmer US Dollar (USD).

forex Forex
09:00 - 15.05.2026
Author:

AUD/USD Price Forecast: Near-term bias turns bearish as correction extends below 20-day EMA

The AUD/USD pair trades 0.8% lower to near 0.7160 against the US Dollar (USD) during the European trading session on Friday. The Aussie pair faces intense selling pressure as the US Dollar outperforms its peers amid a significant surge in US Treasury yields.

forex Forex
08:00 - 15.05.2026
Author:

USD/JPY Price Forecast: Extends winning streak and stabilizes above 20-day EMA

The USD/JPY pair extends its winning streak for the fifth trading day on Friday, trading 0.11% higher to near 158.60 during the early European trading session.

forex Forex
07:00 - 15.05.2026
Author:

BOJ expected to raise rates to 1.0% in June, hike again in Q4 — Reuters poll

A Reuters poll showed on Friday that median forecasts see the Bank of Japan (BoJ) to hike the interest rates to 1.25% in the fourth quarter (Q4) and 1.50% in Q3 of 2027, unchanged from the April poll.

forex Forex
06:00 - 15.05.2026
Author:

EUR/USD Price Forecast: Near-term bias turns negative on breakdown below 1.1655

The EUR/USD pair extends its losing streak for the fourth trading day on Friday, trading 0.15% lower to near 1.1653 during the Asian trading session.

OANDA's pick for the day

22:39 - 07.05.2026
Is the party over already? – North American Session Market Wrap for May 7
22:29 - 06.05.2026
The Peace rally can't be stopped – North American Session Market Wrap for May 6
22:11 - 04.05.2026
Sentiment waves are on a shore-break – North American Session Market Wrap for May 4
22:03 - 30.04.2026
It's an all-out rally after the Central Bank holds – North American Session Market Wrap for April 30
forex Forex
12:00 - 15.01.2026
Forex
12:00 - 15.01.2026

EUR/USD trims losses amid strong Eurozone Industrial Production

EUR/USD picks up from session lows but remains close to one-month lows at 1.1618.Eurozone data released on Thursday showed that Industrial Production grew beyond expectations in November.The US Dollar remains firm as Strong US PPI and Retail Sales data add to the case of a Fed pause.

EUR/USD is trimming some losses on Thursday, trading at 1.1636 at the time of writing, after bouncing from session lows near 1.1625. Stronger-than-expected Eurozone Industrial Production figures have provided some support to the Euro, which, nevertheless, remains dangerously close to one-month lows, at 1.1618

Data released by Eurostat on Thursday revealed that the Eurozone's Industrial Production advanced at a steady 0.7% pace in November, against market expectations of a moderate slowdown to 0.5%. Year-on-year, production growth accelerated to 2.5%, from 2% in October and beyond the 2% increase anticipated by the market's consensus.

Looking in perspective, however, the Euro maintains its bearish trend from late- December highs intact as a slate of fairly strong US macroeconomic figures and easing concerns about the US Federal Reserve’s (Fed) autonomy keep underpinning demand for the US Dollar.

US data released on Wednesday showed a larger-than-expected acceleration in producer prices and a strong rebound in retail consumption in November, providing further reasons for the Fed to keep interest rates unchanged in the coming months.

Beyond that, US President Donald Trump calmed markets, stating that he has no plan to oust Fed Chairman Jerome Powell despite the criminal investigation against him. Investors’ concerns about the Fed’s independence sent the US Dollar tumbling earlier in the week and prompted most of the world's central bankers to sign a statement defending Powell.

Investors are now looking to the NY Empire State and the Philadelphia Fed manufacturing reports to confirm the improvement of the US economic outlook in the fourth quarter of 2025. These figures will frame the speeches from Fed policymakers later on the day.

Euro Price Today

The table below shows the percentage change of Euro (EUR) against listed major currencies today. Euro was the strongest against the Canadian Dollar.

USD EUR GBP JPY CAD AUD NZD CHF USD 0.04% 0.02% -0.11% 0.16% -0.20% -0.07% 0.02% EUR -0.04% -0.03% -0.13% 0.12% -0.24% -0.11% -0.02% GBP -0.02% 0.03% -0.11% 0.15% -0.21% -0.09% 0.00% JPY 0.11% 0.13% 0.11% 0.25% -0.10% -0.01% 0.12% CAD -0.16% -0.12% -0.15% -0.25% -0.35% -0.24% -0.13% AUD 0.20% 0.24% 0.21% 0.10% 0.35% 0.13% 0.22% NZD 0.07% 0.11% 0.09% 0.00% 0.24% -0.13% 0.09% CHF -0.02% 0.02% -0.01% -0.12% 0.13% -0.22% -0.09%

The heat map shows percentage changes of major currencies against each other. The base currency is picked from the left column, while the quote currency is picked from the top row. For example, if you pick the Euro from the left column and move along the horizontal line to the US Dollar, the percentage change displayed in the box will represent EUR (base)/USD (quote).

Daily Digest Market Movers: US PPI and Retail Sales data support the US DollarThe US Dollar keeps heading higher against most of its peers, as US macroeconomic data endorses the view that the Fed is likely to keep its monetary policy unchanged in the coming months.On Wednesday, November's US Producer Price Index (PPI) report showed inflation accelerated to a 3% year-on-year pace from 2.8% in the previous month, compared to expectations of a slowdown to 2.7%. Likewise, the core PPI rose 3% in the year to November, from 2.9%, also against the market consensus of 2.7%.These figures come after Tuesday's Consumer Prices Index (CPI), which showed steady readings in December and revealed that price pressures remain high in the US.Also on Wednesday, data from the US Census Bureau showed that Retail Sales grew at a 0.6% pace in November, following a 0.1% decline in October, and beating market expectations of a 0.4% increase. The strong consumption figures add to the case of a strong US economic performance in the last quarter of the year and ease pressure on the Fed to lower borrowing costs further.Geopolitical tensions have eased somewhat, as President Trump affirmed that he believes the killings of protesters in Iran have subsided, as US experts warned about the risks of a military intervention against the Islamic Republic. Oil and safe havens like precious metals have pulled back following the comments, which are also likely to weigh on the US Dollar's rally.In Europe, later on Thursday, Eurostat will release the Eurozone's Industrial Production data. Factory output is expected to have increased 0.5% in November, following a 0.8% increase in October. Year-on-Year, production is seen growing at a steady 2% pace.In the US, the NY Empire State Manufacturing Index and the Philadelphia Fed Manufacturing Survey will provide some insight into the sector's activity ahead of speeches from Atlanta Fed President Raphael Bostic, Governor Michael Barr, Richmond Fed President Thomas Barkin, and Kansas City Fed President Jeffrey Schmid.Technical Analysis: EUR/USD remains close to 1.1618 lowsEUR/USD Chart
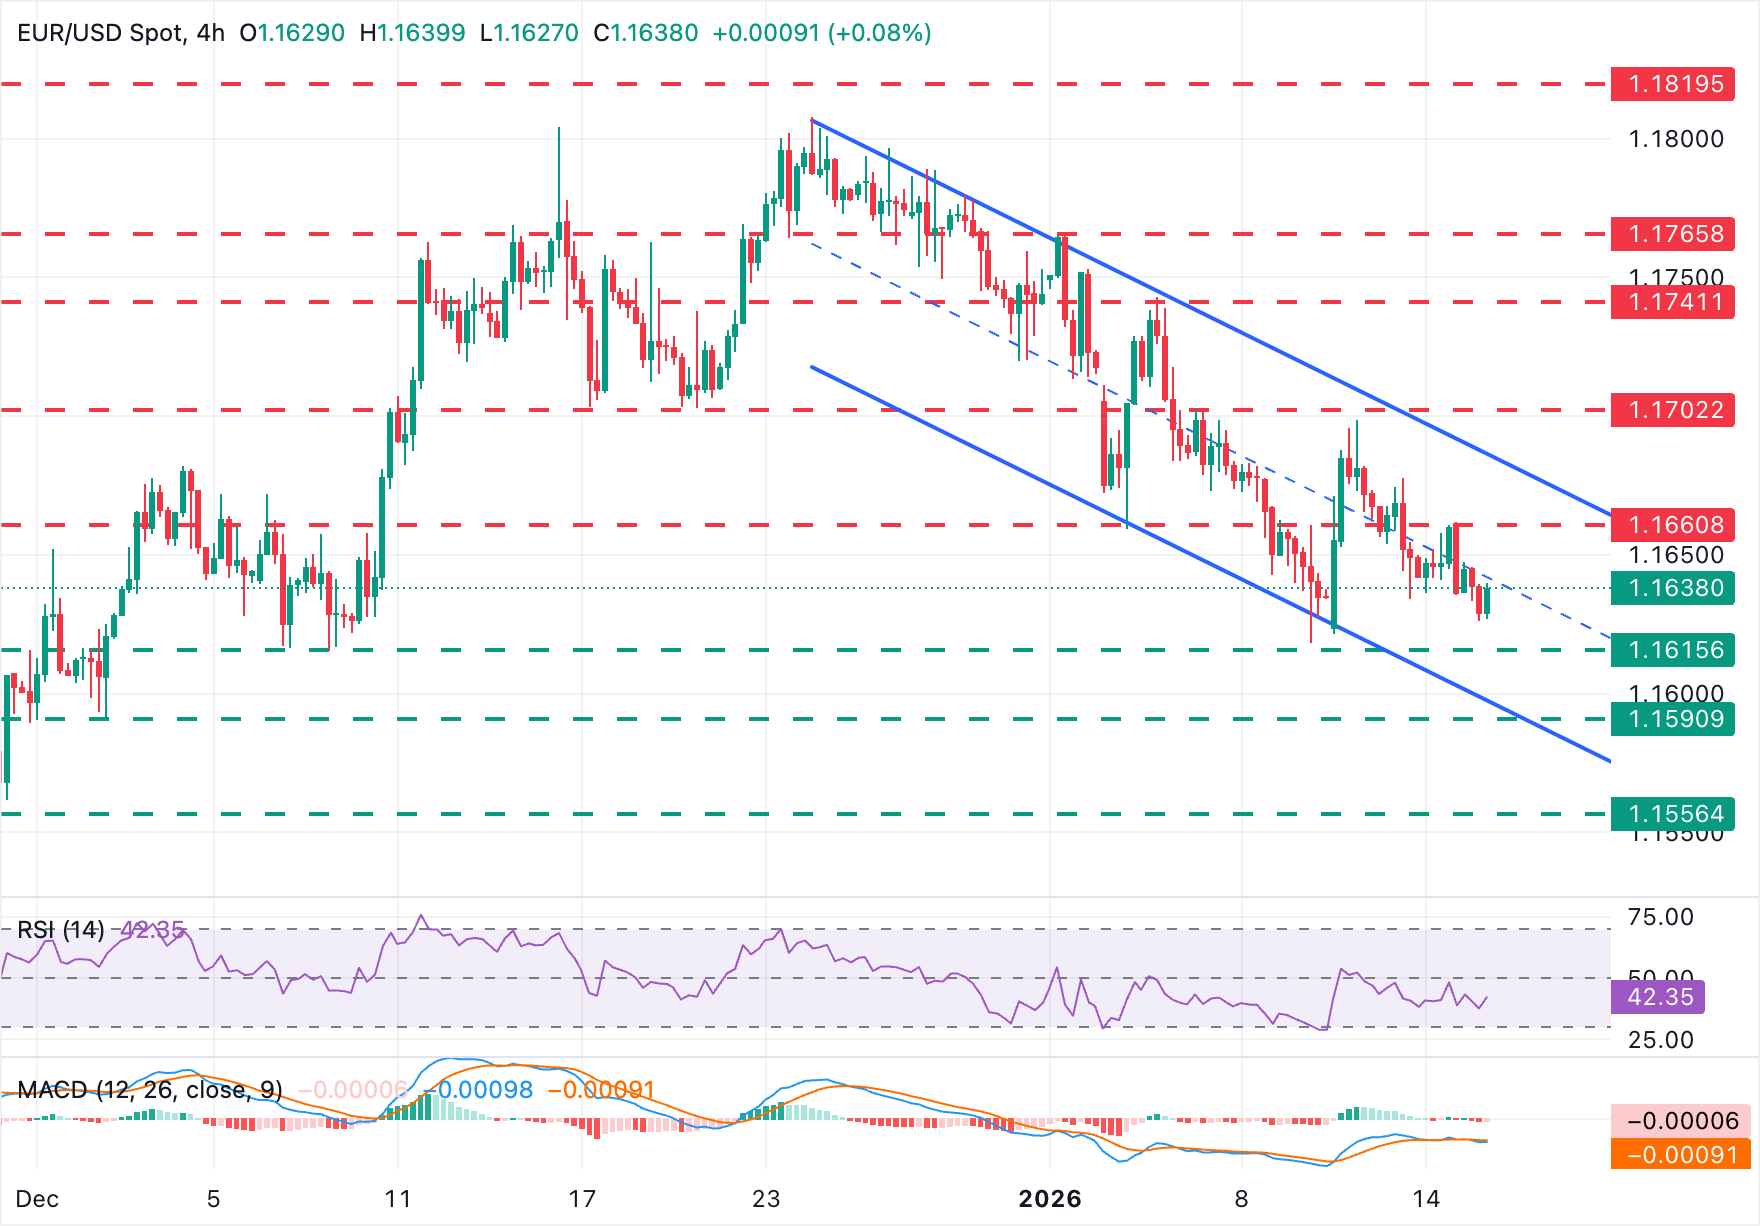
EUR/USD 4-Hour Chart


The EUR/USD trades near 1.1635 at the time of writing, extending its reversal from weekly highs near 1.1700 with price action contained within a descending channel since late December. The Moving Average Convergence Divergence (MACD) indicator holds around the zero line on the 4-hour chart, highlighting a neutral tone, while the Relative Strength Index (RSI) is pointing downwards at 38, suggesting increasing bearish momentum.

Bears are aiming for the January 9 low, in the vicinity of 1.1615. Further down, the area between the channel bottom, now around 1.1600, and the December 2 low, at 1.1590, is likely to be targeted. To the upside, Wednesday's high, at 1.1660, might pose some resistance ahead of the channel top, at 1.1690, and the January 12 high, near 1.1700.

(The technical analysis of this story was written with the help of an AI tool.)

Economic Indicator
Industrial Production s.a. (MoM)

The Industrial Production index, released by Eurostat on a monthly basis, measures changes in the price-adjusted output of industry. It is a widely-followed indicator to gauge the strength in the Eurozone’s manufacturing sector. Generally, a high reading is seen as bullish for the Euro (EUR), while a low reading is seen as bearish.

Read more.

Last release: Thu Jan 15, 2026 10:00

Frequency: Monthly

Actual: 0.7%

Consensus: 0.5%

Previous: 0.8%

Source: Eurostat

Economic Indicator
Industrial Production w.d.a. (YoY)

The Industrial Production is released by the Eurostat. It shows the volume of production of Industries such as factories and manufacturing. Up trend is regarded as inflationary which may anticipate interest rates to rise. Usually, if high industrial production growth comes out, this may generate a positive sentiment (or bullish) for the EUR, while low industrial production is seen as a negative sentiment (or bearish).

Read more.

Last release: Thu Jan 15, 2026 10:00

Frequency: Monthly

Actual: 2.5%

Consensus: 2%

Previous: 2%

Source: Eurostat

This publication has been prepared by OANDA TMS Brokers S.A. with its registered office in Warsaw, Warsaw UNIT, Daszyńskiego 1, 00-843 Warsaw, registered by the District Court for the Capital City of Warsaw in Warsaw, XIII Commercial Division of the National Court Register under KRS number 0000204776, NIP number 5262759131, with a share capital amounting to PLN 3,537.560, fully paid up, operating in accordance with the Act on Trading in Financial Instruments dated July 29th 2005, exclusively for the needs of OANDA TMS Brokers' clients. OANDA TMS Brokers is subject to the supervision of the Polish Financial Supervision Authority on the basis of an authorization of April 26th 2004 (KPWiG-4021-54-1/2004)

This publication is a commercial publication within the meaning of art. 36 par. 2 of Commission Delegated Regulation (EU) 2017/565 of 25 April 2016 supplementing Directive 2014/65 / EU of the European Parliament and of the Council with regard to the organizational requirements and operating conditions of investment firms and the concepts defined for the purposes of this directive.

Recipients of this publication should consult the financial adviser before taking any investment decision on the basis of this publication.

In the preparation of this document OANDA TMS Brokers not take into account the individual needs and situation of the investor. Investments and services presented or included in this document may not be suitable for a specific investor, therefore, in case of doubts concerning such investments or investment services, it is recommended to consult an independent investment advisor.

Recipients of this report must make their own determination of the appropriateness of an investment in any financial instruments referred to herein based on the merits and risks involved, their own investment strategy and their legal and financial position.

None of the information presented in this publication constitutes investment, legal, accounting or tax advice or a statement that any investment strategy is adequate or appropriate due to individual circumstances related to the recipient, as well as does not constitute any other personal recommendation. OANDA TMS Brokers does not provide tax advisory services related to investing in financial instruments and recommends to contact an independent tax advisor.

OANDA TMS Brokers informs that in the case of a general recommendation service, there is a conflict of interest consisting in the issuance by OANDA TMS Brokers recommendation of a general nature, while OANDA TMS Brokers concluded transactions on the trading portfolio.

This publication is only informative and:

(i) does not constitute or form part of a sale, subscription or invitation to subscribe for any financial instruments,

(ii) it is not intended to offer or purchase or subscribe to or acquire any financial instruments

(iii) does not constitute advertising of any financial instruments

This publication has been prepared with due diligence, reliability and principles of objectivity based on generally available information. The information and opinions contained in this document have been collected or developed by OANDA TMS Brokers based on sources considered reliable, however OANDA TMS Brokers and related entities are not responsible for any inaccuracies or omissions. This document expresses the knowledge and views of its authors, as at the date of preparation.

The results achieved in the past should not be treated as an indication of whether the guarantee of future results. OANDA TMS Brokers is not responsible for investment decisions taken on the basis of this publication or for damages incurred as a result of investment decisions based on this publication.

The date on the first page of this publication is the date of its preparation and publication.

The Stocks service variant is offered in cross-selling together with the CFDs service variant. Detailed information on the risks arising from the various services being part of the cross-selling, as well as information on the costs and fees associated with these services, is available at OANDA TMS Brokers website in the Documents section.

CFDs are complex instruments and involve a high risk of a quick loss of cash due to leverage. 76% of retail investors' accounts record losses as a result of trading CFDs at this supplier. Consider if you understand how CFDs work and whether you can afford a high risk of losing money.

Detailed information about OANDA TMS Brokers, principles of preparing and disseminating recommendations, sources of information, determining recipients of recommendations, professional terminology, conflicts of interest, as well as frequency of issuing and validity of recommendations, are available at www.tmsbrokers.com in the section https://www.tmsbrokers.com/disclaimer

Scroll to top