Daily market news

22:00 - 08.05.2026
Author:

WTI declines as US-Iran deal hopes and Hormuz outlook weigh on oil

WTI, the US crude oil benchmark, falls some 2.49%, poised to end the week with losses of over 7.39%, amid growing speculation that the US and Iran will reach an agreement to end the conflict.

Forex
21:59 - 08.05.2026
Author:
Zain Vawda

Markets Weekly Outlook - Is the 'Risk-On' Rally sustainable with rates and energy elevated?

Equities surge despite high oil and rate expectations. This outlook covers US CPI, the Fed Chair transition from Powell to Warsh, DXY's bearish technical setup, and the sustainability of the "risk-on" rally amidst geopolitical tensions.

commodities Commodities
21:33 - 08.05.2026
Author:
Krzysztof Kamiński

Copper near record highs. Market fears supply constraints and bets on strong demand

Copper prices are approaching record highs as investors focus on long-term demand from artificial intelligence, power grids and clean energy, while supply risks grow due to sulfuric acid disruptions, weaker output in Chile and new strategic mining projects in Congo.

commodities Commodities
21:21 - 08.05.2026
Author:
Elior Manier

Are metals overdue for a rally? – Silver (XAG/USD) & Gold (XAU/USD) Outlook

XAU/USD, XAG/USD Outlook: Precious metals show signs of a bullish awakening as the traditional inverse relationship with crude oil begins to fade. With Copper breaking year-to-date highs and Gold printing a massive weekly hammer candle, the "war-driven" bear trend appears to be exhausting. Explore our intraday technical analysis of XAU/USD and XAG/USD to identify key breakout levels.

forex Forex
20:00 - 08.05.2026
Author:

USD/CHF Price Forecast: Spot tests lower Bollinger band as bearish momentum builds

USD/CHF trades on the back foot on Friday and is set for a second straight weekly decline amid broad-based weakness in the US Dollar (USD). At the time of writing, the pair is trading around 0.7773, hovering near two-month lows.

indices Indices
18:25 - 08.05.2026
Author:
Elior Manier

Tech continues to pull Stock Markets higher, S&P 500 at 7,400 – Dow Jones, Nasdaq and S&P 500 Intraday Levels

S&P 500, Dow Jones, Nasdaq Analysis and Trading Levels: Tech stocks propel the Nasdaq and S&P 500 to new heights as investors ignore geopolitical noise in favor of AI-driven growth. Despite diverging labor data and weak consumer sentiment, the bull run remains relentless. Explore critical technical levels for the major US indexes.

forex Forex
18:00 - 08.05.2026
Author:

USD/CAD climbs after Canada jobs data surprises to the downside.

USD/CAD edges higher on Friday as softer-than-expected Canadian employment data weighs on the Canadian Dollar (CAD), even as the US Dollar (USD) remains on the back foot following mixed US labor market data and hopes for a US-Iran deal to end the war.

forex Forex
17:00 - 08.05.2026
Author:

GBP/USD advances as US Dollar slips despite strong NFP, resilient Pound

GBP/USD advances around 1.3630 on Friday at the time of writing, up 0.54% on the day, benefiting from broad US Dollar weakness following the release of the US employment report.

commodities Commodities
16:11 - 08.05.2026
Author:
Elior Manier

Mixed feelings after the April Non-Farm Payrolls beat and Consumer Sentiment miss – Market Check

Global Markets update: US equities remain stoic following retaliatory strikes on Iranian energy hubs and a solid NFP beat of 115K. Despite a miss in consumer sentiment and higher inflation expectations, the cold-truce narrative persists. Explore our intraday market outlook and technical levels for the weekend

forex Forex
16:00 - 08.05.2026
Author:

EUR/USD: Recovery eyes full retracement – Scotiabank

Scotiabank strategists Shaun Osborne and Eric Theoret report the Euro (EUR) is modestly higher versus the Dollar, supported by risk sentiment around the US/Iran conflict despite softer German trade data and slightly reduced ECB tightening expectations.

OANDA's pick for the day

22:39 - 07.05.2026
Is the party over already? – North American Session Market Wrap for May 7
22:29 - 06.05.2026
The Peace rally can't be stopped – North American Session Market Wrap for May 6
22:11 - 04.05.2026
Sentiment waves are on a shore-break – North American Session Market Wrap for May 4
22:03 - 30.04.2026
It's an all-out rally after the Central Bank holds – North American Session Market Wrap for April 30
forex Forex
20:00 - 24.03.2026
Forex
20:00 - 24.03.2026

EUR/USD Price Forecast: RSI rebounds but bearish bias remains below 1.1600

EUR/USD weakens as Middle East tensions keep the US Dollar supported.Technically, EUR/USD remains below key moving averages, reinforcing a bearish bias.Momentum indicators show a cautious recovery within a broader bearish trend.

The Euro (EUR) trades under pressure against the US Dollar (USD) on Tuesday, as heightened geopolitical risks surrounding the US-Israel war with Iran continue to underpin demand for the Greenback. At the time of writing, EUR/USD is trading around 1.1573, reversing most of the previous day’s gains and down nearly 0.35% on the day.

Meanwhile, the US Dollar Index (DXY), which tracks the Greenback's value against a basket of six major currencies, is trading around 99.50, rebounding after briefly slipping below the 99.00 mark on Monday.

The Euro has remained under pressure since tensions in the Middle East escalated, weighed down by rising Oil prices and their negative impact on the Eurozone economy, given that the bloc is a net energy importer.

Higher energy costs are raising concerns about slower growth and persistent inflation across the region. Even rising expectations of European Central Bank (ECB) rate hikes have failed to provide meaningful support to the Euro.

In contrast, the US Dollar continues to benefit from multiple supportive factors. The United States is a net oil exporter, making it less affected by higher energy prices.

At the same time, Oil is priced in US Dollars, which increases global demand for the Greenback as prices rise. Additionally, during periods of uncertainty, investors also prefer the US Dollar for safety and liquidity, reinforcing its role as the world’s primary reserve currency. Further support comes from rising US Treasury yields, as markets have fully priced out the Federal Reserve’s (Fed) rate bets for this year.

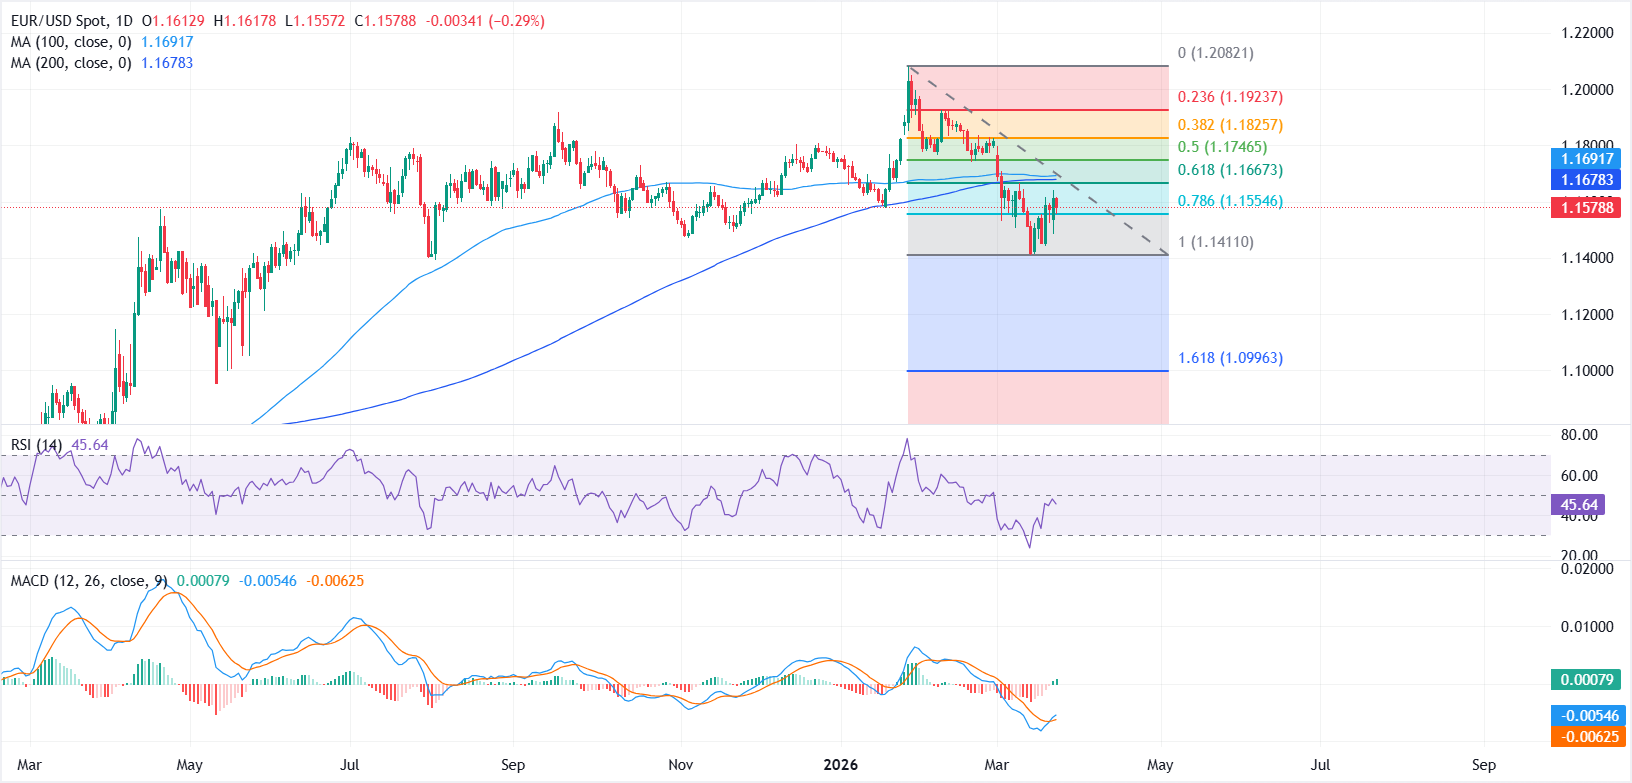
From a technical standpoint, the daily chart shows that the near-term bias remains mildly bearish as sellers continue to defend the 1.1600 mark while the pair trades below the clustered 100- and 200-day Simple Moving Averages (SMAs) around 1.1670-1.1680, keeping the broader tone under downward pressure.

However, momentum indicators suggest selling pressure may be easing, with the Relative Strength Index (RSI) rebounding from near-oversold levels to around 45, but still holding below the midline. The Moving Average Convergence Divergence (MACD) indicator has turned slightly positive but remains close to the zero line, which suggests only tentative recovery interest within an overall soft backdrop.

On the upside, immediate resistance is seen near 1.1665, marking the 61.8% Fibonacci retracement of the 1.2082–1.1411 decline, which also aligns with the 100- and 200-day SMAs, reinforcing a strong resistance zone. A sustained move above this level could open the door toward the 50% retracement near 1.1745, followed by the 38.2% level around 1.1825.

On the downside, immediate support lies at the recent swing low near 1.1410. A break below this level could accelerate losses toward the 1.1265 region, marked by the 161.8% Fibonacci extension, with further downside risk toward the 1.1200 psychological level.

Euro FAQs
What is the Euro?

The Euro is the currency for the 20 European Union countries that belong to the Eurozone. It is the second most heavily traded currency in the world behind the US Dollar. In 2022, it accounted for 31% of all foreign exchange transactions, with an average daily turnover of over $2.2 trillion a day. EUR/USD is the most heavily traded currency pair in the world, accounting for an estimated 30% off all transactions, followed by EUR/JPY (4%), EUR/GBP (3%) and EUR/AUD (2%).

What is the ECB and how does it impact the Euro?

The European Central Bank (ECB) in Frankfurt, Germany, is the reserve bank for the Eurozone. The ECB sets interest rates and manages monetary policy. The ECB’s primary mandate is to maintain price stability, which means either controlling inflation or stimulating growth. Its primary tool is the raising or lowering of interest rates. Relatively high interest rates – or the expectation of higher rates – will usually benefit the Euro and vice versa. The ECB Governing Council makes monetary policy decisions at meetings held eight times a year. Decisions are made by heads of the Eurozone national banks and six permanent members, including the President of the ECB, Christine Lagarde.

How does inflation data impact the value of the Euro?

Eurozone inflation data, measured by the Harmonized Index of Consumer Prices (HICP), is an important econometric for the Euro. If inflation rises more than expected, especially if above the ECB’s 2% target, it obliges the ECB to raise interest rates to bring it back under control. Relatively high interest rates compared to its counterparts will usually benefit the Euro, as it makes the region more attractive as a place for global investors to park their money.

How does economic data influence the value of the Euro?

Data releases gauge the health of the economy and can impact on the Euro. Indicators such as GDP, Manufacturing and Services PMIs, employment, and consumer sentiment surveys can all influence the direction of the single currency. A strong economy is good for the Euro. Not only does it attract more foreign investment but it may encourage the ECB to put up interest rates, which will directly strengthen the Euro. Otherwise, if economic data is weak, the Euro is likely to fall. Economic data for the four largest economies in the euro area (Germany, France, Italy and Spain) are especially significant, as they account for 75% of the Eurozone’s economy.

How does the Trade Balance impact the Euro?

Another significant data release for the Euro is the Trade Balance. This indicator measures the difference between what a country earns from its exports and what it spends on imports over a given period. If a country produces highly sought after exports then its currency will gain in value purely from the extra demand created from foreign buyers seeking to purchase these goods. Therefore, a positive net Trade Balance strengthens a currency and vice versa for a negative balance.

This publication has been prepared by OANDA TMS Brokers S.A. with its registered office in Warsaw, Warsaw UNIT, Daszyńskiego 1, 00-843 Warsaw, registered by the District Court for the Capital City of Warsaw in Warsaw, XIII Commercial Division of the National Court Register under KRS number 0000204776, NIP number 5262759131, with a share capital amounting to PLN 3,537.560, fully paid up, operating in accordance with the Act on Trading in Financial Instruments dated July 29th 2005, exclusively for the needs of OANDA TMS Brokers' clients. OANDA TMS Brokers is subject to the supervision of the Polish Financial Supervision Authority on the basis of an authorization of April 26th 2004 (KPWiG-4021-54-1/2004)

This publication is a commercial publication within the meaning of art. 36 par. 2 of Commission Delegated Regulation (EU) 2017/565 of 25 April 2016 supplementing Directive 2014/65 / EU of the European Parliament and of the Council with regard to the organizational requirements and operating conditions of investment firms and the concepts defined for the purposes of this directive.

Recipients of this publication should consult the financial adviser before taking any investment decision on the basis of this publication.

In the preparation of this document OANDA TMS Brokers not take into account the individual needs and situation of the investor. Investments and services presented or included in this document may not be suitable for a specific investor, therefore, in case of doubts concerning such investments or investment services, it is recommended to consult an independent investment advisor.

Recipients of this report must make their own determination of the appropriateness of an investment in any financial instruments referred to herein based on the merits and risks involved, their own investment strategy and their legal and financial position.

None of the information presented in this publication constitutes investment, legal, accounting or tax advice or a statement that any investment strategy is adequate or appropriate due to individual circumstances related to the recipient, as well as does not constitute any other personal recommendation. OANDA TMS Brokers does not provide tax advisory services related to investing in financial instruments and recommends to contact an independent tax advisor.

OANDA TMS Brokers informs that in the case of a general recommendation service, there is a conflict of interest consisting in the issuance by OANDA TMS Brokers recommendation of a general nature, while OANDA TMS Brokers concluded transactions on the trading portfolio.

This publication is only informative and:

(i) does not constitute or form part of a sale, subscription or invitation to subscribe for any financial instruments,

(ii) it is not intended to offer or purchase or subscribe to or acquire any financial instruments

(iii) does not constitute advertising of any financial instruments

This publication has been prepared with due diligence, reliability and principles of objectivity based on generally available information. The information and opinions contained in this document have been collected or developed by OANDA TMS Brokers based on sources considered reliable, however OANDA TMS Brokers and related entities are not responsible for any inaccuracies or omissions. This document expresses the knowledge and views of its authors, as at the date of preparation.

The results achieved in the past should not be treated as an indication of whether the guarantee of future results. OANDA TMS Brokers is not responsible for investment decisions taken on the basis of this publication or for damages incurred as a result of investment decisions based on this publication.

The date on the first page of this publication is the date of its preparation and publication.

The Stocks service variant is offered in cross-selling together with the CFDs service variant. Detailed information on the risks arising from the various services being part of the cross-selling, as well as information on the costs and fees associated with these services, is available at OANDA TMS Brokers website in the Documents section.

CFDs are complex instruments and involve a high risk of a quick loss of cash due to leverage. 76% of retail investors' accounts record losses as a result of trading CFDs at this supplier. Consider if you understand how CFDs work and whether you can afford a high risk of losing money.

Detailed information about OANDA TMS Brokers, principles of preparing and disseminating recommendations, sources of information, determining recipients of recommendations, professional terminology, conflicts of interest, as well as frequency of issuing and validity of recommendations, are available at www.tmsbrokers.com in the section https://www.tmsbrokers.com/disclaimer

Scroll to top