




Daily market news

commodities Commodities
08:00 - 13.05.2026
Author:

Silver Price Forecast: XAG/USD holds onto gains around $87, ignoring hawkish Fed bets

Silver price (XAG/USD) trades firmly near $87.00 in the early European trade on Wednesday. Earlier in the day, the white metal posted a fresh two-month high of $87.82.

indices Indices
07:34 - 13.05.2026
Author:
kelvin_wong
Kelvin Wong

Chart alert: Nasdaq 100 faces pullback risk as semiconductor rally shows signs of exhaustion

Nasdaq 100 surged to a fresh all-time high of 29,390 as semiconductor and AI-related stocks continued to fuel the rally. However, growing signs of bullish exhaustion in the semiconductor sector, particularly within the SOXX ETF, are raising the risk of a short-term corrective pullback. Bearish RSI divergence, stretched price action above the 20-day moving average, and elevated volatility conditions suggest the Nasdaq 100 may face a minor mean reversion decline below the 29,505/615 resistance.

06:00 - 13.05.2026
Author:

WTI corrects to near $97.20 amid oil demand concerns, Trump-Xi meeting in focus

West Texas Intermediate (WTI), futures on NYMEX, is down 1.5% to near $97.20 during the Asian trading session on Wednesday.

commodities Commodities
04:01 - 13.05.2026
Author:
kelvin_wong
Kelvin Wong

Asia open: US inflation reaccelerates to 3.8%, and chip stocks falter

US inflation surged to 3.8% in April, the highest level in three years, wiping out Federal Reserve rate cut expectations and pushing Treasury yields and the US dollar higher. Meanwhile, semiconductor stocks sharply reversed after a massive six-week rally, dragging the Nasdaq 100 lower. USD/JPY climbed toward the key 157.90 intervention risk level as traders monitored possible Japanese authorities’ action amid rising market volatility and fading US-Iran peace hopes.

commodities Commodities
04:00 - 13.05.2026
Author:

Silver Price Forecast: XAG/USD advances to near $87.00 on rising industrial demand

Silver price (XAG/USD) continues its winning streak for the sixth successive day, trading around $86.80 per troy ounce during the Asian hours on Wednesday.

02:00 - 13.05.2026
Author:

WTI Crude Oil rallies (again) as Trump rejects Iran peace proposal

Wednesday's EIA inventory data will test how tight US crude supply has become amid the prolonged Hormuz closure.

commodities Commodities
22:16 - 12.05.2026
Author:
Elior Manier

Gold (XAU/USD) rises slow and steady – In-depth Gold technical analysis

Gold (XAU/USD) update: Gold (XAU/USD) remains remarkably resilient, consolidating within a wide $4,500 to $4,900 range despite a hot US CPI print and a surging Dollar. As the metals complex digests China’s 45-month high inflation and pivots toward the high-stakes Trump-Xi summit, explore our in-depth technical analysis for Gold’s next major move.

forex Forex
22:00 - 12.05.2026
Author:

Forex Today: Hot US CPI boosts US Dollar as Treasury yields climb

The US Dollar Index (DXY) rallied toward the 98.30 region on Tuesday as hotter-than-expected United States (US) inflation data boosted Treasury yields and reinforced expectations that the Federal Reserve (Fed) may keep interest rates elevated for longer.

20:00 - 12.05.2026
Author:

WTI Price Forecast: Oil prices remain underpinned by Hormuz tensions and tighter supply outlook

West Texas Intermediate (WTI) crude Oil rallies more than 3% on Tuesday as fading hopes for a near-term end to the US-Iran war continue to fuel concerns over supply disruptions through the Strait of Hormuz.

Forex
16:25 - 12.05.2026
Author:
Elior Manier

The US Dollar rallies back after CPI, is the correction is over ? – EUR/USD, GBP/USD & Dollar Index (DXY) overview

Forex Market update: The US Dollar rallies sharply as domestic inflation beats expectations and geopolitical uncertainty persists. As EUR/USD and GBP/USD reverse their recent gains amid triple-digit oil prices and fading peace hopes, explore our technical analysis to determine if the Dollar's correction is officially over.

OANDA's pick for the day

22:39 - 07.05.2026
Is the party over already? – North American Session Market Wrap for May 7
22:29 - 06.05.2026
The Peace rally can't be stopped – North American Session Market Wrap for May 6
22:11 - 04.05.2026
Sentiment waves are on a shore-break – North American Session Market Wrap for May 4
22:03 - 30.04.2026
It's an all-out rally after the Central Bank holds – North American Session Market Wrap for April 30
forex Forex
11:00 - 14.04.2026
Forex
11:00 - 14.04.2026

EUR/GBP Price Forecasts: Treads water at 0.8700, awaiting Bailey and Lagarde

EUR/GBP keeps wavering right above 0.8700 without a clear bias.Hopes of a resolution of the Middle East conflict have improved market sentiment.Lagarde's and Bailey's speeches could break the pair's standstill later on Tuesday.

The Euro (EUR) keeps trading sideways around 0.8700 against the British Pound GBP) on Tuesday. The improved risk mood amid hopes of further US-Iran peace talks has failed to break the pair’s range-bound trend, and investors await speeches by European Central Bank (ECB) President Christine Lagarde and Bank of England (BoE) Governor Andrew Bailey at the IMF forum later today.

The US military keeps blocking Iran’s harbours, but a Reuters report suggesting that US and Iranian teams could return to Islamabad for peace talks this week has boosted risk appetite. sending both currencies higher against the safe-haven US Dollar on Tuesday.

In the Eurozone, German March wholesale prices and, to a lesser extent, Spanish consumer inflation figures confirmed the inflationary impact of the war in Iran and added pressure on the ECB to hike interest rates in the near term.

Technical Analysis: Breaking trendline supportEUR/GBP Chart Analysis
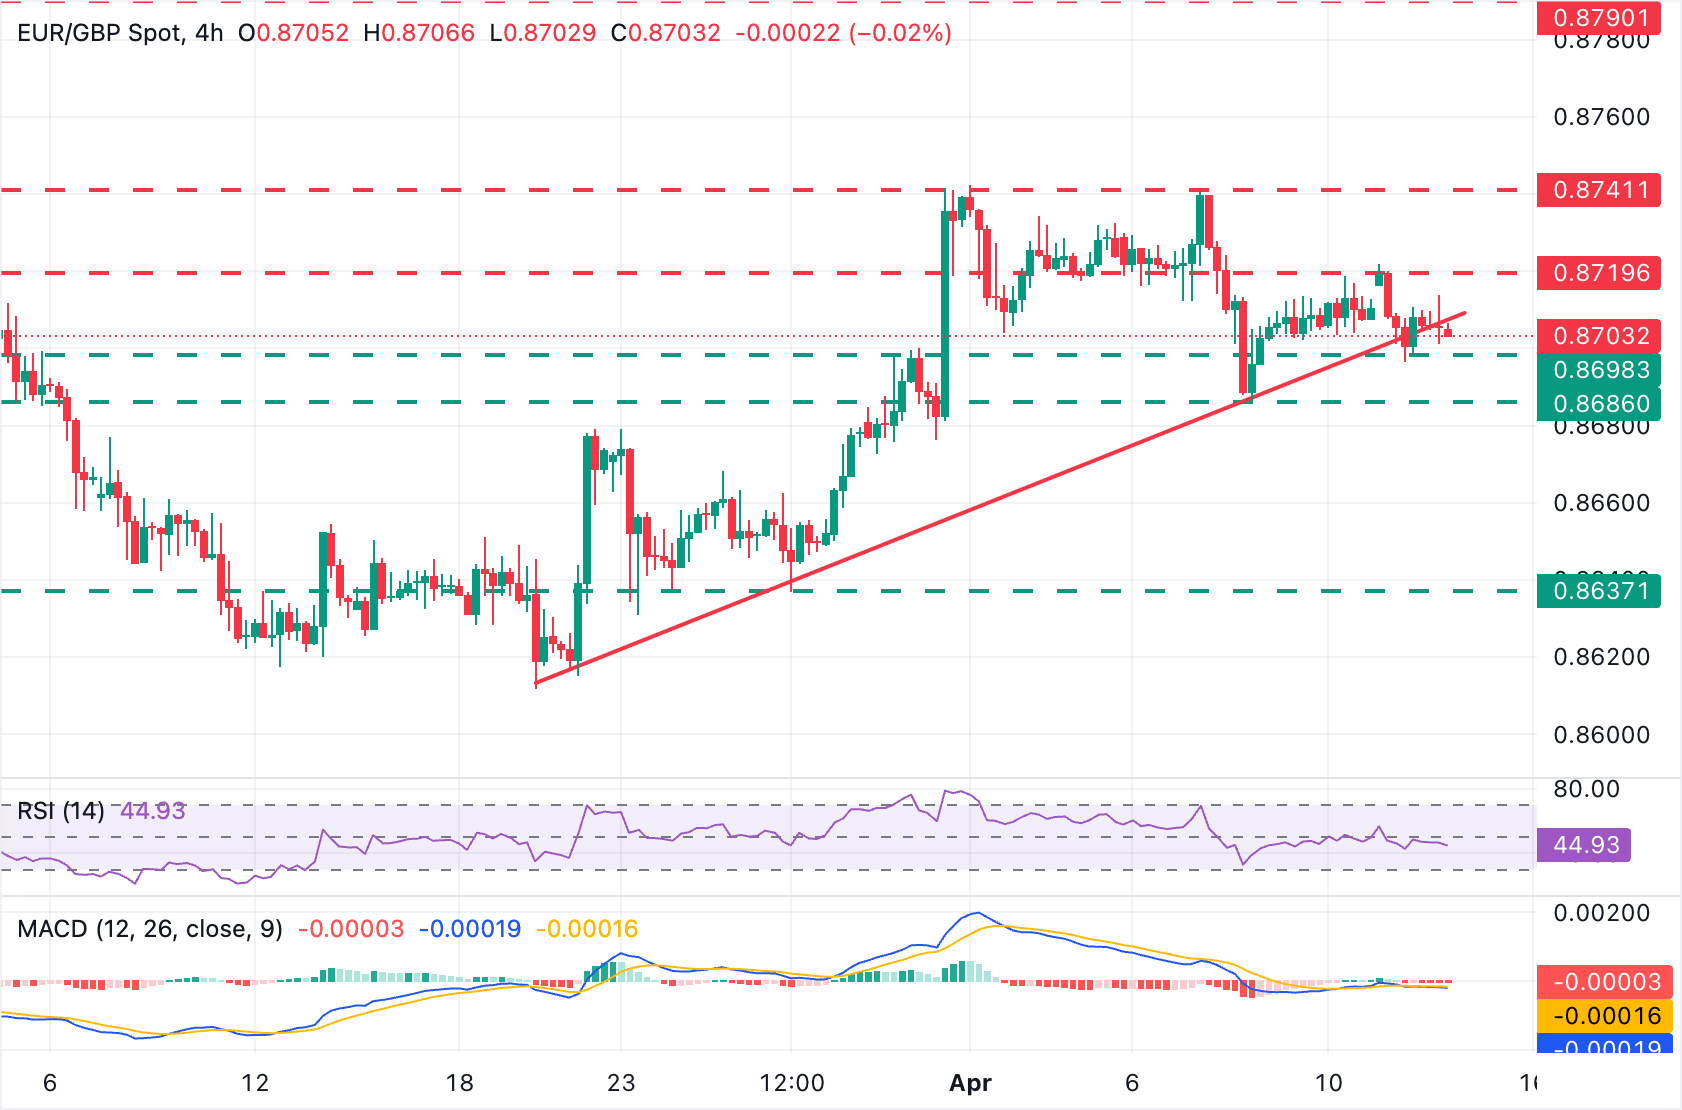

From a technical perspective, the EUR/GBP's four-hour chart shows the pair flatlining right above the 0.8700 level, with price action consolidating just under a broken trend-line support, which is now turning into resistance around 0.8710.

Technical indicators show a lack of directional conviction for now. The Relative Strength Index (RSI) slips toward the mid-40s while the Moving Average Convergence Divergence (MACD) hovers around the zero line, highlighting fading upside momentum.

Immediate support is seen at the mentioned 0.8700 area, with a break exposing the April 8 low near 0.8685 and the March 23, 24, and 26 lows around 0.8635. On the upside, bulls should return above the broken trendline, now at 0.8710 and Monday's high, at 0.8720, to resume the broader upside trend and aim for the April 1 and 7 highs in the area of 0.8740.

(The technical analysis of this story was written with the help of an AI tool.)

Euro Price Today

The table below shows the percentage change of Euro (EUR) against listed major currencies today. Euro was the strongest against the US Dollar.

USD EUR GBP JPY CAD AUD NZD CHF USD -0.19% -0.23% -0.24% -0.21% -0.11% -0.41% -0.42% EUR 0.19% -0.03% -0.04% -0.01% 0.08% -0.23% -0.24% GBP 0.23% 0.03% 0.00% 0.03% 0.11% -0.19% -0.21% JPY 0.24% 0.04% 0.00% 0.03% 0.13% -0.18% -0.19% CAD 0.21% 0.01% -0.03% -0.03% 0.09% -0.19% -0.22% AUD 0.11% -0.08% -0.11% -0.13% -0.09% -0.31% -0.32% NZD 0.41% 0.23% 0.19% 0.18% 0.19% 0.31% -0.01% CHF 0.42% 0.24% 0.21% 0.19% 0.22% 0.32% 0.01%

The heat map shows percentage changes of major currencies against each other. The base currency is picked from the left column, while the quote currency is picked from the top row. For example, if you pick the Euro from the left column and move along the horizontal line to the US Dollar, the percentage change displayed in the box will represent EUR (base)/USD (quote).

,

This publication has been prepared by OANDA TMS Brokers S.A. with its registered office in Warsaw, Warsaw UNIT, Daszyńskiego 1, 00-843 Warsaw, registered by the District Court for the Capital City of Warsaw in Warsaw, XIII Commercial Division of the National Court Register under KRS number 0000204776, NIP number 5262759131, with a share capital amounting to PLN 3,537.560, fully paid up, operating in accordance with the Act on Trading in Financial Instruments dated July 29th 2005, exclusively for the needs of OANDA TMS Brokers' clients. OANDA TMS Brokers is subject to the supervision of the Polish Financial Supervision Authority on the basis of an authorization of April 26th 2004 (KPWiG-4021-54-1/2004)

This publication is a commercial publication within the meaning of art. 36 par. 2 of Commission Delegated Regulation (EU) 2017/565 of 25 April 2016 supplementing Directive 2014/65 / EU of the European Parliament and of the Council with regard to the organizational requirements and operating conditions of investment firms and the concepts defined for the purposes of this directive.

Recipients of this publication should consult the financial adviser before taking any investment decision on the basis of this publication.

In the preparation of this document OANDA TMS Brokers not take into account the individual needs and situation of the investor. Investments and services presented or included in this document may not be suitable for a specific investor, therefore, in case of doubts concerning such investments or investment services, it is recommended to consult an independent investment advisor.

Recipients of this report must make their own determination of the appropriateness of an investment in any financial instruments referred to herein based on the merits and risks involved, their own investment strategy and their legal and financial position.

None of the information presented in this publication constitutes investment, legal, accounting or tax advice or a statement that any investment strategy is adequate or appropriate due to individual circumstances related to the recipient, as well as does not constitute any other personal recommendation. OANDA TMS Brokers does not provide tax advisory services related to investing in financial instruments and recommends to contact an independent tax advisor.

OANDA TMS Brokers informs that in the case of a general recommendation service, there is a conflict of interest consisting in the issuance by OANDA TMS Brokers recommendation of a general nature, while OANDA TMS Brokers concluded transactions on the trading portfolio.

This publication is only informative and:

(i) does not constitute or form part of a sale, subscription or invitation to subscribe for any financial instruments,

(ii) it is not intended to offer or purchase or subscribe to or acquire any financial instruments

(iii) does not constitute advertising of any financial instruments

This publication has been prepared with due diligence, reliability and principles of objectivity based on generally available information. The information and opinions contained in this document have been collected or developed by OANDA TMS Brokers based on sources considered reliable, however OANDA TMS Brokers and related entities are not responsible for any inaccuracies or omissions. This document expresses the knowledge and views of its authors, as at the date of preparation.

The results achieved in the past should not be treated as an indication of whether the guarantee of future results. OANDA TMS Brokers is not responsible for investment decisions taken on the basis of this publication or for damages incurred as a result of investment decisions based on this publication.

The date on the first page of this publication is the date of its preparation and publication.

The Stocks service variant is offered in cross-selling together with the CFDs service variant. Detailed information on the risks arising from the various services being part of the cross-selling, as well as information on the costs and fees associated with these services, is available at OANDA TMS Brokers website in the Documents section.

CFDs are complex instruments and involve a high risk of a quick loss of cash due to leverage. 76% of retail investors' accounts record losses as a result of trading CFDs at this supplier. Consider if you understand how CFDs work and whether you can afford a high risk of losing money.

Detailed information about OANDA TMS Brokers, principles of preparing and disseminating recommendations, sources of information, determining recipients of recommendations, professional terminology, conflicts of interest, as well as frequency of issuing and validity of recommendations, are available at www.tmsbrokers.com in the section https://www.tmsbrokers.com/disclaimer

Scroll to top