










Chart alert: Gold major bullish breakout as USD debasement narrative takes hold
Key takeaways
- Gold surges: XAU/USD jumped 4.35% on 19 August, its biggest one-day gain since February, lifting its August gain to 10.7%.
- USD debasement drives gold: Treasury bond buybacks have fuelled fiscal-dominance concerns, shifting focus from yields to US dollar purchasing-power risk.
- $4,405 is pivotal: Holding above $4,434/$4,405 keeps the bullish sequence intact, with a break above $4,504 exposing $4,580 and $4,640.
Gold (XAU/US) has been on a tear to the upside since the start of August 2026. The precious yellow metal has staged a 10% rally from the potential major swing low of $3,942, printed on 30 June 2026, to Tuesday, 18 August 2026’s closing level of $4,335.
On Wednesday, 19 August 2026, it added a daily gain of 4.35% to close at US$4,523, its largest single-day rally since February 2026.
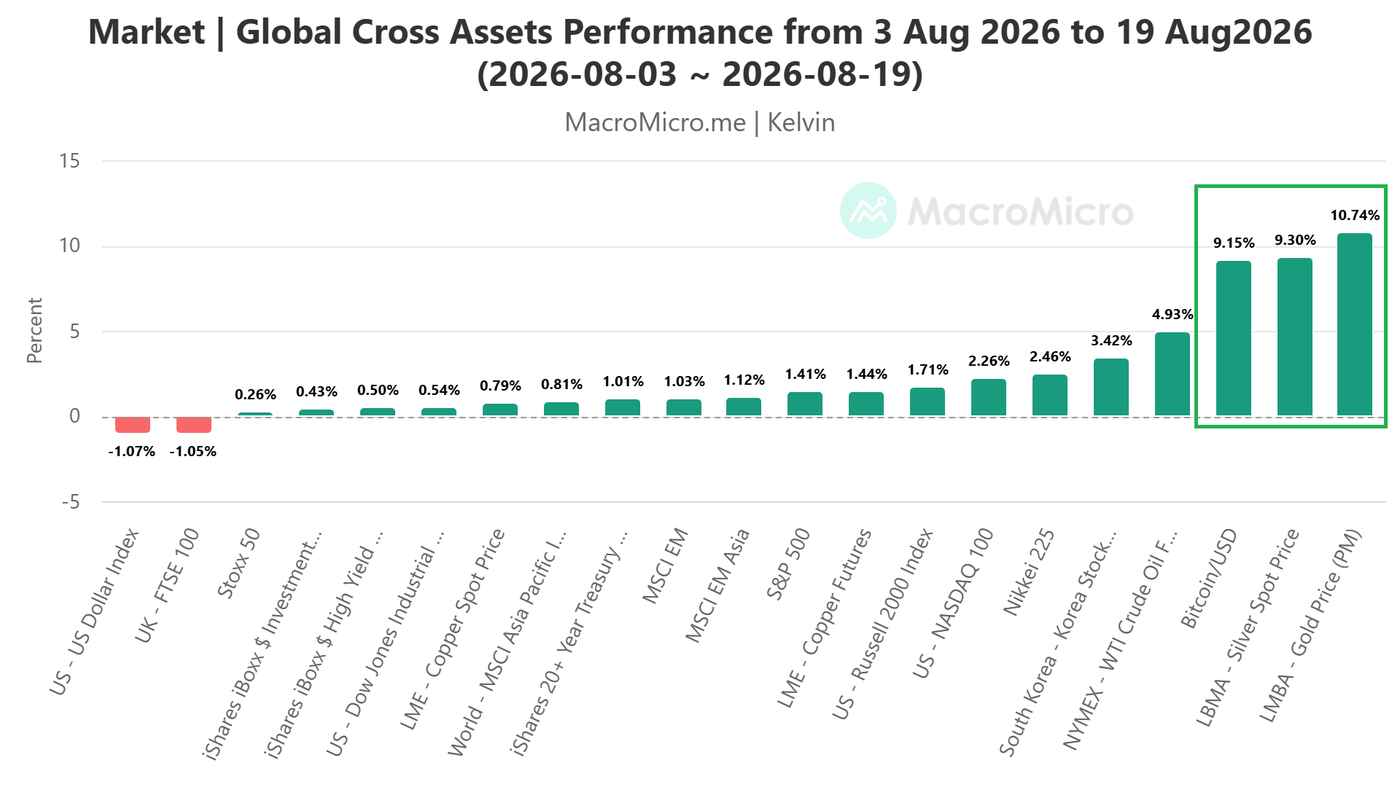
Overall, spot gold (quoted by the London Bullion Market Association) has now transitioned from a prior underperformer (in July 2026) to the top performer, month-to-date, as of 19 August 2026, with a stellar gain of 10.7% among major cross-asset classes, followed by spot silver (+9.3%), and Bitcoin/USD (+9.1%) (see Fig. 1).
US Treasury buybacks, fiscal dominance & USD debasement
The rally in gold (XAU/USD), as reported by most media outlets, has been catalyzed by a sudden announcement of the US Treasury’s doubling of the buyback program for long-dated US Treasury bonds (10-year to 30-year) from $2 billon per operation to $4 billionb operation in a bid to rein in long-term borrowing costs as the 30-year US Treasury yield rocketed to a 19-year high of 5.31% at the start of this week.
Yesterday’s larger US Treasury bond buyback program sent the 30-year yield down by 10 basis points, closing at 5.19% (still an elevated level, a 19-year high) on Wednesday, 19 August 2026.
These media outlets’ reports connected the dots through the lens of interest rates: lower long-term US Treasury yields reduce the opportunity cost of holding gold, a non-income-bearing asset, which, in turn, triggered a positive feedback loop into gold.
On the contrary, the rally in gold (XAU/USD) since the end of June 2026 has come in the backdrop of a rising 30-year US Treasury yield (+44 bps) over the same period.
Thus, gold traders are not really pricing in a bullish movement triggered by the pure interest rate conduit, but rather through a currency purchasing power perspective; the US dollar debasement narrative.
Wednesday’s aggressive bullish price action in gold, which saw the US Dollar Index tumble to a three-month low, is being interpreted as a “panic intervention” by the US Treasury and as a sign of fiscal dominance, in which fiscal debt management takes precedence over monetary discipline.
When government bodies step in to cushion sovereign bond markets amid persistent deficit spending, market participants rapidly reprice the risk of long-term USD debasement. Non-yielding bullion directly benefits as a store of value, free from counterparty and inflation risk.
Let’s now unpack the latest short-term technicals of gold (XAU/USD).
Potential start of a new medium-term bullish impulsive up move sequence
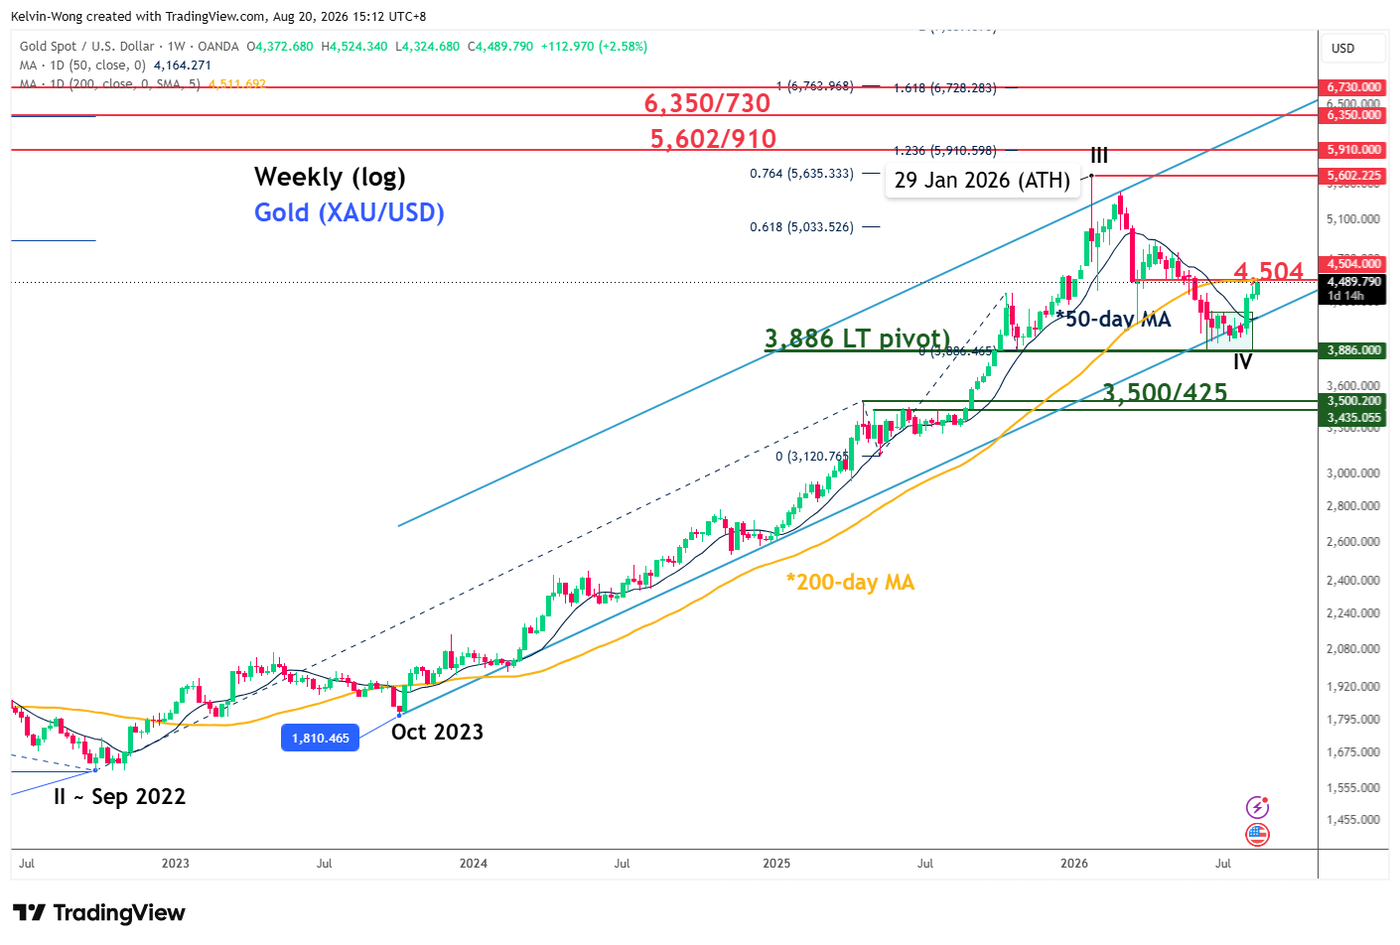

The 6-month corrective decline of 30% from its current all-time intraday high of $5,602 on 29 January 2026 is likely to have ended on 29 January 2026 where its weekly price actions have staged a rebound from the lower boundary of a major ascending channel running from October 2023 low, cleared above the 50-day moving average with a weekly bullish reversal candlestick pattern follow-through on the week of 3 August 2026 (see Fig. 2).
In the short to medium-term horizon, gold (XAU/USD) is now oscillating within an ascending channel in place since the 3 August 2026 low of $4,019.
Watch the $4,434/4,405 key short-term pivotal support to maintain the multi-day bullish impulsive up move sequence. A clearance above the $4,504 near-term resistance (also close to the key 200-day moving average) is likely to reinforce the bullish potential towards the next intermediate resistances at $4,580 and $4,640 in the first step (see Fig. 3).
On the other hand, failure to hold and an hourly close below $4,405 negates the bullish tone for another set of minor corrective pull-back towards the next intermediate support at $4,320 (also the lower boundary of the ascending channel).
Opinions are the authors'; not necessarily that of OANDA Business Information & Services, Inc. or any of its affiliates, subsidiaries, officers or directors. The provided publication is for informational and educational purposes only.
If you would like to reproduce or redistribute any of the content found on MarketPulse, an award winning forex, commodities and global indices analysis and news site service produced by OANDA Business Information & Services, Inc., please refer to the MarketPulse Terms of Use.
Visit https://www.marketpulse.com/ to find out more about the beat of the global markets.
© 2026 OANDA Business Information & Services Inc.