


0.5560: Acts as key support level for NZD/USD pair
- New Zealand Dollar recovers to near 0.5600 against the US Dollar after revisiting 18-month low of 0.5564
- Democrats win majority seats in both the House and the Senate.
- Investors await the US ADP Employment Change and the ISM Services PMI data for October.
The New Zealand Dollar (NZD) holds onto early recovery move at around 0.5600 against the US Dollar (USD) during the European trade on Wednesday. The Kiwi pair bounces back after revisiting the 18-month low at 0.5564.
The outlook of the Kiwi pair is expected to remain uncertain as the US Dollar has shown signs of recovery after the outcome of United States (US) midterm elections, in which Democrats have won majority in both the House and the Senate.
As of writing, the US Dollar Index (DXY), which gauges the Greenback’s value against six major currencies, trades 0.34% lower to near 101.55. However, the DXY has recovered significantly from its day’s low of 101.25.
The US Dollar was underperforming in the past few weeks as market participants had already priced in Democrats’ victory in both houses of Federal laws.
Going forward, investors will focus on the US ADP Employment Change data for October, which will be published at 13:15 GMT. The US agency is expected to show that private employers hired 69K fresh workers, lower than 90K in September.
Later in the day, financial markets will also pay attention to the US ISM Services PMI data for October. The Services PMI is seen at 54.8, marginally lower than the previous reading of 54.9.
NZD/USD Technical Analysis
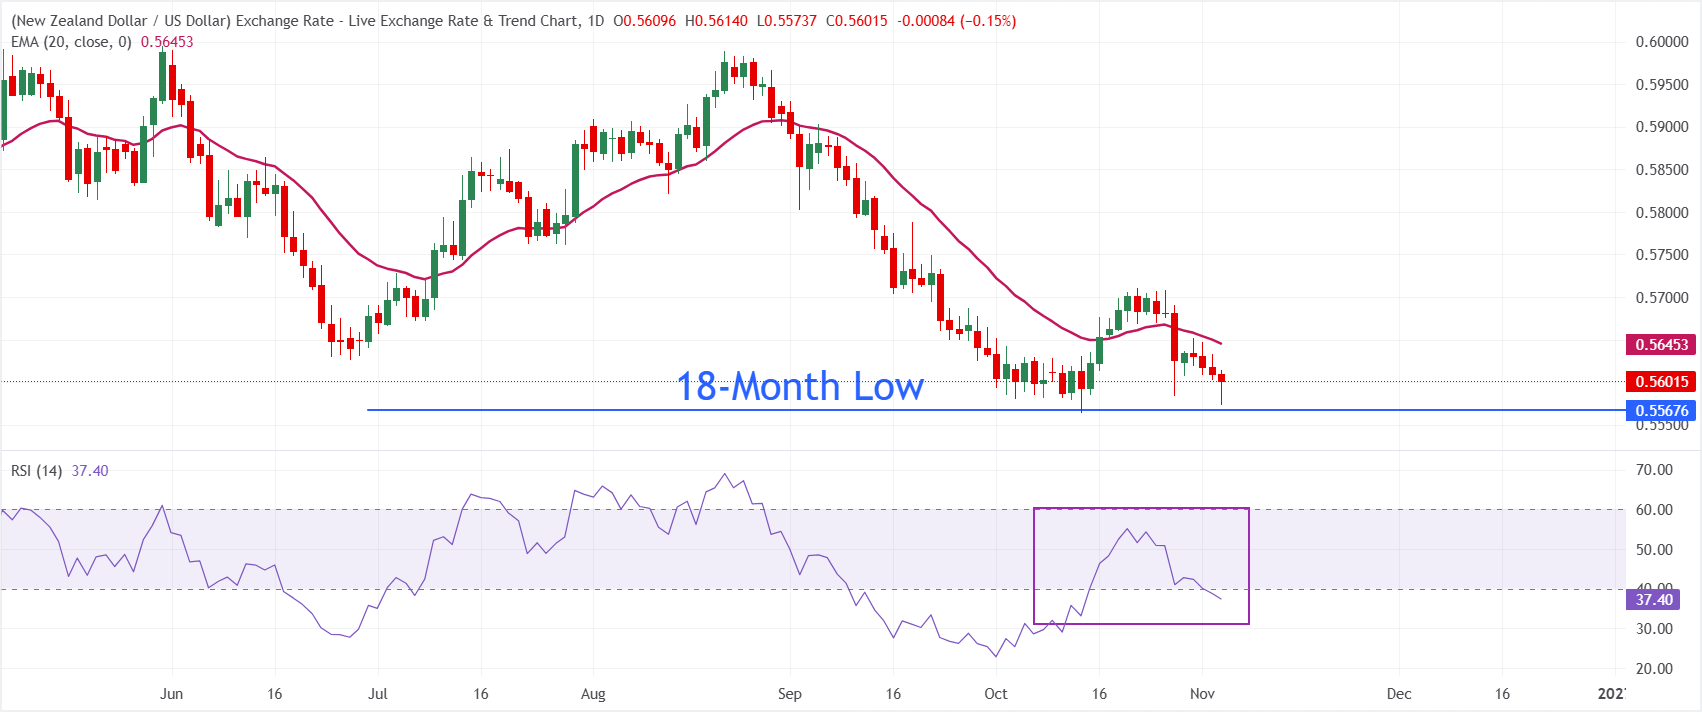
In the daily chart, NZD/USD trades at 0.5601, keeping a bearish near-term tone as spot remains below the 20-period exponential moving average (EMA) at 0.5645. The pair is capped by this short-term EMA, which hints that rebounds are likely to struggle while price holds under it, and the Relative Strength Index (RSI) at 37 reinforces persistent downside pressure without reaching oversold extremes.
On the topside, initial resistance is located at the 20-period EMA near 0.5645, and a sustained break above this barrier would be needed to ease the current bearish bias and allow a deeper recovery. Looking down, the 18-month low at 0.5564 is acting as key support for the pair. A decisive break below 0.5564 would expose the pair to 0.5500.
(The technical analysis of this story was written with the help of an AI tool. Know more.)
Economic Indicator
ADP Employment Change
The ADP Employment Change is a gauge of employment in the private sector released by the largest payroll processor in the US, Automatic Data Processing Inc. It measures the change in the number of people privately employed in the US. Generally speaking, a rise in the indicator has positive implications for consumer spending and is stimulative of economic growth. So a high reading is traditionally seen as bullish for the US Dollar (USD), while a low reading is seen as bearish.
Read more.Next release: Wed Nov 04, 2026 13:15
Frequency: Monthly
Consensus: 69K
Previous: 90K
Source: ADP Research Institute
Why it matters to traders?
Traders often consider employment figures from ADP, America’s largest payrolls provider, report as the harbinger of the Bureau of Labor Statistics release on Nonfarm Payrolls (usually published two days later), because of the correlation between the two. The overlaying of both series is quite high, but on individual months, the discrepancy can be substantial. Another reason FX traders follow this report is the same as with the NFP – a persistent vigorous growth in employment figures increases inflationary pressures, and with it, the likelihood that the Fed will raise interest rates. Actual figures beating consensus tend to be USD bullish.