


USD/JPY Price Forecasts: US Dollar shows hesitation below 157.20 area
- USD/JPY is struggling to return above a previous support level between 157.20 and 157.50.
- Investors are looking from the sidelines, awaiting interest rate decisions by the Fed and the BoJ later this week.
- On the downside, the support area above 156.00 is likely to hold bears ahead of central bank decisions.
The US Dollar (USD) ticks up against the Japanese Yen (JPY) at Monday’s European session open but, so far, remains capped below the bottom of the previous three-week trading range, with markets bidding their time ahead of key central bank decisions in the last half of the week. The USD/JPY pair has found support at the 156.00 level but is struggling to find significant acceptance beyond 157.00.
The Bank of Japan (BoJ) is expected to keep its benchmark interest rate on hold at 1.25% and hint at a further rate hike in December, sticking to a quarterly monetary tightening cycle, amid rising inflation pressures.
Before that, the Federal Reserve (Fed) is also expected to stand pat on rates, although Chair Kevin Warsh's distaste for forward guidance makes is likely to leave the central bank's rate path in a mist. In that case, the US Personal Consumption Expenditures (PCE) Price Index. due on Thursday is likely to be more clarifying regarding December's decision.
Technical Analysis: Rangebound movement below the 157.20 - 157.50 area
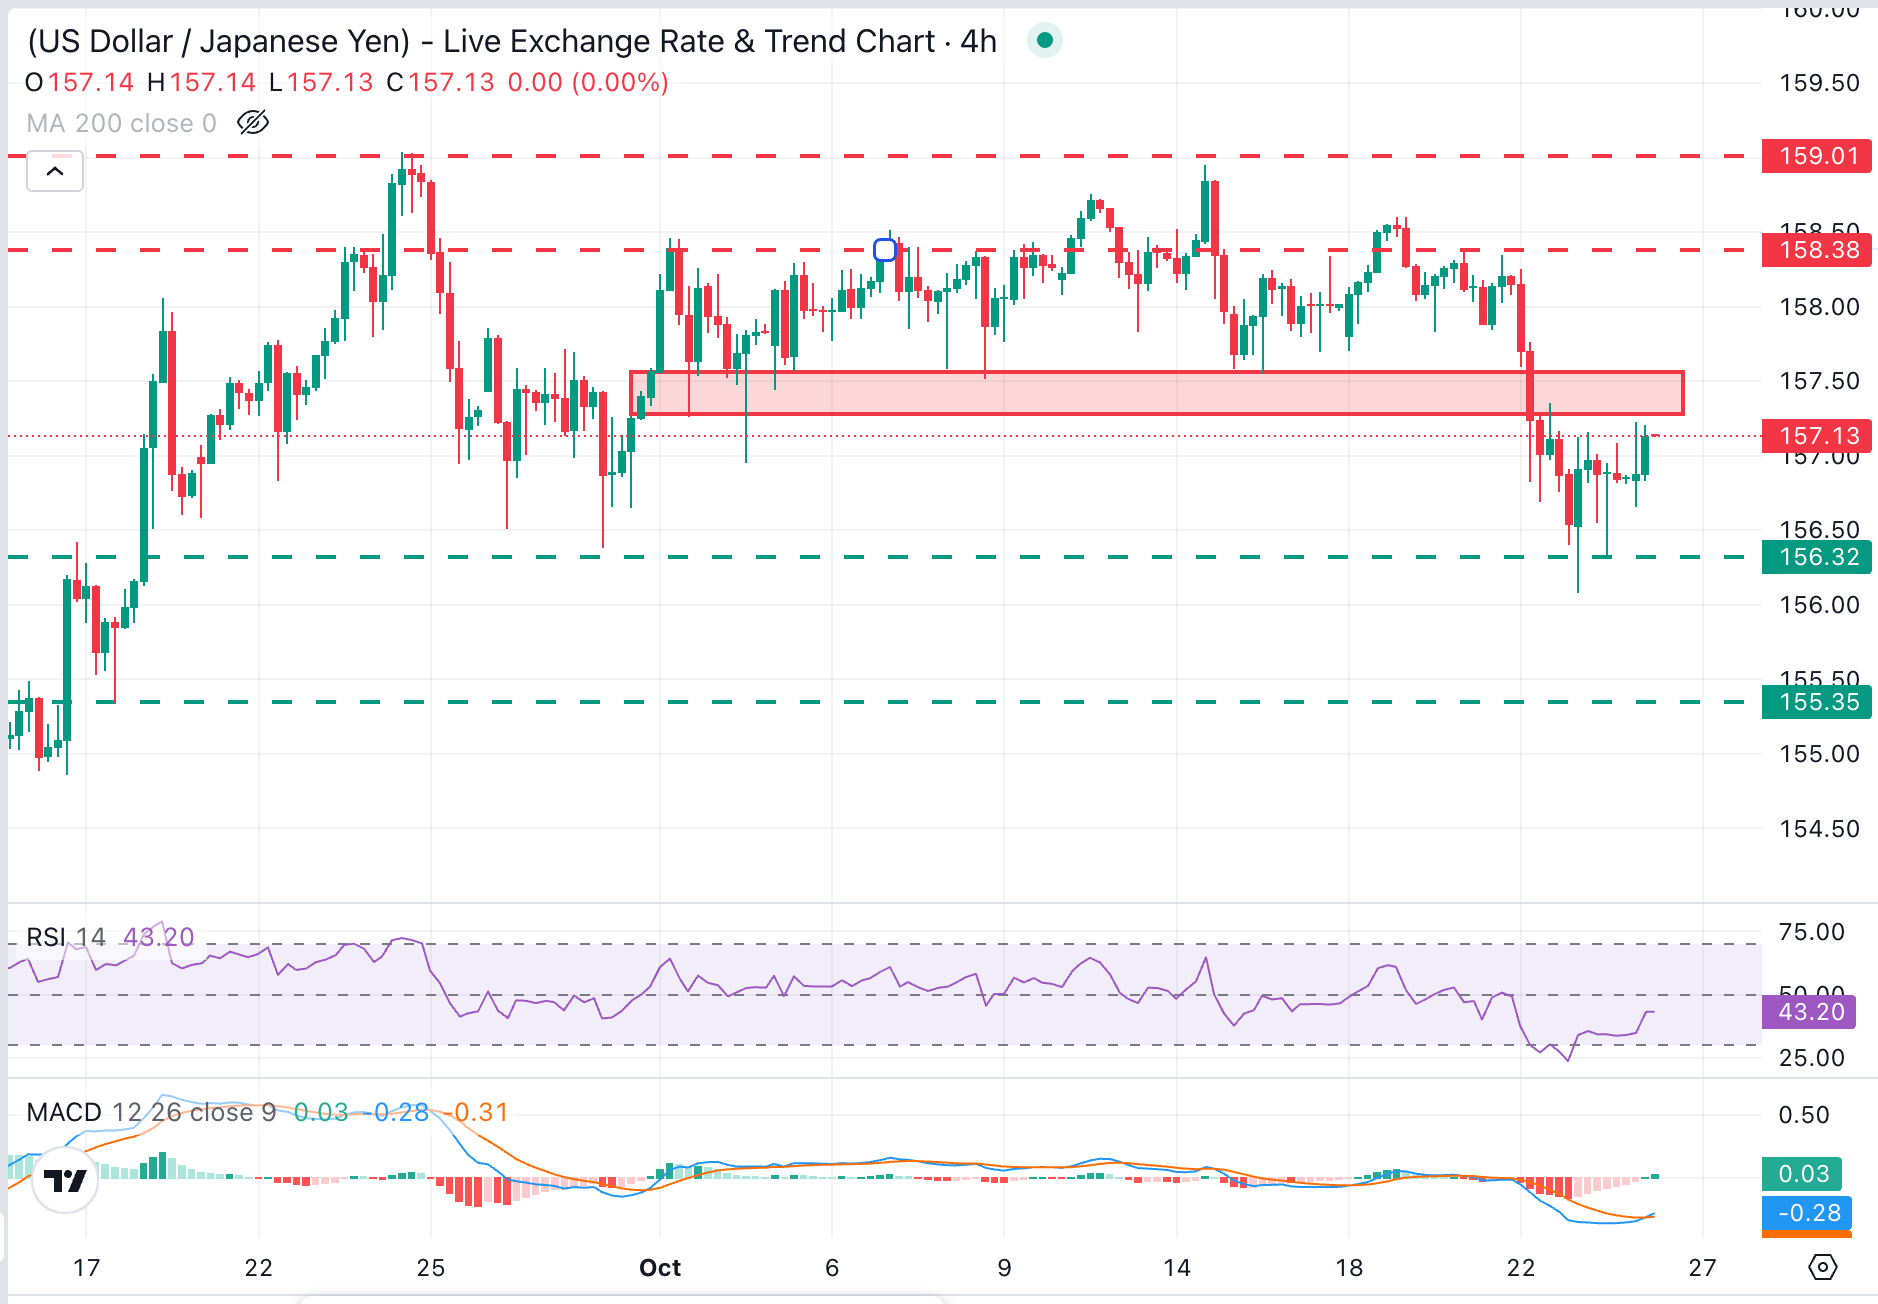
USD/JPY trades at 157.13, maintaining a frail recovery attempt, yet with momentum indicators on 4-hour charts highlighting a neutral market. The Relative Strength Index (14) has picked up to levels above the 40s, while the Moving Average Convergence Divergence (MACD) line is hovering, suggesting that the immediate bullish trend is still weak.
Upside attempts remain capped below a previous support area, roughly between 157.20 and 157.50, which held bears several times earlier in October. Further up, the October 21 high, at 158.40, and the top of the range, at the 159.00 area, would be the next targets.
On the downside, a clear breach of the 156.10 - 156.40 area. (September 29, October 23 lows) would open the way towards the September 17 low, at 155.35.
(The technical analysis of this story was written with the help of an AI tool. Know more.)
Japanese Yen Price Today
The table below shows the percentage change of Japanese Yen (JPY) against listed major currencies today. Japanese Yen was the strongest against the New Zealand Dollar.
| USD | EUR | GBP | JPY | CAD | AUD | NZD | CHF | |
|---|---|---|---|---|---|---|---|---|
| USD | -0.07% | 0.08% | 0.17% | 0.07% | 0.11% | 0.17% | -0.03% | |
| EUR | 0.07% | 0.18% | 0.23% | 0.13% | 0.19% | 0.25% | 0.05% | |
| GBP | -0.08% | -0.18% | 0.04% | -0.04% | 0.00% | 0.08% | -0.14% | |
| JPY | -0.17% | -0.23% | -0.04% | -0.08% | -0.06% | 0.00% | -0.20% | |
| CAD | -0.07% | -0.13% | 0.04% | 0.08% | 0.01% | 0.11% | -0.10% | |
| AUD | -0.11% | -0.19% | -0.01% | 0.06% | -0.01% | 0.07% | -0.13% | |
| NZD | -0.17% | -0.25% | -0.08% | -0.01% | -0.11% | -0.07% | -0.20% | |
| CHF | 0.03% | -0.05% | 0.14% | 0.20% | 0.10% | 0.13% | 0.20% |
The heat map shows percentage changes of major currencies against each other. The base currency is picked from the left column, while the quote currency is picked from the top row. For example, if you pick the Japanese Yen from the left column and move along the horizontal line to the US Dollar, the percentage change displayed in the box will represent JPY (base)/USD (quote).