






OANDA and MyTrader
App Suite from FX Blue
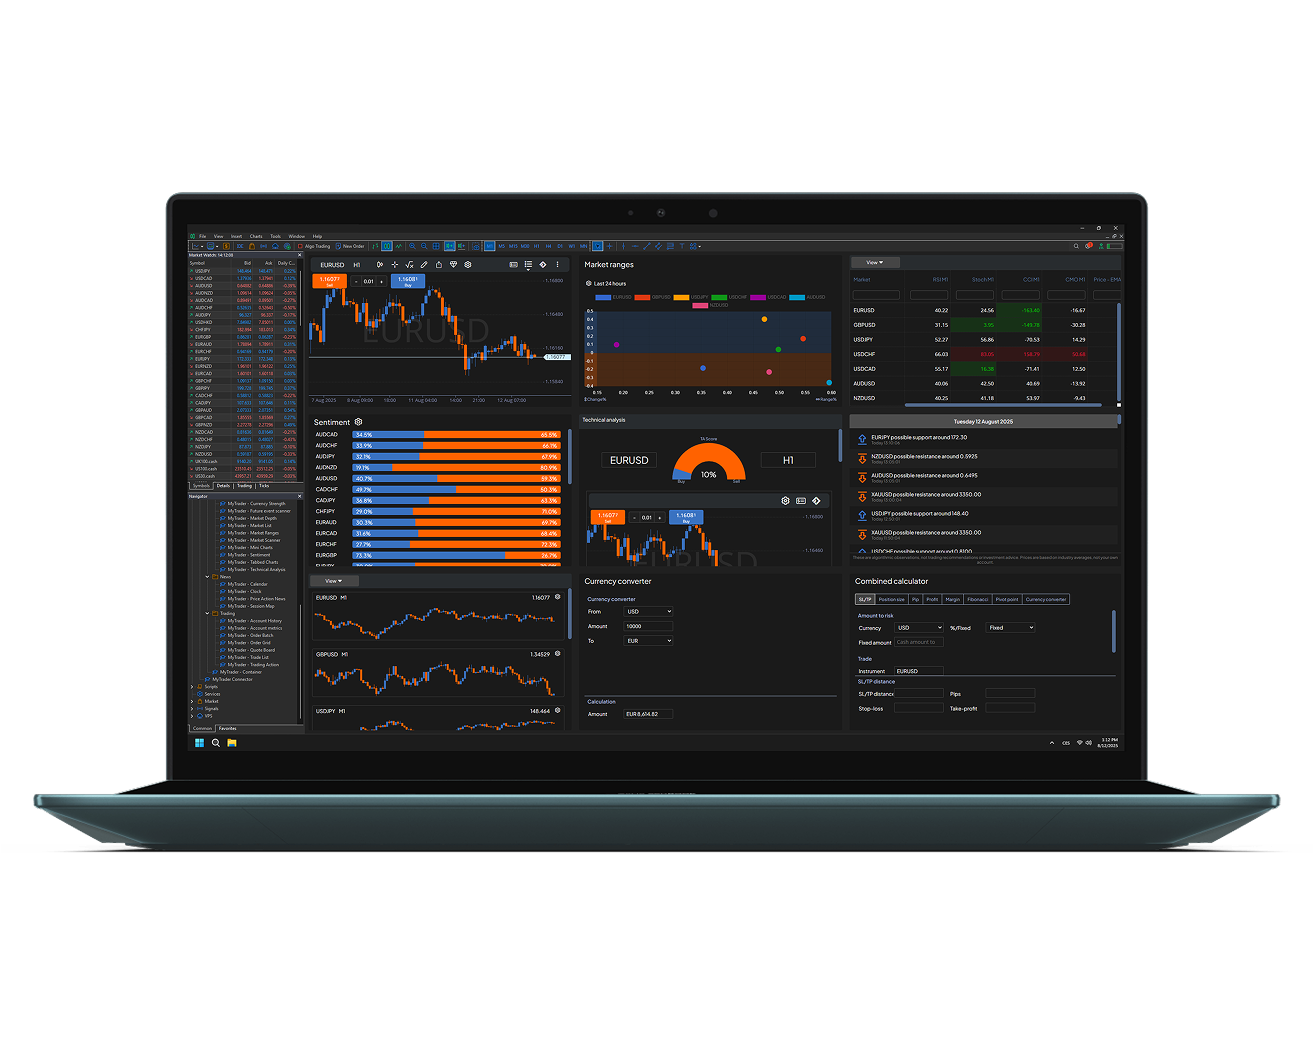
35+ tools and indicators for MetaTrader 5
Dominate the markets. Transform your MT5 into a
professional trading station. Make faster and more
accurate decisions, maximizing every market opportunity.
Invest Smarter
MyTrader App Suite is a package of professional tools that extends the standard features of MetaTrader 5. Discover tools from FX Blue, available to OANDA clients.

35+ Advanced Tools
A comprehensive suite featuring 35 advanced indicators and automated strategies (Expert Advisors) for the MetaTrader platform. It was compiled for investors who want to reach a higher level of efficiency.

Faster & More Accurate Decisions
The App Suite is a unique combination of advanced market analytics and a clean interface. This grants you the ability to react instantly to price changes and make more accurate decisions without leaving the platform's main window.

Maximize Every Market Opportunity
Gain an edge in the market and effectively react to trading opportunities. The extensive features of the FX Blue suite refine the trading process so you can always be one step ahead of others.

Create Custom Indicators & Trade Widgets with Claude.ai
Build your own indicators, trade widgets, and automated strategies using Claude.ai. Simply describe what you need in plain English, copy the generated code, and paste it into MyTrader – Chart or Container App to make it immediately available on your platform.
What the App Suite Includes
The App Suite tools are designed to facilitate precise market trend analysis, improve your trading strategies, and ensure maximum efficiency in managing open positions.

Chart
Trade and analyze with a powerful charting tool packed with indicators and drawing tools.

Currency Strenght
Visualize currency strength across timeframes and highlight dominant pairs.

Mini charts
Keep an eye on multiple markets using compact, customizable charts.

AI Custom Builder (Claude.ai)
Create custom indicators and trading widgets by describing them in plain English.

Future Events Scanner
Detect breakouts, trend shifts, and key price behaviours before they happen.

Fibonacci Calculator
Identify key retracement and extension levels for optimized entries and exits.

Excel RTD
Seamlessly stream real-time trading data and execute trades directly from Microsoft Excel.

Economic Calendar
Monitor real-time economic events with impact-based filtering.

Currency Heat Map
Track currency strength over the past 24 hours and spot high-volatility pairs.

Currency Converter
Convert currencies with precision – including direct and cross rate conversions.

Correlation Matrix
Understand asset correlations to better manage diversification and risk exposure.
Container
Create your ideal workspace with fully customizable widgets.

Combined Calculator
Access all major trading calculators from one central hub.

Clock
Stay on time with a built-in market clock – ideal for news and session tracking.

Alarm Manager
Stay ahead with fully customisable alerts – never miss a trading signal again!

Account Metrics
Track essential stats like equity, margin usage, and more – all in one place.

Account History
Assess your trading performance with clear and detailed metrics.

Trading Action
Manage trades efficiently with smart order tools and real-time profit tracking.

Trade List
Control your trades using a clean "Grid" or "Card" view – everything in one place.

Technical Analysis
Receive straightforward buy/sell ratings powered by advanced technical indicators.

Tabbed Chart
Monitor multiple markets within a single, intuitive interface.

SL/TP Calculator
Set stop-loss and take-profit levels accurately by amount or risk percentage.

Session Map
Visualize global market sessions and tailor your trading strategy accordingly.

Quote Board
Manage trades with live pricing and advanced order features in one interface.

Profit Calculator
Estimate potential profits or losses in both pip and monetary terms.

Price Action News
Track critical price moves and key levels as they unfold in real time.

Position Size Calculator
Find the ideal position size based on your risk appetite and stop-loss placement.

Pivot Point Calculator
Determine pivot, support, and resistance levels for accurate intraday strategies.

Pip Calculator
Precisely calculate the value of one pip to manage risk and maximize potential gains.

Order Grid
Easily configure pending orders with fixed spacing and volume settings.

Order Batch
Send multiple orders at once with unified stop-loss and take-profit settings.

Market Scanner
Instant access to key indicators for smarter risk and trade management.

Market Ranges
Analyze price ranges and volatility to anticipate market breakouts or reversals.

Market List
Access comprehensive contract specifications, swap rates, and critical details for all instruments.

Margin Calculator
Calculate required margin based on your lot size and account currency.
Start Using MyTrader App Suite
As an OANDA client, you receive the full suite of tools absolutely free. Installation in four steps:

Log in to your account or create an account

Download the App Suite installer from FX Blue dedicated to the MetaTrader 5 platform. The package is completely free for all OANDA clients.

Run the installer: Open the downloaded file and follow the on-screen instructions.

Activate the tools on the MT5 platform: Restart the platform, find the newly added tools from the App Suite in the "Navigator" window, and then simply drag and drop the chosen ones onto a chart to start working.
Deeper insight into tools

Mini Charts - a multi-market overview in a single panel
- Multi-Market Overview
Monitor multiple instruments simultaneously thanks to a compact layout. Stay up-to-date with market opportunities without having to switch your main charts and lose broader analytical context. - Fully Customisable Layout
Seamlessly switch between watchlists and adjust timeframes for one or all charts at the same time. Choose your preferred style – line, candlestick, or bar chart – to speed up visual market verification.
- Built-In Technical Indicators
Overlay moving averages, Keltner Channels, or the Parabolic SAR indicator directly onto mini charts. Identify trends and key price levels without needing to open extra windows or indicator dialog boxes. - Saving Configurations
Save your custom indicator settings and chart styles so your preferred workspace loads automatically every time you launch the platform. Maintain optimal workflow without the hassle of manual reconfiguration during every session. - Integration with Other Tools
Combine Mini Charts with the Market Scanner or Fibonacci Calculator to cross-verify signals.

Calculators- all necessary calculations in one place
- Core Trade Calculations:
Swiftly calculate pip value, required margin, and potential profit or loss. Input position size, entry and exit levels, and the leverage used to instantly obtain precise financial data for each trade. - Risk Management Tools:
Plan your positions with complete confidence using the Stop-Loss and Take-Profit Calculator. Define your acceptable risk as a specific cash amount or a percentage of your account equity, and the system will automatically determine optimized defensive levels.
- Fibonacci Levels and Pivot Points Calculators:
Use the Fibonacci calculator to precisely determine retracement and extension levels. Meanwhile, the Pivot Points calculator allows you to quickly generate support and resistance zones according to your preferred methodology. - Live Currency Conversion:
The built-in converter delivers up-to-date exchange rates required for cross-rate calculations. You no longer need to leave the platform or search for external tools during an active market session. - Multi-functional Calculator:
All the most important calculations gathered in one tab – pip value, margin, SL/TP, Fibonacci levels, and currency conversion. Focus solely on trading and analysis instead of switching between multiple windows.

Currency Strength - quickly recognize trend direction changes at a glance
- Real-time Strength Rankings:
Observe instant breakdowns of the strongest and weakest currencies through a clear visual format. Stay up-to-date with current momentum for all major and minor currency pairs. - Customizable Base Currency:
Set your preferred base currency to analyze all relative strengths from a single, consistent reference point. This ensures stability when comparing pairs and minimizes the risk of misinterpreting opposing signals.
- Multi-timeframe Analysis:
Switch seamlessly between timeframes to assess both short- and long-term currency strength dynamics. This solution works perfectly for both day trading and swing trading approaches that require a broader market context. - Visual Heatmaps and Bar Charts:
Color-coded heatmaps and dynamic bars let you instantly spot shifts in relative market strength. You no longer have to analyze each pair individually to identify the most volatile instruments. - Integration with Other Tools:
Combine currency strength readings with the Sentiment Indicator and Mini Charts. This allows you to build a more complete picture of market conditions before deciding to open a position.

Account History- an in-depth analysis of your trading performance
- Balance and Equity Chart:
Track changes in your account balance over time using an interactive line chart. Instantly identify periods of drawdown, growth phases, and deposit/withdrawal patterns within any custom date range. - Profit Breakdown by Instrument:
See which trades and markets delivered your best and worst results using clear bar charts and detailed summaries. Pinpoint exactly where your strategy holds the greatest market edge, and which areas require optimization.
- Position Structure (Buy/Sell) and Duration:
Analyze the distribution and effectiveness of long and short positions based on how long they were held. Utilize visual trade-duration breakdowns to evaluate whether your system performs better in a short- or long-term approach. - Win Rate and Duration Impact:
Verify your win rate with color-coded charts. Use scatter plots illustrating the relationship between position duration and generated profit to uncover hidden patterns across various markets and timeframes that get lost in raw data analysis. - Detailed Periodic Data:
Access full trading metrics on a daily, weekly, monthly, or yearly basis. Combine raw operational logs with advanced analytics to identify repetitive trading habits – both those that build your capital and those that expose you to losses.

Container- build your optimal workspace
- Fully Customizable Layouts:
Design your own trading environment using a wide array of available structures. Arrange your tools so they precisely match your strategy, keeping them instantly accessible throughout the market session. - Intuitive Widget Management:
Add new applications by clicking on empty spaces and freely resize panels by dragging their edges. Every interface element is optimized for smooth operation, which is critical during dynamic price movements.
- Market and Timeframe Synchronization:
Link different panels together so that changing the analyzed instrument in one window automatically updates data across all connected modules. This eliminates the need for tedious manual configuration of each individual widget. - Instant Editing:
Double-click to modify layout settings or update market links in a fraction of a second. This keeps your investment dashboard flexible and ready to adapt instantly to changing conditions throughout the day. - Seamless Module Replacement:
Replace any widget with a new one without disrupting the structure of the overall layout. Switch freely between different configurations while maintaining a personalized, uncluttered, and highly efficient analytical environment in any situation.
AI Custom Tools- build custom indicators and widgets using plain English
- User-Defined Indicators (UDI):
Prompt Claude.ai to write custom scripts (e.g., Fair Value Gaps, Liquidity Levels, ICT strategies) and paste the code directly into the Chart app. - Trade Widgets:
Generate custom trading tools (e.g., daily P&L trackers, news-blocking widgets, breakout algos) and enable execution via the UDI+framework mode.
Explore our quick video guides
Do you want to upgrade your investment tools?
The App Suite is provided completely free of charge for every live and demo account at OANDA. Download it now and install it in just a few minutes – no extra fees.
FAQ
- What exactly is MyTrader App Suite?
It is a package of over 30 advanced tools and indicators created by FX Blue. It works as an extension (plugin) that you install on the MetaTrader platform to gain automated risk management features, advanced order types, and deeper analytics.
- Is using the FX Blue suite completely free?
Yes. For all OANDA clients the entire suite is free.
- Can I test this suite on a Demo account?
Yes. The App Suite is provided completely free of charge for every live and demo account at OANDA.
- Which platforms does the suite work with?
The tools are fully compatible with the MetaTrader 5 (MT5) platform.
- What does the installation look like?
You download a single installation file and run it. The installer will automatically detect your MT5 platform and add all the features to it in a matter of seconds.


