【MQL編程基礎】|確認趨勢線上價格誤差的方法
1.製作檔案雛形並設定前綴
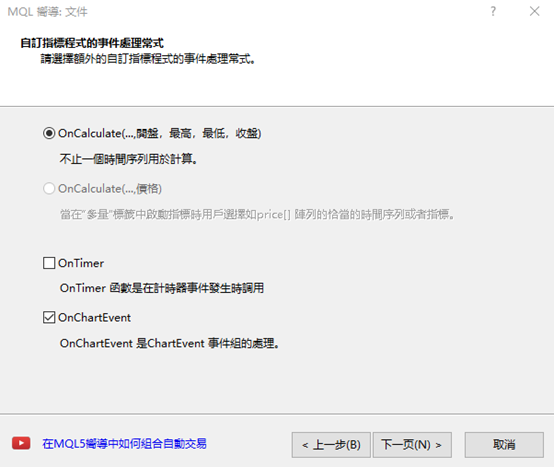
在本篇文章中,將說明如何確認趨勢線上,因時間週期不同而產生的價格變化。雖然多以斜向繪製趨勢線,但若在相異的時間週期上同樣以斜向繪製,便會依時間週期而出現價格偏差。為了想像該畫面,可製作在目前K線上顯示趨勢線價格的工具,藉此確認因時間條列不同而產生的價格偏差。首先,在製作新檔案處選擇「自訂指標」,檔案名稱設定為「PriceTag」。在「自訂指標程式的事件處理常式」畫面中勾選「OnChartEvent」,並在下一步點擊「完成」即是雛形。
由於本次將使用物件,因此要在檔案上方的屬性「#property indicator_chart_window」之下定義前綴「PREFIX」。此動作是為了能夠一次刪除製作的物件。
#define PREFIX “PriceTag_”然後在「Custom indicator initialization function」下方設定「Custom indicator deinitialization function」,寫入使用OnDeinit函數時的以下編碼。這是為了把指標從圖表刪除時可以讓相關物件同時消失。
void OnDeinit(const int reason)
{
ObjectsDeleteAll(0, PREFIX);
}
2.製作可搜尋趨勢線並顯示價格的函數
接下來,將製作可於找到趨勢線時顯示價格的「DrawTag()」函數。如欲使DrawTag()隨著波動更新而動作,便需在OnCalculate函數內的「//— return value of prev_calculated for next call」上方設定執行。int OnCalculate(const int rates_total,另外,將在移動趨勢線時執行DrawTag()的動作。在OnChartEvent函數內新增兩個if文體。「CHARTEVENT_OBJECT_DRAG」為能夠顯示游標拖曳的圖表程序,當物件被拖曳(被移動)時,其類型若為趨勢線,便會開始執行DrawTag()。
const int prev_calculated,
const datetime &time[],
const double &open[],
const double &high[],
const double &low[],
const double &close[],
const long &tick_volume[],
const long &volume[],
const int &spread[])
{
//—
DrawTag();
//— return value of prev_calculated for next call
return(rates_total);
}
void OnChartEvent(const int id,
const long &lparam,
const double &dparam,
const string &sparam)
{
//—
if (id == CHARTEVENT_OBJECT_DRAG) {
if (ObjectGetInteger(0, sparam, OBJPROP_TYPE) == OBJ_TREND) DrawTag();
}
}
3.取得指定位置的價格資訊
在前述文章中,製作了可於找到趨勢線時顯示價格的「DrawTag()」函數,並設定了啟動的條件。其次,將寫入DrawTag()的內容。在「ChartEvent function」下方設定「Draw tag function」,並於該處寫入編碼。以for文體搜尋所有物件,若為趨勢線,便會以「ObjectGetValueByShift」取得指定位置的價格資訊。ObjectGetValueByShift為函數,其可透過目標物件的座標,因應指定K線的移動次數取得價格。
void DrawTag()
{
for (int i = 0; i < ObjectsTotal(0, -1); i++) {
string name = ObjectName(0, i);
if (ObjectGetInteger(0, name, OBJPROP_TYPE) == OBJ_TREND) {
double price = ObjectGetValueByShift(name, 0);
}
}
4.修改Arrow元件的範例編碼
本次將以Arrow 物件顯示ObjectGetValueByShift取得的價格資訊。可從MQL4幫阻擋中,複製Arrow元件的範例編碼。於MQL4相關參考目錄中點選「Constants, Enumerations and Structures」→「Objects Constants」→「Object Types」,便會顯示物件一覽表。從中選擇「OBJ_ARROW」,並將預先準備的「Create the arrow」編碼複製貼上於檔案的下方。自「//— set anchor point coordinates if they are not set」至「ResetLastError();」的4行,以及「Print(__FUNCTION__,」「”: failed to create an arrow! Error code = “, GetLastError());」等2行皆不需使用,故可予以刪除。
為了使位置隨著數值而變化,在「if(!ObjectCreate(chart_ID, name, OBJ_ARROW, sub_window, time, price)) {」下方新增「ObjectSetInteger(chart_ID, name, OBJPROP_TIME, 0, time);」與「ObjectSetDouble(chart_ID, name, OBJPROP_PRICE, 0, price);」等2行,並寫入時間與價格資訊。
此外,也應預先變更初始設定。將「// arrow code」的「arrow_code = 252」變更為「arrow_code = 6」,「// arrow color」的「clr = clrRed」變更為「clr = clrWhite」,「// arrow size」的「width = 3」變更為「width = 5」,「// highlight to move」的「selection = true」變更為「selection = false」。如此便完成了Arrow物件的設定。
//+——————————————————————+
//| Create the arrow |
//+——————————————————————+
bool ArrowCreate(const long chart_ID = 0, // chart’s ID
const string name = “Arrow”, // arrow name
const int sub_window = 0, // subwindow index
datetime time = 0, // anchor point time
double price = 0, // anchor point price
const uchar arrow_code = 6, // arrow code
const ENUM_ARROW_ANCHOR anchor = ANCHOR_BOTTOM, // anchor point position
const color clr = clrWhite, // arrow color
const ENUM_LINE_STYLE style = STYLE_SOLID, // border line style
const int width = 5, // arrow size
const bool back = false, // in the background
const bool selection = false, // highlight to move
const bool hidden = true, // hidden in the object list
const long z_order = 0) // priority for mouse click
{
//— create an arrow
if(!ObjectCreate(chart_ID, name, OBJ_ARROW, sub_window, time, price)) {
ObjectSetInteger(chart_ID, name, OBJPROP_TIME, 0, time);
ObjectSetDouble(chart_ID, name, OBJPROP_PRICE, 0, price);
return(false);
}
//— set the arrow code
ObjectSetInteger(chart_ID, name, OBJPROP_ARROWCODE, arrow_code);
//— set anchor type
ObjectSetInteger(chart_ID, name, OBJPROP_ANCHOR, anchor);
//— set the arrow color
ObjectSetInteger(chart_ID, name, OBJPROP_COLOR, clr);
//— set the border line style
ObjectSetInteger(chart_ID, name, OBJPROP_STYLE, style);
//— set the arrow’s size
ObjectSetInteger(chart_ID, name, OBJPROP_WIDTH, width);
//— display in the foreground (false) or background (true)
ObjectSetInteger(chart_ID, name, OBJPROP_BACK, back);
//— enable (true) or disable (false) the mode of moving the arrow by mouse
//— when creating a graphical object using ObjectCreate function, the object cannot be
//— highlighted and moved by default. Inside this method, selection parameter
//— is true by default making it possible to highlight and move the object
ObjectSetInteger(chart_ID, name, OBJPROP_SELECTABLE, selection);
ObjectSetInteger(chart_ID, name, OBJPROP_SELECTED, selection);
//— hide (true) or display (false) graphical object name in the object list
ObjectSetInteger(chart_ID, name, OBJPROP_HIDDEN, hidden);
//— set the priority for receiving the event of a mouse click in the chart
ObjectSetInteger(chart_ID, name, OBJPROP_ZORDER, z_order);
//— successful execution
return(true);
}
5.以Arrow物件顯示價格資訊
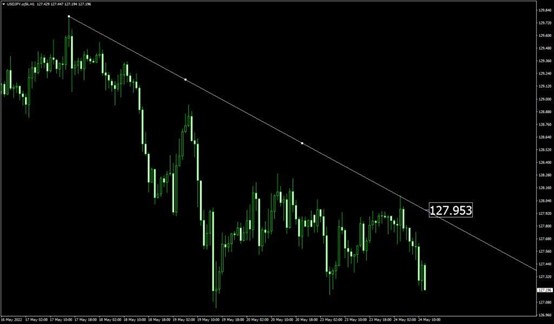
上述文章中,修改了用於顯示價格的Arrow物件範例編碼,使其成為可供運用的狀態。接下來,將使用以DrawTag()設定的ArrowCreate,藉此顯示目前K線的趨勢線價格。在DrawTag()內的「double price = ObjectGetValueByShift(name, 0);」下方新增下列編碼。圖表ID設定為「0」、名稱為「PREFIX + name」、視窗分頁為「0」,時間則是目前時間的「Time[0]」、價格為「price」。
ArrowCreate(0, PREFIX + name, 0, Time[0], price);如此進行編譯並設定圖表,就會顯示目前K線的趨勢線價格。
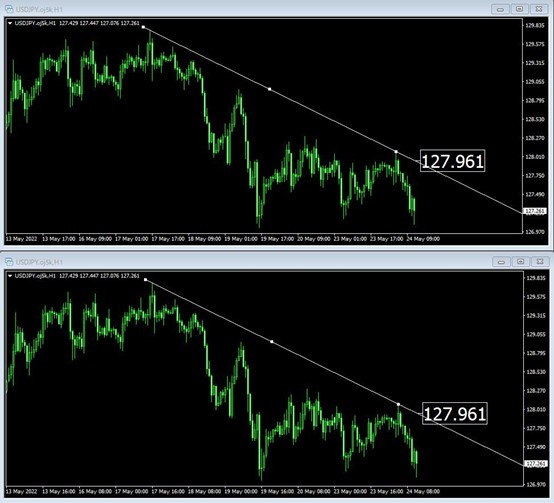
6.利用同步的2張圖表比較誤差
本次為了便於比較,將2張圖表並列以確認價額偏差。「TrendlineSync」是在「在複數圖表上同步趨勢線的方法」文章中所製作的趨勢線同步工具,此處將比較透過此工具所設定的2張圖表。上下的圖表皆以1小時週期顯示,故在此狀態之下,兩者皆顯示相同的「127.961」價格。
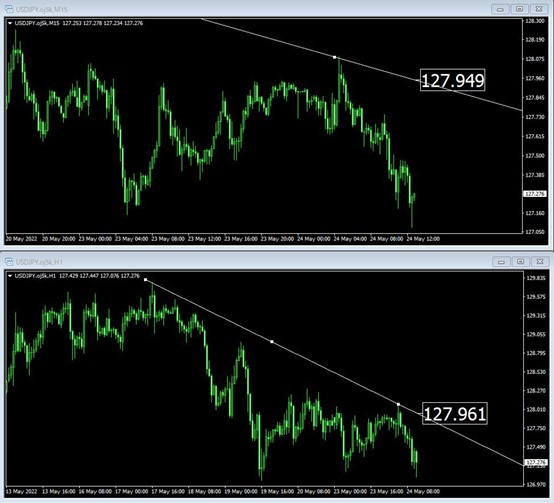
嘗試將上方圖表的時間週期變更為15分鐘。如此一來,可以見到價格顯示變成「127.949」,出現了2pips程度的偏差。相對於上一級別時間週期的1根K線,在下一級別時間週期中則具有多根K線,故會因為精密度不同而產生這樣的誤差。趨勢線的角度越大,則誤差也會隨之增加。在多週期框架中,如欲變更時間軸來運用趨勢線,便務必留意此類價格誤差。
7.原始碼
本次製作的原始碼如以下所示。//+——————————————————————+
//| PriceTag.mq4 |
//| Copyright 2022, MetaQuotes Software Corp. |
//| https://www.mql5.com |
//+——————————————————————+
#property copyright “Copyright 2022, MetaQuotes Software Corp.”
#property link “https://www.mql5.com”
#property version “1.00”
#property strict
#property indicator_chart_window
#define PREFIX “PriceTag_”
//+——————————————————————+
//| Custom indicator initialization function |
//+——————————————————————+
int OnInit()
{
//— indicator buffers mapping
//—
return(INIT_SUCCEEDED);
}
//+——————————————————————+
//| Custom indicator deinitialization function |
//+——————————————————————+
void OnDeinit(const int reason)
{
ObjectsDeleteAll(0, PREFIX);
}
//+——————————————————————+
//| Custom indicator iteration function |
//+——————————————————————+
int OnCalculate(const int rates_total,
const int prev_calculated,
const datetime &time[],
const double &open[],
const double &high[],
const double &low[],
const double &close[],
const long &tick_volume[],
const long &volume[],
const int &spread[])
{
//—
DrawTag();
//— return value of prev_calculated for next call
return(rates_total);
}
//+——————————————————————+
//| ChartEvent function |
//+——————————————————————+
void OnChartEvent(const int id,
const long &lparam,
const double &dparam,
const string &sparam)
{
//—
if (id == CHARTEVENT_OBJECT_DRAG) {
if (ObjectGetInteger(0, sparam, OBJPROP_TYPE) == OBJ_TREND) DrawTag();
}
}
//+——————————————————————+
//| Draw tag function |
//+——————————————————————+
void DrawTag()
{
for (int i = 0; i < ObjectsTotal(0, -1); i++) {
string name = ObjectName(0, i);
if (ObjectGetInteger(0, name, OBJPROP_TYPE) == OBJ_TREND) {
double price = ObjectGetValueByShift(name, 0);
ArrowCreate(0, PREFIX + name, 0, Time[0], price);
}
}
}
//+——————————————————————+
//| Create the arrow |
//+——————————————————————+
bool ArrowCreate(const long chart_ID = 0, // chart’s ID
const string name = “Arrow”, // arrow name
const int sub_window = 0, // subwindow index
datetime time = 0, // anchor point time
double price = 0, // anchor point price
const uchar arrow_code = 6, // arrow code
const ENUM_ARROW_ANCHOR anchor = ANCHOR_BOTTOM, // anchor point position
const color clr = clrWhite, // arrow color
const ENUM_LINE_STYLE style = STYLE_SOLID, // border line style
const int width = 5, // arrow size
const bool back = false, // in the background
const bool selection = false, // highlight to move
const bool hidden = true, // hidden in the object list
const long z_order = 0) // priority for mouse click
{
//— create an arrow
if(!ObjectCreate(chart_ID, name, OBJ_ARROW, sub_window, time, price)) {
ObjectSetInteger(chart_ID, name, OBJPROP_TIME, 0, time);
ObjectSetDouble(chart_ID, name, OBJPROP_PRICE, 0, price);
return(false);
}
//— set the arrow code
ObjectSetInteger(chart_ID, name, OBJPROP_ARROWCODE, arrow_code);
//— set anchor type
ObjectSetInteger(chart_ID, name, OBJPROP_ANCHOR, anchor);
//— set the arrow color
ObjectSetInteger(chart_ID, name, OBJPROP_COLOR, clr);
//— set the border line style
ObjectSetInteger(chart_ID, name, OBJPROP_STYLE, style);
//— set the arrow’s size
ObjectSetInteger(chart_ID, name, OBJPROP_WIDTH, width);
//— display in the foreground (false) or background (true)
ObjectSetInteger(chart_ID, name, OBJPROP_BACK, back);
//— enable (true) or disable (false) the mode of moving the arrow by mouse
//— when creating a graphical object using ObjectCreate function, the object cannot be
//— highlighted and moved by default. Inside this method, selection parameter
//— is true by default making it possible to highlight and move the object
ObjectSetInteger(chart_ID, name, OBJPROP_SELECTABLE, selection);
ObjectSetInteger(chart_ID, name, OBJPROP_SELECTED, selection);
//— hide (true) or display (false) graphical object name in the object list
ObjectSetInteger(chart_ID, name, OBJPROP_HIDDEN, hidden);
//— set the priority for receiving the event of a mouse click in the chart
ObjectSetInteger(chart_ID, name, OBJPROP_ZORDER, z_order);
//— successful execution
return(true);
}
將EA自動程式交易應用於外匯與差價合約交易中

我們以圖文形式詳細介紹有關EA自動程式交易的基本知識,以及在MT4/MT5平台上的安裝、參數設定方法、編碼等等內容。另外,對持有OANDA帳戶的客戶,還可以免費使用我們的獨有EA與指標工具。