在複數圖表中同步趨勢線圖式的方法
檢測物件的新增與刪除
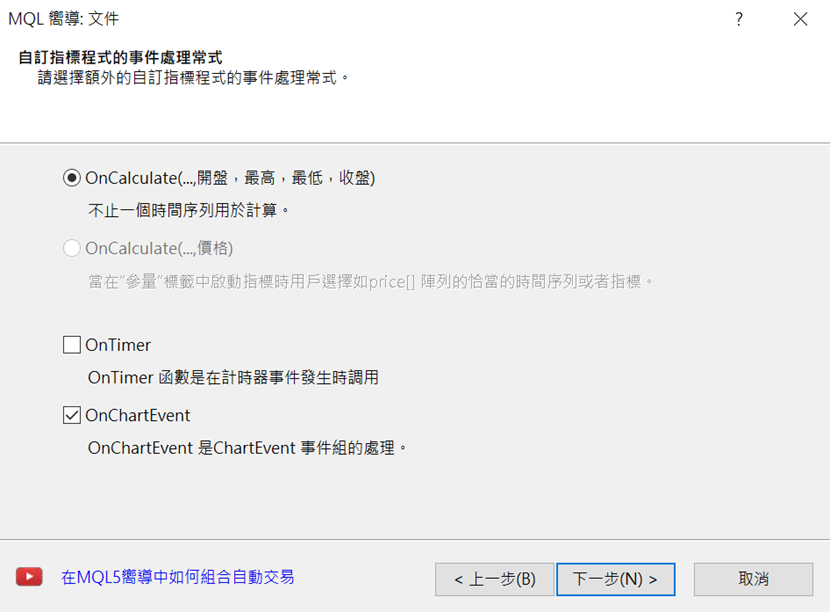
在本篇章節中,將介紹在複數圖表中同步趨勢線的方法。具體來說,便是在設定指標的圖表中製作新趨勢線時,於其他圖表產生相同的繪製動作。首先在製作新檔案中選擇「自訂指標」,並將檔案名稱設定為「TrendlineSync」,無需新增參數即可移至下一步;在「自訂指標程式的的事件處理常式」中勾選「OnChartEvent」,點擊「完成」即可呈現雛形。
因為想要在製作新趨勢線時予以同步,所以需要在OnInit函數下設置圖表屬性的ChartSetInteger函數中先行宣告「CHART_EVENT_OBJECT_CREATE」。另外,為了當趨勢線遭到刪除時能夠檢測,亦須設定「CHART_EVENT_OBJECT_DELETE」。
ChartSetInteger(0, CHART_EVENT_OBJECT_CREATE, true);
ChartSetInteger(0, CHART_EVENT_OBJECT_DELETE, true);
複製並運用「OBJ_TREND」的樣本編碼
接下來,將在OnChartEvent函數下,寫入當圖表中發生事件時予以處理的if文體。首先是「CHART_EVENT_OBJECT_CREATE」;只要新增的物件為趨勢線,便會取得該趨勢線的資訊並加以同步。if (id == CHARTEVENT_OBJECT_CREATE) {在此if文體中追加趨勢線的相關編碼。此處複製並使用MQL4幫助檔中的樣本編碼;在MQL4幫助檔目錄中,點擊「Constants, Enumerations and Structures」→「Objects Constants」→「Object Types」便會出現物件一覽,從中選擇「OBJ_TREND」之後,複製並貼上預先準備的下列編碼。
if (ObjectGetInteger(0, sparam, OBJPROP_TYPE) == OBJ_TREND) {
}
}
//+——————————————————————+複製後,可以刪除以下不需要的9行。
//| Create a trend line by the given coordinates |
//+——————————————————————+
bool TrendCreate(const long chart_ID=0, // chart’s ID
const string name=”TrendLine”, // line name
const int sub_window=0, // subwindow index
datetime time1=0, // first point time
double price1=0, // first point price
datetime time2=0, // second point time
double price2=0, // second point price
const color clr=clrRed, // line color
const ENUM_LINE_STYLE style=STYLE_SOLID, // line style
const int width=1, // line width
const bool back=false, // in the background
const bool selection=true, // highlight to move
const bool ray_right=false, // line’s continuation to the right
const bool hidden=true, // hidden in the object list
const long z_order=0) // priority for mouse click
{
//— set anchor points’ coordinates if they are not set
ChangeTrendEmptyPoints(time1,price1,time2,price2);
//— reset the error value
ResetLastError();
//— create a trend line by the given coordinates
if(!ObjectCreate(chart_ID,name,OBJ_TREND,sub_window,time1,price1,time2,price2))
{
Print(__FUNCTION__,
“: failed to create a trend line! Error code = “,GetLastError());
return(false);
}
//— set line color
ObjectSetInteger(chart_ID,name,OBJPROP_COLOR,clr);
//— set line display style
ObjectSetInteger(chart_ID,name,OBJPROP_STYLE,style);
//— set line width
ObjectSetInteger(chart_ID,name,OBJPROP_WIDTH,width);
//— display in the foreground (false) or background (true)
ObjectSetInteger(chart_ID,name,OBJPROP_BACK,back);
//— enable (true) or disable (false) the mode of moving the line by mouse
//— when creating a graphical object using ObjectCreate function, the object cannot be
//— highlighted and moved by default. Inside this method, selection parameter
//— is true by default making it possible to highlight and move the object
ObjectSetInteger(chart_ID,name,OBJPROP_SELECTABLE,selection);
ObjectSetInteger(chart_ID,name,OBJPROP_SELECTED,selection);
//— enable (true) or disable (false) the mode of continuation of the line’s display to the right
ObjectSetInteger(chart_ID,name,OBJPROP_RAY_RIGHT,ray_right);
//— hide (true) or display (false) graphical object name in the object list
ObjectSetInteger(chart_ID,name,OBJPROP_HIDDEN,hidden);
//— set the priority for receiving the event of a mouse click in the chart
ObjectSetInteger(chart_ID,name,OBJPROP_ZORDER,z_order);
//— successful execution
return(true);
}
const bool selection=true, // highlight to move接下來,將「hidden = true」變更為「hidden = false」,2處「ray_right」變更為「ray」,「OBJPROP_RAY_RIGHT」則改為「OBJPROP_RAY」;如此便完成了趨勢線樣本編碼的準備。順道一提,「OBJPROP_RAY_RIGHT」是MT5用的指示。
//— set anchor points’ coordinates if they are not set
ChangeTrendEmptyPoints(time1,price1,time2,price2);
//— reset the error value
ResetLastError();
Print(__FUNCTION__,
“: failed to create a trend line! Error code = “,GetLastError());
ObjectSetInteger(chart_ID,name,OBJPROP_SELECTABLE,selection);
ObjectSetInteger(chart_ID,name,OBJPROP_SELECTED,selection);
//+——————————————————————+
//| Create a trend line by the given coordinates |
//+——————————————————————+
bool TrendCreate(const long chart_ID=0, // chart’s ID
const string name=”TrendLine”, // line name
const int sub_window=0, // subwindow index
datetime time1=0, // first point time
double price1=0, // first point price
datetime time2=0, // second point time
double price2=0, // second point price
const color clr=clrRed, // line color
const ENUM_LINE_STYLE style=STYLE_SOLID, // line style
const int width=1, // line width
const bool back=false, // in the background
const bool ray=false, // line’s continuation to the right
const bool hidden=false, // hidden in the object list
const long z_order=0) // priority for mouse click
{
//— create a trend line by the given coordinates
if(!ObjectCreate(chart_ID,name,OBJ_TREND,sub_window,time1,price1,time2,price2))
{
return(false);
}
//— set line color
ObjectSetInteger(chart_ID,name,OBJPROP_COLOR,clr);
//— set line display style
ObjectSetInteger(chart_ID,name,OBJPROP_STYLE,style);
//— set line width
ObjectSetInteger(chart_ID,name,OBJPROP_WIDTH,width);
//— display in the foreground (false) or background (true)
ObjectSetInteger(chart_ID,name,OBJPROP_BACK,back);
//— enable (true) or disable (false) the mode of moving the line by mouse
//— when creating a graphical object using ObjectCreate function, the object cannot be
//— highlighted and moved by default. Inside this method, selection parameter
//— is true by default making it possible to highlight and move the object
//— enable (true) or disable (false) the mode of continuation of the line’s display to the right
ObjectSetInteger(chart_ID,name,OBJPROP_RAY,ray);
//— hide (true) or display (false) graphical object name in the object list
ObjectSetInteger(chart_ID,name,OBJPROP_HIDDEN,hidden);
//— set the priority for receiving the event of a mouse click in the chart
ObjectSetInteger(chart_ID,name,OBJPROP_ZORDER,z_order);
//— successful execution
return(true);
}
取得趨勢線的時間與價格等資訊
接下來,將修改此編碼以取得並同步趨勢線的資訊。首先,從準備的趨勢線相關編碼中,複製「ObjectSetInteger(chart_ID,name,OBJPROP_COLOR,clr);」開始的下列13行,並貼至if文體處。if (id == CHARTEVENT_OBJECT_CREATE) {其後,將此部分的編碼如下所示進行改寫。如欲取得趨勢線的狀態,便應將「ObjectSetInteger」全數替換為「ObjectGetInteger」,並設定「OBJPROP_TIME」以獲取時間資訊、設定「OBJPROP_PRICE」以獲取價格資訊。
if (ObjectGetInteger(0, sparam, OBJPROP_TYPE) == OBJ_TREND) {
ObjectSetInteger(chart_ID,name,OBJPROP_COLOR,clr);
//— set line display style
ObjectSetInteger(chart_ID,name,OBJPROP_STYLE,style);
//— set line width
ObjectSetInteger(chart_ID,name,OBJPROP_WIDTH,width);
//— display in the foreground (false) or background (true)
ObjectSetInteger(chart_ID,name,OBJPROP_BACK,back);
//— enable (true) or disable (false) the mode of moving the line by mouse
//— when creating a graphical object using ObjectCreate function, the object cannot be
//— highlighted and moved by default. Inside this method, selection parameter
//— is true by default making it possible to highlight and move the object
//— enable (true) or disable (false) the mode of continuation of the line’s display to the right
ObjectSetInteger(chart_ID,name,OBJPROP_RAY,ray);
}
}
if (id == CHARTEVENT_OBJECT_CREATE) {
if (ObjectGetInteger(0, sparam, OBJPROP_TYPE) == OBJ_TREND) {
datetime time0 = (datetime)ObjectGetInteger(0, sparam, OBJPROP_TIME, 0);
datetime time1 = (datetime)ObjectGetInteger(0, sparam, OBJPROP_TIME, 1);
double price0 = ObjectGetDouble(0, sparam, OBJPROP_PRICE, 0);
double price1 = ObjectGetDouble(0, sparam, OBJPROP_PRICE, 1);
color clr = (color)ObjectGetInteger(0, sparam, OBJPROP_COLOR);
ENUM_LINE_STYLE style = (ENUM_LINE_STYLE)ObjectGetInteger(0, sparam, OBJPROP_STYLE);
int width = (int)ObjectGetInteger(0, sparam, OBJPROP_WIDTH);
bool back = ObjectGetInteger(0, sparam, OBJPROP_BACK);
bool ray = ObjectGetInteger(0, sparam, OBJPROP_RAY);
}
}
將獲取的資訊同步於各個圖表
接下來,要將獲取的資訊同步於各個圖表。關於同步的程式,將沿用「同步複數圖表」一文中的內容。在MQL4幫助檔目錄中,點擊「Chart Operations」→「ChartNext」,便會出現執行所有圖表處理的參考範例頁面,可從中加以運用。long chart_id = ChartFirst();上列編碼的目的為同步圖表範圍,故此處將替換為同步趨勢線。首先將範圍相關的「if (ChartGetInteger(chart_id, CHART_SCALE) != scale) {」「ChartSetInteger(chart_id, CHART_SCALE, scale);」2行予以刪除。
while (true) {
if (chart_id != ChartID()) {
if (ChartGetInteger(chart_id, CHART_SCALE) != scale) {
ChartSetInteger(chart_id, CHART_SCALE, scale);
}
ChartRedraw(chart_id);
}
chart_id = ChartNext(chart_id);
if (chart_id < 0) break;
}
本次將從第一項圖表開始依序取得資訊;在每一次進展時,使用「ChartNext」切換至下一個圖表。由於只要在遇到非原本的圖表、或與原本圖表相同的貨幣對時執行處理,因此要修正第一個if文體。如此一來,只要沒有相同名稱的元件,便會開始製作趨勢線。
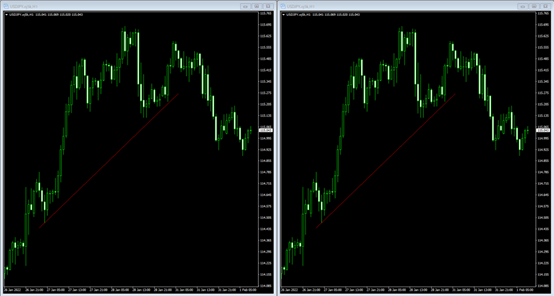
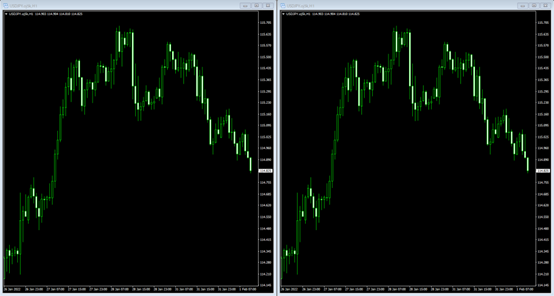
long chart_id = ChartFirst();於此處進行編譯,並設定兩個圖表來繪製趨勢線作為測試;可以見到,當在其中一個圖表上拉出趨勢線,另一個圖表上便會出現相同的線條。
while (true) {
if (chart_id != ChartID() && ChartSymbol(chart_id) == _Symbol) {
if (ObjectFind(chart_id, sparam) == -1)
TrendCreate(chart_id, sparam, 0, time0, price0, time1, price1, clr, style, width, back, ray);
ChartRedraw(chart_id);
}
chart_id = ChartNext(chart_id);
if (chart_id < 0) break;
}
同步趨勢線的位置資訊
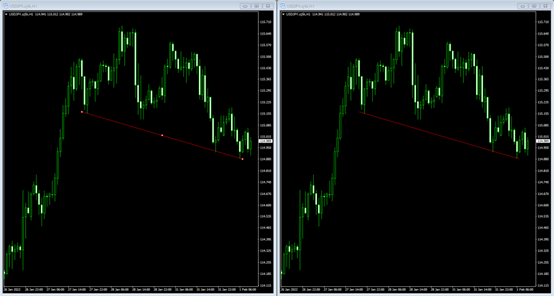
目前已經能夠在圖表中同步趨勢線。但是,在這樣的狀態下,尚無法同步趨勢線的移動;因此, 接下來就要在圖表中拖曳趨勢線時,於其他圖表中同步該位置資訊。此處將沿用製作新趨勢線時的同步編碼,並新增移動趨勢線時的同步編碼。使用變更物件座標的「ObjectMove」函數作為「CHARTEVENT_OBJECT_DRAG」。
if (id == CHARTEVENT_OBJECT_DRAG) {添加上列編碼後進行編譯,即可同步趨勢線的位置。只要當原本圖表的趨勢線遭到拖曳移動,另一個圖表上的趨勢線也會移至相同的位置。
if (ObjectGetInteger(0, sparam, OBJPROP_TYPE) == OBJ_TREND) {
datetime time0 = (datetime)ObjectGetInteger(0, sparam, OBJPROP_TIME, 0);
datetime time1 = (datetime)ObjectGetInteger(0, sparam, OBJPROP_TIME, 1);
double price0 = ObjectGetDouble(0, sparam, OBJPROP_PRICE, 0);
double price1 = ObjectGetDouble(0, sparam, OBJPROP_PRICE, 1);
long chart_id = ChartFirst();
while (true) {
if (chart_id != ChartID() && ChartSymbol(chart_id) == _Symbol) {
ObjectMove(chart_id, sparam, 0, time0, price0);
ObjectMove(chart_id, sparam, 1, time1, price1);
ChartRedraw(chart_id);
}
chart_id = ChartNext(chart_id);
if (chart_id < 0) break;
}
}
}
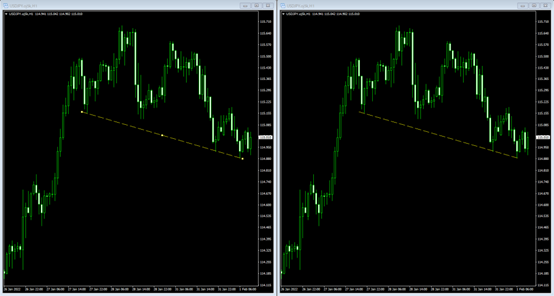
同步趨勢線的繪圖樣式與刪除等操作
最後,將針對趨勢線的顏色、粗細、線條種類等樣式的變更,以及趨勢線遭到刪除等操作予以同步。首先是樣式相關的設定處理,「CHARTEVENT_OBJECT_CHANGE」將如以下所示進行編寫;趨勢線的狀態設定則使用「ObjectSetInteger」。if (id == CHARTEVENT_OBJECT_CHANGE) {如此進行編譯後,可見當原本的圖表線條變成黃色、種類變成虛線時,另一條趨勢線也會出現相同的改變。
if (ObjectGetInteger(0, sparam, OBJPROP_TYPE) == OBJ_TREND) {
color clr = (color)ObjectGetInteger(0, sparam, OBJPROP_COLOR);
ENUM_LINE_STYLE style = (ENUM_LINE_STYLE)ObjectGetInteger(0, sparam, OBJPROP_STYLE);
int width = (int)ObjectGetInteger(0, sparam, OBJPROP_WIDTH);
bool back = ObjectGetInteger(0, sparam, OBJPROP_BACK);
bool ray = ObjectGetInteger(0, sparam, OBJPROP_RAY);
long chart_id = ChartFirst();
while (true) {
if (chart_id != ChartID() && ChartSymbol(chart_id) == _Symbol) {
ObjectSetInteger(chart_id, sparam, OBJPROP_COLOR, clr);
ObjectSetInteger(chart_id, sparam, OBJPROP_STYLE, style);
ObjectSetInteger(chart_id, sparam, OBJPROP_WIDTH, width);
ObjectSetInteger(chart_id, sparam, OBJPROP_BACK, back);
ObjectSetInteger(chart_id, sparam, OBJPROP_RAY, ray);
ChartRedraw(chart_id);
}
chart_id = ChartNext(chart_id);
if (chart_id < 0) break;
}
}
}
至於刪除趨勢線的資訊同步,則是以「CHARTEVENT_OBJECT_DELETE」如下方所示進行編寫。將第二個if文體的「ObjectGetInteger」變更為「StringFind」之後,只要含有製作趨勢線時的「Trendline」名稱遭到刪除,便會開始予以同步刪除。(由於趨勢線刪除後,無法透過「ObjectGetInteger」 取得資訊,因此需利用「StringFind」進行辨認。)。
if (id == CHARTEVENT_OBJECT_DELETE) {如此即是完成。進行編譯之後,只要原本圖表上的趨勢線遭到刪除,另一個趨勢線也會同時消失。
if (StringFind(sparam, “Trendline “) != -1) {
long chart_id = ChartFirst();
while (true) {
if (chart_id != ChartID() && ChartSymbol(chart_id) == _Symbol) {
ObjectDelete(chart_id, sparam);
ChartRedraw(chart_id);
}
chart_id = ChartNext(chart_id);
if (chart_id < 0) break;
}
}
}
原始碼
本次製作的原始碼如以下所示。//+——————————————————————+
//| TrendlineSync.mq4 |
//| Copyright 2022, MetaQuotes Software Corp. |
//| https://www.mql5.com |
//+——————————————————————+
#property copyright “Copyright 2022, MetaQuotes Software Corp.”
#property link “https://www.mql5.com”
#property version “1.00”
#property strict
#property indicator_chart_window
//+——————————————————————+
//| Custom indicator initialization function |
//+——————————————————————+
int OnInit()
{
//— indicator buffers mapping
ChartSetInteger(0, CHART_EVENT_OBJECT_CREATE, true);
ChartSetInteger(0, CHART_EVENT_OBJECT_DELETE, true);
//—
return(INIT_SUCCEEDED);
}
//+——————————————————————+
//| Custom indicator iteration function |
//+——————————————————————+
int OnCalculate(const int rates_total,
const int prev_calculated,
const datetime &time[],
const double &open[],
const double &high[],
const double &low[],
const double &close[],
const long &tick_volume[],
const long &volume[],
const int &spread[])
{
//—
//— return value of prev_calculated for next call
return(rates_total);
}
//+——————————————————————+
//| ChartEvent function |
//+——————————————————————+
void OnChartEvent(const int id,
const long &lparam,
const double &dparam,
const string &sparam)
{
//—
if (id == CHARTEVENT_OBJECT_CREATE) {
if (ObjectGetInteger(0, sparam, OBJPROP_TYPE) == OBJ_TREND) {
datetime time0 = (datetime)ObjectGetInteger(0, sparam, OBJPROP_TIME, 0);
datetime time1 = (datetime)ObjectGetInteger(0, sparam, OBJPROP_TIME, 1);
double price0 = ObjectGetDouble(0, sparam, OBJPROP_PRICE, 0);
double price1 = ObjectGetDouble(0, sparam, OBJPROP_PRICE, 1);
color clr = (color)ObjectGetInteger(0, sparam, OBJPROP_COLOR);
ENUM_LINE_STYLE style = (ENUM_LINE_STYLE)ObjectGetInteger(0, sparam, OBJPROP_STYLE);
int width = (int)ObjectGetInteger(0, sparam, OBJPROP_WIDTH);
bool back = ObjectGetInteger(0, sparam, OBJPROP_BACK);
bool ray = ObjectGetInteger(0, sparam, OBJPROP_RAY);
long chart_id = ChartFirst();
while (true) {
if (chart_id != ChartID() && ChartSymbol(chart_id) == _Symbol) {
if (ObjectFind(chart_id, sparam) == -1)
TrendCreate(chart_id, sparam, 0, time0, price0, time1, price1, clr, style, width, back, ray);
ChartRedraw(chart_id);
}
chart_id = ChartNext(chart_id);
if (chart_id < 0) break;
}
}
}
if (id == CHARTEVENT_OBJECT_DRAG) {
if (ObjectGetInteger(0, sparam, OBJPROP_TYPE) == OBJ_TREND) {
datetime time0 = (datetime)ObjectGetInteger(0, sparam, OBJPROP_TIME, 0);
datetime time1 = (datetime)ObjectGetInteger(0, sparam, OBJPROP_TIME, 1);
double price0 = ObjectGetDouble(0, sparam, OBJPROP_PRICE, 0);
double price1 = ObjectGetDouble(0, sparam, OBJPROP_PRICE, 1);
long chart_id = ChartFirst();
while (true) {
if (chart_id != ChartID() && ChartSymbol(chart_id) == _Symbol) {
ObjectMove(chart_id, sparam, 0, time0, price0);
ObjectMove(chart_id, sparam, 1, time1, price1);
ChartRedraw(chart_id);
}
chart_id = ChartNext(chart_id);
if (chart_id < 0) break;
}
}
}
if (id == CHARTEVENT_OBJECT_CHANGE) {
if (ObjectGetInteger(0, sparam, OBJPROP_TYPE) == OBJ_TREND) {
color clr = (color)ObjectGetInteger(0, sparam, OBJPROP_COLOR);
ENUM_LINE_STYLE style = (ENUM_LINE_STYLE)ObjectGetInteger(0, sparam, OBJPROP_STYLE);
int width = (int)ObjectGetInteger(0, sparam, OBJPROP_WIDTH);
bool back = ObjectGetInteger(0, sparam, OBJPROP_BACK);
bool ray = ObjectGetInteger(0, sparam, OBJPROP_RAY);
long chart_id = ChartFirst();
while (true) {
if (chart_id != ChartID() && ChartSymbol(chart_id) == _Symbol) {
ObjectSetInteger(chart_id, sparam, OBJPROP_COLOR, clr);
ObjectSetInteger(chart_id, sparam, OBJPROP_STYLE, style);
ObjectSetInteger(chart_id, sparam, OBJPROP_WIDTH, width);
ObjectSetInteger(chart_id, sparam, OBJPROP_BACK, back);
ObjectSetInteger(chart_id, sparam, OBJPROP_RAY, ray);
ChartRedraw(chart_id);
}
chart_id = ChartNext(chart_id);
if (chart_id < 0) break;
}
}
}
if (id == CHARTEVENT_OBJECT_DELETE) {
if (StringFind(sparam, “Trendline “) != -1) {
long chart_id = ChartFirst();
while (true) {
if (chart_id != ChartID() && ChartSymbol(chart_id) == _Symbol) {
ObjectDelete(chart_id, sparam);
ChartRedraw(chart_id);
}
chart_id = ChartNext(chart_id);
if (chart_id < 0) break;
}
}
}
}
//+——————————————————————+
//| Create a trend line by the given coordinates |
//+——————————————————————+
bool TrendCreate(const long chart_ID = 0, // chart’s ID
const string name = “TrendLine”, // line name
const int sub_window = 0, // subwindow index
datetime time1 = 0, // first point time
double price1 = 0, // first point price
datetime time2 = 0, // second point time
double price2 = 0, // second point price
const color clr = clrRed, // line color
const ENUM_LINE_STYLE style = STYLE_SOLID, // line style
const int width = 1, // line width
const bool back = false, // in the background
const bool ray = false, // line’s continuation to the right
const bool hidden = false, // hidden in the object list
const long z_order = 0) // priority for mouse click
{
//— create a trend line by the given coordinates
if(!ObjectCreate(chart_ID, name, OBJ_TREND, sub_window, time1, price1, time2, price2)) {
return(false);
}
//— set line color
ObjectSetInteger(chart_ID, name, OBJPROP_COLOR, clr);
//— set line display style
ObjectSetInteger(chart_ID, name, OBJPROP_STYLE, style);
//— set line width
ObjectSetInteger(chart_ID, name, OBJPROP_WIDTH, width);
//— display in the foreground (false) or background (true)
ObjectSetInteger(chart_ID, name, OBJPROP_BACK, back);
//— enable (true) or disable (false) the mode of moving the line by mouse
//— when creating a graphical object using ObjectCreate function, the object cannot be
//— highlighted and moved by default. Inside this method, selection parameter
//— is true by default making it possible to highlight and move the object
//— enable (true) or disable (false) the mode of continuation of the line’s display to the right
ObjectSetInteger(chart_ID, name, OBJPROP_RAY, ray);
//— hide (true) or display (false) graphical object name in the object list
ObjectSetInteger(chart_ID, name, OBJPROP_HIDDEN, hidden);
//— set the priority for receiving the event of a mouse click in the chart
ObjectSetInteger(chart_ID, name, OBJPROP_ZORDER, z_order);
//— successful execution
return(true);
}
//+——————————————————————+
將EA自動程式交易應用於外匯與差價合約交易中

我們以圖文形式詳細介紹有關EA自動程式交易的基本知識,以及在MT4/MT5平台上的安裝、參數設定方法、編碼等等內容。另外,對持有OANDA帳戶的客戶,還可以免費使用我們的獨有EA與指標工具。