製作在主窗口中顯示KD指標的自動交易程式
新增參數與緩衝器
在本章節中,將說明如何在主窗口中顯示一般出現於副窗口中的震盪類KD指標。這次的功能是可以將KD指標的20%與80%水準處繪製水平線,當在20%線下方出現黃金交叉時顯示買進符號、在80%線上方出現死亡交叉時則顯示賣出符號。
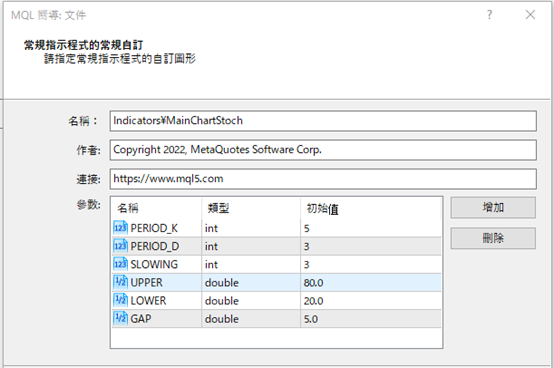
首先,在製作新檔案時選擇「自訂指標」,並將檔案命名為「MainChartStoch」並新增六個參數。
●第一個的名稱為「PERIOD_K」、樣式為「int」、初始值為「5」、
●第二個的名稱為「PERIOD_D」、樣式為「int」、初始值為「3」、
●第三個的名稱為「SLOWING」、樣式為「int」、初始值為「3」、
●第四個的名稱為「UPPER」、樣式為「double」、初始值為「80.0」、
●第五個的名稱為「LOWER」、樣式為を「double」、初始值為「20.0」、
●第六個的名稱為「GAP」、樣式為「double」、初始值為「5.0」。
UPPER與LOWER是標準線用的參數、GAP則是設定K線與交叉符號距離的參數。
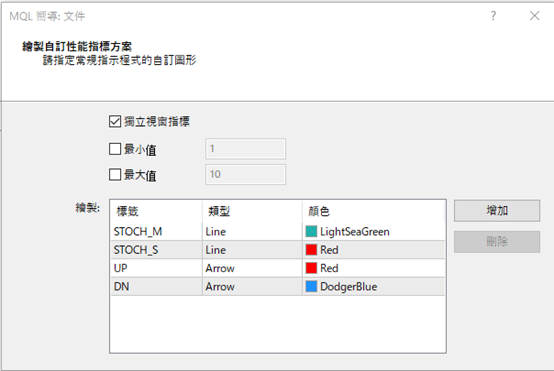
在「自訂指標程式的事件處理常式」中點選「OnChartEvent」進入下一步,並在「繪製自訂性能指標方案」設定欄中登錄四個緩衝器。
●第一個是主線用,標籤設定為「STOCH_M」、樣式為「Line」、顏色為「LightSeaGreen」、
●第二個是符號線用,標籤設定為「STOCH_S」、樣式為「Line」、顏色為「Red」、
●第三個是上升的箭頭符號用,標籤設定為「UP」、樣式為「Arrow」、顏色為「Red」、
●第四個是下降的箭頭符號用,標籤設定為「DN」、樣式為「Arrow」、顏色為「DodgerBlue」。
新增後點擊「完成」即可呈現雛形。
新增「價格欄位」與「移動平均的類別」
開啟新檔案時,將修正上方的屬性。在「STOCH_S」的樣式(style)中結合預設的KD指標,將「STYLE_SOLID(實線)」改為「STYLE_DOT(虛線)」。另外,為了使買賣符號易於辨認,將「UP」與「DN」的寬度(width)從「1」改成「2」。
//--- plot STOCH_S接下來,在「//--- input parameters」的「input int SLOWING=3;」下方新增「價格欄位」與「移動平均的類別」參數。為了使各個參數易於辨認,預先以「//」輸入註釋。
#property indicator_label2 “STOCH_S”
#property indicator_type2 DRAW_LINE
#property indicator_color2 clrRed
#property indicator_style2 STYLE_DOT
#property indicator_width2 1
//--- plot UP
#property indicator_label3 “UP”
#property indicator_type3 DRAW_ARROW
#property indicator_color3 clrRed
#property indicator_style3 STYLE_SOLID
#property indicator_width3 2
//--- plot DN
#property indicator_label4 “DN”
#property indicator_type4 DRAW_ARROW
#property indicator_color4 clrDodgerBlue
#property indicator_style4 STYLE_SOLID
#property indicator_width4 2
input int PERIOD_K = 5; // %K 時間接下來,將以「SetIndexArrow」指定KD指標出現黃金交叉、死亡交叉時所顯示的符號樣式。
input int PERIOD_D = 3; // %D 時間
input int SLOWING = 3; // 趨緩
input ENUM_STO_PRICE PRICE = STO_LOWHIGH; // 價格欄位
input ENUM_MA_METHOD METHOD = MODE_SMA; // 移動平均的類別
input double UPPER = 80.0; // 上限標準
input double LOWER = 20.0; // 下限標準
input double GAP = 5.0; // 條列至符號的距離[pips]
將OnInit函數下方的「PlotIndexSetInteger(2,PLOT_ARROW,159);」「PlotIndexSetInteger(3,PLOT_ARROW,159);」兩行變更為以下內容。本次使用「233(向上的普通箭頭)」以及「234(向下的普通箭頭)」。
SetIndexArrow(2, 233);
SetIndexArrow(3, 234);
製作顯示KD指標的函數
接下來,將寫入使KD指標顯示於主窗口的處理過程。此處製作「DrawStoch()」函數來顯示KD指標。在OnCalculate函數之下叫出「DrawStoch();」。
int OnCalculate(const int rates_total,接著在OnChartEvent函數下方新增if文體,當出現波動訊息、圖表產生變化時執行DrawStoch()。
const int prev_calculated,
const datetime &time[],
const double &open[],
const double &high[],
const double &low[],
const double &close[],
const long &tick_volume[],
const long &volume[],
const int &spread[])
{
//---
DrawStoch();
//--- return value of prev_calculated for next call
return(rates_total);
}
if (id == CHARTEVENT_CHART_CHANGE) DrawStoch();
寫入DrawStoch()的處理過程
在「ChartEvent function」下方設定「Draw function」,並寫入DrawStoch()的處理過程。首先定義顯示範圍。
從顯示圖表左邊條列的「CHART_FIRST_VISIBLE_BAR」,減去顯示圖表所有條列數的「CHART_WIDTH_IN_BARS」,便會得出右邊的數值。若該計算結果為負數,就會呈現「0」。
void DrawStoch()若要在主窗口中顯示KD指標,則主窗口的最下方必須改變成「0%」、最上方則是「100%」,並以「ChartGetDouble」取得圖表上下的價格,進而算出1%的推薦價格。
{
int barF = (int)ChartGetInteger(0, CHART_FIRST_VISIBLE_BAR);
int barR = barF - (int)ChartGetInteger(0, CHART_WIDTH_IN_BARS);
if (barR < 0) barR = 0;
double max = ChartGetDouble(0, CHART_PRICE_MAX);接著以for文體計算K線左邊至右邊。利用得出的推薦價格,計算主要緩衝器與訊息緩衝器。可透過下限+推薦價格×KD指標數值來計算。
double min = ChartGetDouble(0, CHART_PRICE_MIN);
double pitch = (max - min) / 100;
for (int i = barF; i >= barR; i--) {另外,若在執行前尚未定義緩衝器用的序列,將會出現錯誤狀況,因此應先在「int barF = (int)ChartGetInteger(0, CHART_FIRST_VISIBLE_BAR);」上方添加下列內容。
STOCH_MBuffer[i] = min + pitch * iStochastic(NULL, 0, PERIOD_K, PERIOD_D, SLOWING, METHOD, PRICE, MODE_MAIN, i);
STOCH_SBuffer[i] = min + pitch * iStochastic(NULL, 0, PERIOD_K, PERIOD_D, SLOWING, METHOD, PRICE, MODE_SIGNAL, i);
}
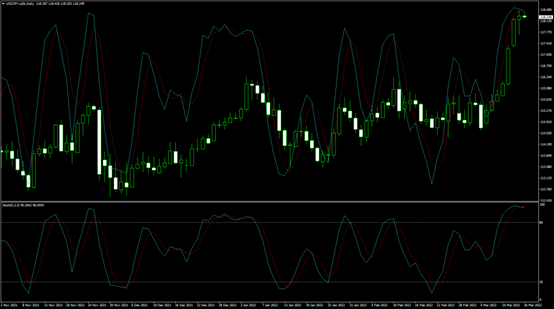
if (ArraySize(STOCH_MBuffer) == 0) return;如此進行編譯並設定圖表,便會在主窗口中顯示KD指標。可以見到其與副窗口中顯示的形狀相同。
在20%與80%水準顯示水平線
接下來,將在主窗口中如何繪製KD指標的水平線。可從MQL4幫助檔中複製水平線的範例編碼。在MQL4幫助檔的目錄中點選「Constants, Enumerations and Structures」→「Objects Constants」→「Object Types」,即可看見元件一覽。從中選擇「OBJ_HLINE」,並將預先準備的「Create the horizontal line」編碼複製貼上於檔案下方。
從「//--- if the price is not set, set it at the current Bid price level」至「ResetLastError();」的5行以及「Print(__FUNCTION__,」「”: failed to create a horizontal line! Error code = “, GetLastError());」兩行皆無需使用,可予以刪除。
另外,「// line color」的顏色從「Red」改成「Silver」、「// line style」的樣式從「SOLID」改成「DOT」、「// in the background」的背景從「false」改成「true」。
//+------------------------------------------------------------------+使用此HLineCreate來顯示水平線。首先利用下列公式算出水平線的顯示價格。新增於DrawStoch()的「double pitch = (max - min) / 100;」下方。
//| Create the horizontal line |
//+------------------------------------------------------------------+
bool HLineCreate(const long chart_ID = 0, // chart’s ID
const string name = “HLine”, // line name
const int sub_window = 0, // subwindow index
double price = 0, // line price
const color clr = clrSilver, // line color
const ENUM_LINE_STYLE style = STYLE_DOT, // line style
const int width = 1, // line width
const bool back = true, // in the background
const bool selection = false, // highlight to move
const bool hidden = true, // hidden in the object list
const long z_order = 0) // priority for mouse click
{
//--- create a horizontal line
if(!ObjectCreate(chart_ID, name, OBJ_HLINE, sub_window, 0, price)) {
return(false);
}
//--- set line color
ObjectSetInteger(chart_ID, name, OBJPROP_COLOR, clr);
//--- set line display style
ObjectSetInteger(chart_ID, name, OBJPROP_STYLE, style);
//--- set line width
ObjectSetInteger(chart_ID, name, OBJPROP_WIDTH, width);
//--- display in the foreground (false) or background (true)
ObjectSetInteger(chart_ID, name, OBJPROP_BACK, back);
//--- enable (true) or disable (false) the mode of moving the line by mouse
//--- when creating a graphical object using ObjectCreate function, the object cannot be
//--- highlighted and moved by default. Inside this method, selection parameter
//--- is true by default making it possible to highlight and move the object
ObjectSetInteger(chart_ID, name, OBJPROP_SELECTABLE, selection);
ObjectSetInteger(chart_ID, name, OBJPROP_SELECTED, selection);
//--- hide (true) or display (false) graphical object name in the object list
ObjectSetInteger(chart_ID, name, OBJPROP_HIDDEN, hidden);
//--- set the priority for receiving the event of a mouse click in the chart
ObjectSetInteger(chart_ID, name, OBJPROP_ZORDER, z_order);
//--- successful execution
return(true);
}
double upper = min + pitch * UPPER;使用得出的「upper」與「lower」顯示水平線。當上下的範圍出現變化時,為了使水平線能夠在消失後再度繪製,也須執行「ObjectsDeleteAll」。
double lower = min + pitch * LOWER;
ObjectsDeleteAll(0, “Stoch_”);另外,當指標超出圖表時也必須加以刪除,故也應先定義OnDeinit函數。在「Custom indicator initialization function」下方設定「Custom indicator deinitialization function」,並新增下列編碼。
HLineCreate(0, “Stoch_upper”, 0, upper);
HLineCreate(0, “Stoch_lower”, 0, lower);
void OnDeinit(const int reason)如此進行編譯,即可在圖表主窗口的20%與80%水準處畫出水平線。
{
ObjectsDeleteAll(0, “Stoch_”);
}

顯示買進訊號與賣出訊號
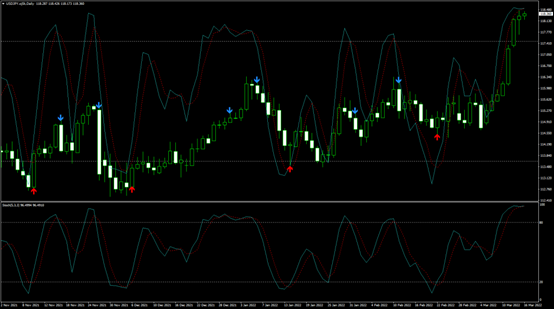
最後將製作條件來顯示買進訊號與賣出訊號。首先在DrawStoch()的「if (barR < 0) barR = 0;」下方,如以下所示以「gap」設定K線的距離。double gap = GAP * _Point * 10;接下來,將買進訊號的條件設定為主線高於訊號線、且前一根K線的主線低於訊號線、同時前一根K線的數值為「lower」。
相同地,將賣出訊號的條件設定為主線低於訊號線、且一前一根K線的主線高於訊號線、同時前一根K線的數值為「upper」。
將下列編碼新增於「STOCH_SBuffer[i] = min + pitch * iStochastic(NULL, 0, PERIOD_K, PERIOD_D, SLOWING, METHOD, PRICE, MODE_SIGNAL, i);」。
if (STOCH_MBuffer[i] > STOCH_SBuffer[i] && STOCH_MBuffer[i + 1] <= STOCH_SBuffer[i+ 1] && STOCH_SBuffer[i+ 1] <= lower)如此進行編譯,即可在圖表上看見代表買進訊號的向上箭頭、以及代表賣出訊號的向下箭頭。
UPBuffer[i] = Low[i] - gap;
else UPBuffer[i] = EMPTY_VALUE;
if (STOCH_MBuffer[i] < STOCH_SBuffer[i] && STOCH_MBuffer[i + 1] >= STOCH_SBuffer[i+ 1] && STOCH_SBuffer[i+ 1] >= upper)
DNBuffer[i] = High[i] + gap;
else DNBuffer[i] = EMPTY_VALUE;
原始碼
本次製作的原始碼如以下所示。//+------------------------------------------------------------------+
//| MainChartStoch.mq4 |
//| Copyright 2022, MetaQuotes Software Corp. |
//| https://www.mql5.com |
//+------------------------------------------------------------------+
#property copyright “Copyright 2022, MetaQuotes Software Corp.”
#property link “https://www.mql5.com”
#property version “1.00”
#property strict
#property indicator_chart_window
#property indicator_buffers 4
#property indicator_plots 4
//--- plot STOCH_M
#property indicator_label1 “STOCH_M”
#property indicator_type1 DRAW_LINE
#property indicator_color1 clrLightSeaGreen
#property indicator_style1 STYLE_SOLID
#property indicator_width1 1
//--- plot STOCH_S
#property indicator_label2 “STOCH_S”
#property indicator_type2 DRAW_LINE
#property indicator_color2 clrRed
#property indicator_style2 STYLE_DOT
#property indicator_width2 1
//--- plot UP
#property indicator_label3 “UP”
#property indicator_type3 DRAW_ARROW
#property indicator_color3 clrRed
#property indicator_style3 STYLE_SOLID
#property indicator_width3 2
//--- plot DN
#property indicator_label4 “DN”
#property indicator_type4 DRAW_ARROW
#property indicator_color4 clrDodgerBlue
#property indicator_style4 STYLE_SOLID
#property indicator_width4 2
//--- input parameters
input int PERIOD_K = 5; // %K 時間
input int PERIOD_D = 3; // %D 時間
input int SLOWING = 3; // 趨緩
input ENUM_STO_PRICE PRICE = STO_LOWHIGH; // 價格欄位
input ENUM_MA_METHOD METHOD = MODE_SMA; // 移動平均的類別
input double UPPER = 80.0; // 上限標準
input double LOWER = 20.0; // 下限標準
input double GAP = 5.0; // 條列至訊號的距離[pips]
//--- indicator buffers
double STOCH_MBuffer[];
double STOCH_SBuffer[];
double UPBuffer[];
double DNBuffer[];
//+------------------------------------------------------------------+
//| Custom indicator initialization function |
//+------------------------------------------------------------------+
int OnInit()
{
//--- indicator buffers mapping
SetIndexBuffer(0, STOCH_MBuffer);
SetIndexBuffer(1, STOCH_SBuffer);
SetIndexBuffer(2, UPBuffer);
SetIndexBuffer(3, DNBuffer);
//--- setting a code from the Wingdings charset as the property of PLOT_ARROW
SetIndexArrow(2, 233);
SetIndexArrow(3, 234);
//---
return(INIT_SUCCEEDED);
}
//+------------------------------------------------------------------+
//| Custom indicator deinitialization function |
//+------------------------------------------------------------------+
void OnDeinit(const int reason)
{
ObjectsDeleteAll(0, “Stoch_”);
}
//+------------------------------------------------------------------+
//| Custom indicator iteration function |
//+------------------------------------------------------------------+
int OnCalculate(const int rates_total,
const int prev_calculated,
const datetime &time[],
const double &open[],
const double &high[],
const double &low[],
const double &close[],
const long &tick_volume[],
const long &volume[],
const int &spread[])
{
//---
DrawStoch();
//--- return value of prev_calculated for next call
return(rates_total);
}
//+------------------------------------------------------------------+
//| ChartEvent function |
//+------------------------------------------------------------------+
void OnChartEvent(const int id,
const long &lparam,
const double &dparam,
const string &sparam)
{
//---
if (id == CHARTEVENT_CHART_CHANGE) DrawStoch();
}
//+------------------------------------------------------------------+
//| Draw function |
//+------------------------------------------------------------------+
void DrawStoch()
{
if (ArraySize(STOCH_MBuffer) == 0) return;
int barF = (int)ChartGetInteger(0, CHART_FIRST_VISIBLE_BAR);
int barR = barF - (int)ChartGetInteger(0, CHART_WIDTH_IN_BARS);
if (barR < 0) barR = 0;
double gap = GAP * _Point * 10;
double max = ChartGetDouble(0, CHART_PRICE_MAX);
double min = ChartGetDouble(0, CHART_PRICE_MIN);
double pitch = (max - min) / 100;
double upper = min + pitch * UPPER;
double lower = min + pitch * LOWER;
ObjectsDeleteAll(0, “Stoch_”);
HLineCreate(0, “Stoch_upper”, 0, upper);
HLineCreate(0, “Stoch_lower”, 0, lower);
for (int i = barF; i >= barR; i--) {
STOCH_MBuffer[i] = min + pitch * iStochastic(NULL, 0, PERIOD_K, PERIOD_D, SLOWING, METHOD, PRICE, MODE_MAIN, i);
STOCH_SBuffer[i] = min + pitch * iStochastic(NULL, 0, PERIOD_K, PERIOD_D, SLOWING, METHOD, PRICE, MODE_SIGNAL, i);
if (STOCH_MBuffer[i] > STOCH_SBuffer[i] && STOCH_MBuffer[i + 1] <= STOCH_SBuffer[i + 1] && STOCH_SBuffer[i + 1] <= lower)
UPBuffer[i] = Low[i] - gap;
else UPBuffer[i] = EMPTY_VALUE;
if (STOCH_MBuffer[i] < STOCH_SBuffer[i] && STOCH_MBuffer[i + 1] >= STOCH_SBuffer[i + 1] && STOCH_SBuffer[i + 1] >= upper)
DNBuffer[i] = High[i] + gap;
else DNBuffer[i] = EMPTY_VALUE;
}
}
//+------------------------------------------------------------------+
//| Create the horizontal line |
//+------------------------------------------------------------------+
bool HLineCreate(const long chart_ID = 0, // chart’s ID
const string name = “HLine”, // line name
const int sub_window = 0, // subwindow index
double price = 0, // line price
const color clr = clrSilver, // line color
const ENUM_LINE_STYLE style = STYLE_DOT, // line style
const int width = 1, // line width
const bool back = true, // in the background
const bool selection = false, // highlight to move
const bool hidden = true, // hidden in the object list
const long z_order = 0) // priority for mouse click
{
//--- create a horizontal line
if(!ObjectCreate(chart_ID, name, OBJ_HLINE, sub_window, 0, price)) {
return(false);
}
//--- set line color
ObjectSetInteger(chart_ID, name, OBJPROP_COLOR, clr);
//--- set line display style
ObjectSetInteger(chart_ID, name, OBJPROP_STYLE, style);
//--- set line width
ObjectSetInteger(chart_ID, name, OBJPROP_WIDTH, width);
//--- display in the foreground (false) or background (true)
ObjectSetInteger(chart_ID, name, OBJPROP_BACK, back);
//--- enable (true) or disable (false) the mode of moving the line by mouse
//--- when creating a graphical object using ObjectCreate function, the object cannot be
//--- highlighted and moved by default. Inside this method, selection parameter
//--- is true by default making it possible to highlight and move the object
ObjectSetInteger(chart_ID, name, OBJPROP_SELECTABLE, selection);
ObjectSetInteger(chart_ID, name, OBJPROP_SELECTED, selection);
//--- hide (true) or display (false) graphical object name in the object list
ObjectSetInteger(chart_ID, name, OBJPROP_HIDDEN, hidden);
//--- set the priority for receiving the event of a mouse click in the chart
ObjectSetInteger(chart_ID, name, OBJPROP_ZORDER, z_order);
//--- successful execution
return(true);
}
將EA自動程式交易應用於外匯與差價合約交易中

我們以圖文形式詳細介紹有關EA自動程式交易的基本知識,以及在MT4/MT5平台上的安裝、參數設定方法、編碼等等內容。另外,對持有OANDA帳戶的客戶,還可以免費使用我們的獨有EA與指標工具。