將市場報價中的複數貨幣對資訊用來繪製圖表的方式
由上依序取得市場報價中的貨幣對名稱
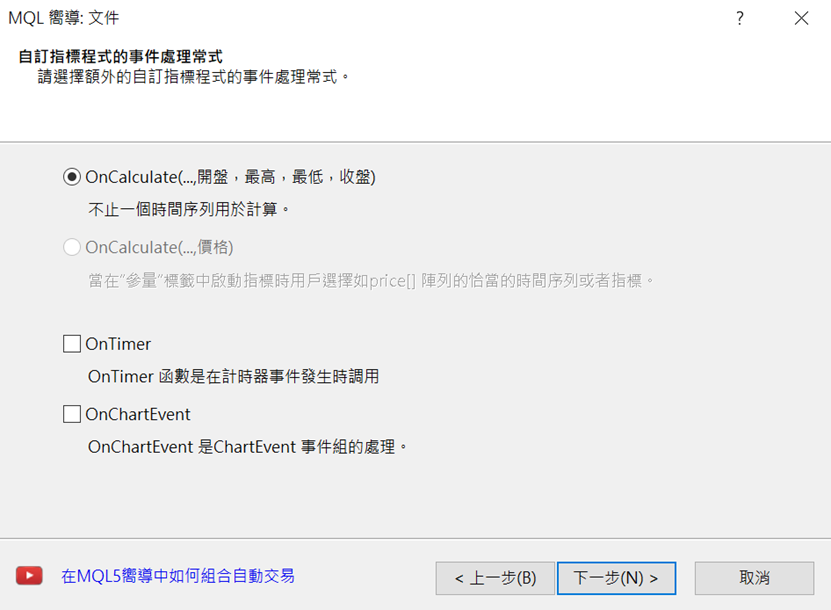
在本篇章節中,將說明市場報價中複數貨幣對的相關處理方式。首先,將在市場報價的顯示畫面中,由上依序顯示各個貨幣對。在製作新檔案時,選擇「自訂指標」,並將檔案名稱命名為「MultiSymbol_demo」。在「自訂指標程式的事件處理常式」畫面中,無需勾選「OnTimer」「OnChartEvent」,直接點擊「完成」即為雛形。
在一開始,於OnCalculate中使用SymbolName函數,從上方依序取得市場報價中的貨幣對名稱。SymbolName函數的第二個括弧內寫入「true」,即可從市場報價列表中取得貨幣對名稱。若無法取得貨幣對名稱,則應去除for文體,並先以if文體進行break處理。
for(int i = 0; i < 1000; i++) {
string symbol = SymbolName(i, true);
if (symbol == NULL) break;
}
以Label物件顯示取得的貨幣對名稱
接下來,將以Labe物件顯示取得的貨幣對名稱;此處會從MQL4幫助檔中,複製Label元件的範例編碼並加以運用。點擊MQL4幫助檔目錄的「Constants, Enumerations and Structures」→「Objects Constants」→「Object Types」,便會出現物件一覽;從中選擇「OBJ_LABEL」後,複製預先準備的「Create a text label」編碼,並貼至檔案下方。
首先,從貼上編碼的if文體中,刪除不需要的「Print(__FUNCTION__,」以及「: failed to create text label! Error code = “,GetLastError());」2行。
為了將物件的標準位置設定為右邊中央,將「// anchor type」處的「anchor = ANCHOR_LEFT_UPPER」變更為「anchor = ANCHOR_RIGHT」。
另外,顏色從「clrRed」改為「clrWhite」,字體則從「font = “Arial”」改為「font = “Arial Bold”」,呈現白色的粗體字。
其他項目則維持原狀。
//+——————————————————————+其後,將LabelCreate處理寫入於OnCalculate內的if文體下方。參數的間隔指定為X位置「90」、Y位置16像素,因此設定為「20 + i * 16」;標準位置設定為左上方的「CORNER_LEFT_UPPER」、文字則是「symbol」。
//| Create a text label |
//+——————————————————————+
bool LabelCreate(const long chart_ID=0, // chart’s ID
const string name=”Label”, // label name
const int sub_window=0, // subwindow index
const int x=0, // X coordinate
const int y=0, // Y coordinate
const ENUM_BASE_CORNER corner=CORNER_LEFT_UPPER, // chart corner for anchoring
const string text=”Label”, // text
const string font=”Arial Bold”, // font
const int font_size=10, // font size
const color clr=clrWhite, // color
const double angle=0.0, // text slope
const ENUM_ANCHOR_POINT anchor=ANCHOR_RIGHT, // anchor type
const bool back=false, // in the background
const bool selection=false, // highlight to move
const bool hidden=true, // hidden in the object list
const long z_order=0) // priority for mouse click
{
//— reset the error value
ResetLastError();
//— create a text label
if(!ObjectCreate(chart_ID,name,OBJ_LABEL,sub_window,0,0))
{
return(false);
}
//— set label coordinates
ObjectSetInteger(chart_ID,name,OBJPROP_XDISTANCE,x);
ObjectSetInteger(chart_ID,name,OBJPROP_YDISTANCE,y);
//— set the chart’s corner, relative to which point coordinates are defined
ObjectSetInteger(chart_ID,name,OBJPROP_CORNER,corner);
//— set the text
ObjectSetString(chart_ID,name,OBJPROP_TEXT,text);
//— set text font
ObjectSetString(chart_ID,name,OBJPROP_FONT,font);
//— set font size
ObjectSetInteger(chart_ID,name,OBJPROP_FONTSIZE,font_size);
//— set the slope angle of the text
ObjectSetDouble(chart_ID,name,OBJPROP_ANGLE,angle);
//— set anchor type
ObjectSetInteger(chart_ID,name,OBJPROP_ANCHOR,anchor);
//— set color
ObjectSetInteger(chart_ID,name,OBJPROP_COLOR,clr);
//— display in the foreground (false) or background (true)
ObjectSetInteger(chart_ID,name,OBJPROP_BACK,back);
//— enable (true) or disable (false) the mode of moving the label by mouse
ObjectSetInteger(chart_ID,name,OBJPROP_SELECTABLE,selection);
ObjectSetInteger(chart_ID,name,OBJPROP_SELECTED,selection);
//— hide (true) or display (false) graphical object name in the object list
ObjectSetInteger(chart_ID,name,OBJPROP_HIDDEN,hidden);
//— set the priority for receiving the event of a mouse click in the chart
ObjectSetInteger(chart_ID,name,OBJPROP_ZORDER,z_order);
//— successful execution
return(true);
}
//+——————————————————————+
此處之下為初期參數、並不會產生任何問題,故可予以省略。
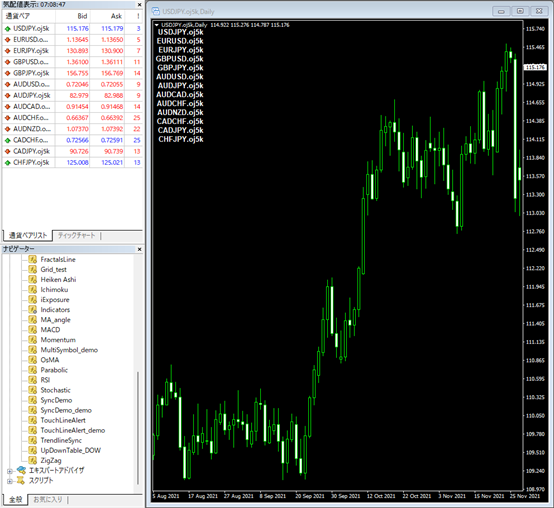
LabelCreate(0, “Symbol” + IntegerToString(i), 0, 90, 20 + i * 16, CORNER_LEFT_UPPER, symbol);如此進行編譯並設定圖表後,將可在圖表的左上方,從上依序顯示參考價的貨幣對名稱。
在貨幣對名稱旁顯示價格變動的比例
接下來,將計算各個貨幣對的價格變動量,並製作以條形圖顯示的工具。首先,將使用取得指定貨幣對K線收盤價的iClose函數,並將最新條列的前一條作為標準,藉此計算目前線條的收盤價波動。在「LabelCreate(0, “Symbol” + IntegerToString(i), 0, 90, 20 + i * 16, CORNER_LEFT_UPPER, symbol);」下方新增以下編碼。
在執行除法時,若數字為0便會出現錯誤;為了避免在這樣的狀況下進行計算處理,使用continue來予以跳過。
double closePre = iClose(symbol, 0, 1);為了能夠將物件一次刪除,此處應先設定接頭辭。在檔案上方的屬性「property indicator_chart_window」下,使用「#define」來定義「PREFIX」。
if (closePre == 0) continue;
double ratio = (iClose(symbol, 0, 0) – closePre) / closePre * 100;
#define PREFIX MQLInfoString(MQL_PROGRAM_NAME) + “_”其後,在「Custom indicator initialization function」下方設定「Custom indicator deinit function」,以使用ObjectsDeleteAll函數刪除每一次的物件。
void OnDeinit(const int reason)如將「PREFIX」添加於顯示貨幣對的LabelCreate括弧中,便會在每一次都刪除含有「PREFIX」文字的物件。
{
ObjectsDeleteAll(0, PREFIX);
}
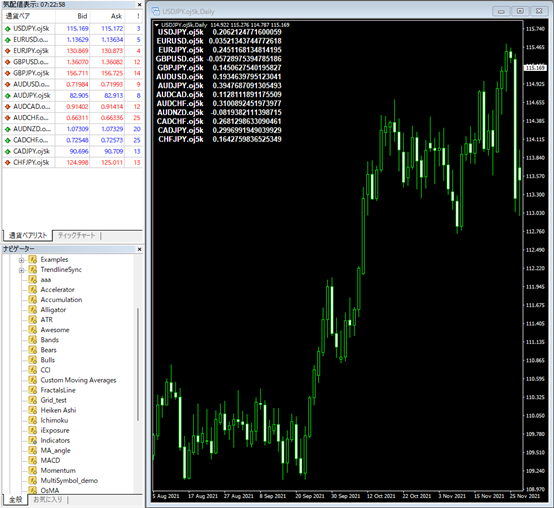
LabelCreate(0, PREFIX + “Symbol” + IntegerToString(i), 0, 90, 20 + i * 16, CORNER_LEFT_UPPER, symbol);此處完成之後,在「double ratio = (iClose(symbol, 0, 0) – closePre) / closePre * 100;」下方,添加以數值顯示計算結果的編碼。沿用顯示貨幣對名稱的LabelCreate,並如以下所示加以改寫。
LabelCreate(0, PREFIX + “Data” + IntegerToString(i), 0, 230, 20 + i * 16, CORNER_LEFT_UPPER, (string)ratio);如此進行編譯並確認圖表,將可見到計算結果顯示於貨幣對名稱旁。
用RECTANGLE LABEL來顯示條形圖
本次將以條形圖來顯示算出的價格波動比例。由於已不需要價格波動的比例顯示,故在「LabelCreate(0, PREFIX + “Data” + IntegerToString(i), 0, 230, 20 + i * 16, CORNER_LEFT_UPPER, (string)ratio);」開頭添加「//」予以指定。
接下來將於其下定義條形圖的長度。數值方面,使用絕對值的MathAbs函數,並將負數值變更為正數值。由於得出的數值變動比例極小,因此設定為100倍;此處的關鍵則是將其變換為整數型。
至於條形圖的顏色,可先將正數值比例設定為紅色、負數值則是藍色。
// LabelCreate(0, PREFIX + “Data” + IntegerToString(i), 0, 200, 20 + i * 16, CORNER_LEFT_UPPER, (string)ratio);本次將以「RECTANGLE LABEL」來製作條形圖,這是以XY座標指定的長方形物件。
int len = (int)MathAbs(ratio * 100);
color clr = ratio > 0 ? clrRed : clrDodgerBlue;
可從MQL4幫助檔中,複製並使用樣本編碼。點擊MQL4幫助檔目錄的「Constants, Enumerations and Structures」→「Objects Constants」→「Object Types」後,便可見到物件一覽;從中選擇「OBJ_RECTANGLE_LABEL」後,複製預先準備的「Create rectangle label」編碼,並貼至檔案的下方。
首先,從貼上編碼的if文體中,刪除不需要的「Print(__FUNCTION__,」以及「”: failed to create a rectangle label! Error code = “,GetLastError());」2行;並將此處「// flat border color (Flat)」的「clr = clrRed」變更為「clr = clrWhite」,讓顏色改為白色。
若在此結束,當價格出現變動時,條形圖的寬度也不會產生變化,因此需在if文體下方新增「ObjectSetInteger(chart_ID, name, OBJPROP_WIDTH, line_width);」,讓寬度的部分能夠改變。
//+——————————————————————+如此便完成了OBJ_RECTANGLE_LABEL的設定。
//| Create rectangle label |
//+——————————————————————+
bool RectLabelCreate(const long chart_ID=0, // chart’s ID
const string name=”RectLabel”, // label name
const int sub_window=0, // subwindow index
const int x=0, // X coordinate
const int y=0, // Y coordinate
const int width=50, // width
const int height=18, // height
const color back_clr=C’236,233,216′, // background color
const ENUM_BORDER_TYPE border=BORDER_SUNKEN, // border type
const ENUM_BASE_CORNER corner=CORNER_LEFT_UPPER, // chart corner for anchoring
const color clr=clrWhite, // flat border color (Flat)
const ENUM_LINE_STYLE style=STYLE_SOLID, // flat border style
const int line_width=1, // flat border width
const bool back=false, // in the background
const bool selection=false, // highlight to move
const bool hidden=true, // hidden in the object list
const long z_order=0) // priority for mouse click
{
//— reset the error value
ResetLastError();
//— create a rectangle label
if(!ObjectCreate(chart_ID,name,OBJ_RECTANGLE_LABEL,sub_window,0,0)) {
ObjectSetInteger(chart_ID, name, OBJPROP_WIDTH, line_width);
return(false);
}
//— set label coordinates
ObjectSetInteger(chart_ID,name,OBJPROP_XDISTANCE,x);
ObjectSetInteger(chart_ID,name,OBJPROP_YDISTANCE,y);
//— set label size
ObjectSetInteger(chart_ID,name,OBJPROP_XSIZE,width);
ObjectSetInteger(chart_ID,name,OBJPROP_YSIZE,height);
//— set background color
ObjectSetInteger(chart_ID,name,OBJPROP_BGCOLOR,back_clr);
//— set border type
ObjectSetInteger(chart_ID,name,OBJPROP_BORDER_TYPE,border);
//— set the chart’s corner, relative to which point coordinates are defined
ObjectSetInteger(chart_ID,name,OBJPROP_CORNER,corner);
//— set flat border color (in Flat mode)
ObjectSetInteger(chart_ID,name,OBJPROP_COLOR,clr);
//— set flat border line style
ObjectSetInteger(chart_ID,name,OBJPROP_STYLE,style);
//— set flat border width
ObjectSetInteger(chart_ID,name,OBJPROP_WIDTH,line_width);
//— display in the foreground (false) or background (true)
ObjectSetInteger(chart_ID,name,OBJPROP_BACK,back);
//— enable (true) or disable (false) the mode of moving the label by mouse
ObjectSetInteger(chart_ID,name,OBJPROP_SELECTABLE,selection);
ObjectSetInteger(chart_ID,name,OBJPROP_SELECTED,selection);
//— hide (true) or display (false) graphical object name in the object list
ObjectSetInteger(chart_ID,name,OBJPROP_HIDDEN,hidden);
//— set the priority for receiving the event of a mouse click in the chart
ObjectSetInteger(chart_ID,name,OBJPROP_ZORDER,z_order);
//— successful execution
return(true);
}
製作條形圖並繪製於圖表上
接下來,將利用此內容來製作條形圖。在OnCalculate函數下執行已設定的RectLabelCreate。物件名稱設定為「Graph」、X位置為「95」、Y位置為「14 + i * 16」、寬度為「len」、高度為「12」、陽線顏色為「紅」、陰線顏色則是「藍」。
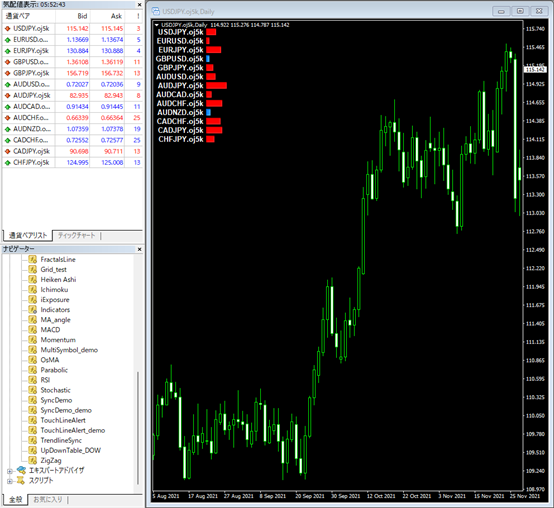
RectLabelCreate(0, PREFIX + “Graph” + IntegerToString(i), 0, 95, 14 + i * 16, len, 12, clr);進行編譯之後,便可見到價格波動的比例從數值變成了條形圖。
在提示框中顯示價格變動比例
在目前的狀況下,雖然僅有市場報價中的貨幣對資訊會顯示於圖表上,但若在參考價顯示中點擊右鍵、選擇「全部顯示」,便會出現能夠顯示的所有貨幣對名稱以及價格波動比例條形圖。至於尚未讀取的資訊,由於會需要處理時間來形成條形圖,因此會稍慢才出現。
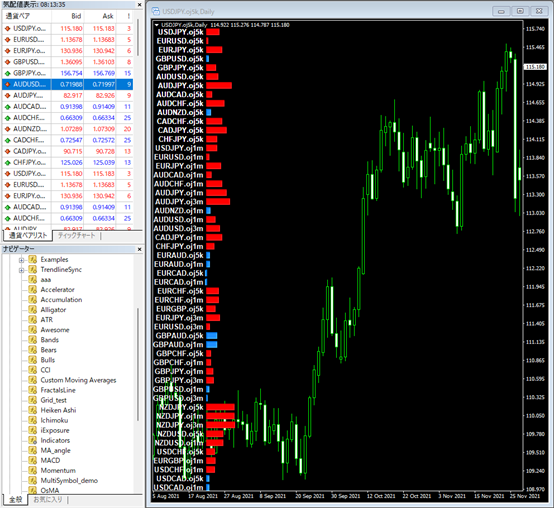
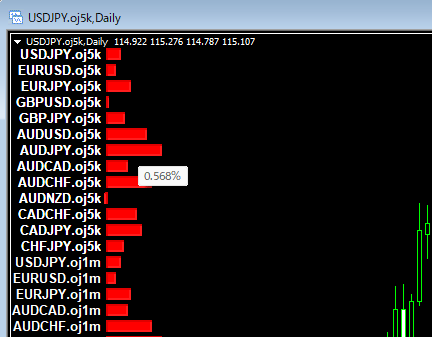
另外,若將游標移至物件上,便可在提示框中顯示價格波動比例的數值。本次的價格波動比例將顯示至小數點以下3位數,故在數值後方貼上「%」。在OnCalculate函數中「color clr = ratio > 0 ? clrRed : clrDodgerBlue;」的下方定義「tt」,並於括弧最後也新增「tt」作為RectLabelCreate參數。
string tt = DoubleToString(ratio, 3) + “%”;其後,在「Create rectangle label」的「// background color」下方新增以下公式作為「// tooltip」。「\n」的意義即是無初始值。
RectLabelCreate(0, PREFIX + “Graph” + IntegerToString(i), 0, 65, 14 + i * 16, len, 12, clr, tt);
const string tt = “\n”, // tooltip另外,在「ObjectSetInteger(chart_ID, name, OBJPROP_ZORDER, z_order);」下方,使用「ObjectSetString」來新增以下編碼。
ObjectSetString(chart_ID, name, OBJPROP_TOOLTIP, tt);如此進行編譯,即可確認各個價格變動的比例數值是否會顯示於提示框中。
原始碼
本次製作的原始碼如以下所示。//+——————————————————————+
//| MultiSymbol_demo.mq4 |
//| Copyright 2022, MetaQuotes Software Corp. |
//| https://www.mql5.com |
//+——————————————————————+
#property copyright “Copyright 2022, MetaQuotes Software Corp.”
#property link “https://www.mql5.com”
#property version “1.00”
#property strict
#property indicator_chart_window
#define PREFIX MQLInfoString(MQL_PROGRAM_NAME) + “_”
//+——————————————————————+
//| Custom indicator initialization function |
//+——————————————————————+
int OnInit()
{
//— indicator buffers mapping
//—
return(INIT_SUCCEEDED);
}
//+——————————————————————+
//| Custom indicator deinit function |
//+——————————————————————+
void OnDeinit(const int reason)
{
ObjectsDeleteAll(0, PREFIX);
}
//+——————————————————————+
//| Custom indicator iteration function |
//+——————————————————————+
int OnCalculate(const int rates_total,
const int prev_calculated,
const datetime &time[],
const double &open[],
const double &high[],
const double &low[],
const double &close[],
const long &tick_volume[],
const long &volume[],
const int &spread[])
{
//—
for(int i = 0; i < 1000; i++) {
string symbol = SymbolName(i, true);
if (symbol == NULL) break;
LabelCreate(0, PREFIX + “Symbol” + IntegerToString(i), 0, 90, 20 + i * 16, CORNER_LEFT_UPPER, symbol);
double closePre = iClose(symbol, 0, 1);
if (closePre == 0) continue;
double ratio = (iClose(symbol, 0, 0) – closePre) / closePre * 100;
// LabelCreate(0, PREFIX + “Data” + IntegerToString(i), 0, 230, 20 + i * 16, CORNER_LEFT_UPPER, (string)ratio);
int len = (int)MathAbs(ratio * 100);
color clr = ratio > 0 ? clrRed : clrDodgerBlue;
string tt = DoubleToString(ratio, 3) + “%”;
RectLabelCreate(0, PREFIX + “Graph” + IntegerToString(i), 0, 95, 14 + i * 16, len, 12, clr, tt);
}
//— return value of prev_calculated for next call
return(rates_total);
}
//+——————————————————————+
//| Create a text label |
//+——————————————————————+
bool LabelCreate(const long chart_ID=0, // chart’s ID
const string name=”Label”, // label name
const int sub_window=0, // subwindow index
const int x=0, // X coordinate
const int y=0, // Y coordinate
const ENUM_BASE_CORNER corner=CORNER_LEFT_UPPER, // chart corner for anchoring
const string text=”Label”, // text
const string font=”Arial Bold”, // font
const int font_size=10, // font size
const color clr=clrWhite, // color
const double angle=0.0, // text slope
const ENUM_ANCHOR_POINT anchor=ANCHOR_RIGHT, // anchor type
const bool back=false, // in the background
const bool selection=false, // highlight to move
const bool hidden=true, // hidden in the object list
const long z_order=0) // priority for mouse click
{
//— reset the error value
ResetLastError();
//— create a text label
if(!ObjectCreate(chart_ID,name,OBJ_LABEL,sub_window,0,0)){
return(false);
}
//— set label coordinates
ObjectSetInteger(chart_ID,name,OBJPROP_XDISTANCE,x);
ObjectSetInteger(chart_ID,name,OBJPROP_YDISTANCE,y);
//— set the chart’s corner, relative to which point coordinates are defined
ObjectSetInteger(chart_ID,name,OBJPROP_CORNER,corner);
//— set the text
ObjectSetString(chart_ID,name,OBJPROP_TEXT,text);
//— set text font
ObjectSetString(chart_ID,name,OBJPROP_FONT,font);
//— set font size
ObjectSetInteger(chart_ID,name,OBJPROP_FONTSIZE,font_size);
//— set the slope angle of the text
ObjectSetDouble(chart_ID,name,OBJPROP_ANGLE,angle);
//— set anchor type
ObjectSetInteger(chart_ID,name,OBJPROP_ANCHOR,anchor);
//— set color
ObjectSetInteger(chart_ID,name,OBJPROP_COLOR,clr);
//— display in the foreground (false) or background (true)
ObjectSetInteger(chart_ID,name,OBJPROP_BACK,back);
//— enable (true) or disable (false) the mode of moving the label by mouse
ObjectSetInteger(chart_ID,name,OBJPROP_SELECTABLE,selection);
ObjectSetInteger(chart_ID,name,OBJPROP_SELECTED,selection);
//— hide (true) or display (false) graphical object name in the object list
ObjectSetInteger(chart_ID,name,OBJPROP_HIDDEN,hidden);
//— set the priority for receiving the event of a mouse click in the chart
ObjectSetInteger(chart_ID,name,OBJPROP_ZORDER,z_order);
//— successful execution
return(true);
}
//+——————————————————————+
//| Create rectangle label |
//+——————————————————————+
bool RectLabelCreate(const long chart_ID=0, // chart’s ID
const string name=”RectLabel”, // label name
const int sub_window=0, // subwindow index
const int x=0, // X coordinate
const int y=0, // Y coordinate
const int width=50, // width
const int height=18, // height
const color back_clr=C’236,233,216′, // background color
const string tt = “\n”, // tooltip
const ENUM_BORDER_TYPE border=BORDER_SUNKEN, // border type
const ENUM_BASE_CORNER corner=CORNER_LEFT_UPPER, // chart corner for anchoring
const color clr=clrWhite, // flat border color (Flat)
const ENUM_LINE_STYLE style=STYLE_SOLID, // flat border style
const int line_width=1, // flat border width
const bool back=false, // in the background
const bool selection=false, // highlight to move
const bool hidden=true, // hidden in the object list
const long z_order=0) // priority for mouse click
{
//— reset the error value
ResetLastError();
//— create a rectangle label
if(!ObjectCreate(chart_ID,name,OBJ_RECTANGLE_LABEL,sub_window,0,0)) {
ObjectSetInteger(chart_ID, name, OBJPROP_WIDTH, line_width);
return(false);
}
//— set label coordinates
ObjectSetInteger(chart_ID,name,OBJPROP_XDISTANCE,x);
ObjectSetInteger(chart_ID,name,OBJPROP_YDISTANCE,y);
//— set label size
ObjectSetInteger(chart_ID,name,OBJPROP_XSIZE,width);
ObjectSetInteger(chart_ID,name,OBJPROP_YSIZE,height);
//— set background color
ObjectSetInteger(chart_ID,name,OBJPROP_BGCOLOR,back_clr);
//— set border type
ObjectSetInteger(chart_ID,name,OBJPROP_BORDER_TYPE,border);
//— set the chart’s corner, relative to which point coordinates are defined
ObjectSetInteger(chart_ID,name,OBJPROP_CORNER,corner);
//— set flat border color (in Flat mode)
ObjectSetInteger(chart_ID,name,OBJPROP_COLOR,clr);
//— set flat border line style
ObjectSetInteger(chart_ID,name,OBJPROP_STYLE,style);
//— set flat border width
ObjectSetInteger(chart_ID,name,OBJPROP_WIDTH,line_width);
//— display in the foreground (false) or background (true)
ObjectSetInteger(chart_ID,name,OBJPROP_BACK,back);
//— enable (true) or disable (false) the mode of moving the label by mouse
ObjectSetInteger(chart_ID,name,OBJPROP_SELECTABLE,selection);
ObjectSetInteger(chart_ID,name,OBJPROP_SELECTED,selection);
//— hide (true) or display (false) graphical object name in the object list
ObjectSetInteger(chart_ID,name,OBJPROP_HIDDEN,hidden);
//— set the priority for receiving the event of a mouse click in the chart
ObjectSetInteger(chart_ID,name,OBJPROP_ZORDER,z_order);
ObjectSetString(chart_ID, name, OBJPROP_TOOLTIP, tt);
//— successful execution
return(true);
}
將EA自動程式交易應用於外匯與差價合約交易中

我們以圖文形式詳細介紹有關EA自動程式交易的基本知識,以及在MT4/MT5平台上的安裝、參數設定方法、編碼等等內容。另外,對持有OANDA帳戶的客戶,還可以免費使用我們的獨有EA與指標工具。