【MQL編程基礎】|製作價差・時間差的測量工具
1.製作新檔案並定義前綴
本篇章節將說明如何製作工具,以透過游標的操作,來觀測並顯示圖表上的距離、價格與時間數值。為工具設定以下三項功能。其近似於MT4最早配備的Crosshair(十字線)工具。-
①在圖表上雙點擊以指定標準點,並透過游標拖曳測量。
②顯示雙點擊位置至滑鼠游標位置(測量點)之間的差。
③在標準點與測量點上顯示十字線等等。
由於本次將使用物件,因此要在檔案上方的屬性「#property indicator_chart_window」之下定義前綴「PREFIX」。此動作是為了能夠一次刪除製作的物件。
#define PREFIX “Measure_”另外,因會運用到游標的操作程序,故需在OnInit函數的「//— indicator buffers mapping」下方宣告「CHART_EVENT_MOUSE_MOVE」。
ChartSetInteger(0, CHART_EVENT_MOUSE_MOVE, true);
2.判斷游標的雙點擊
針對本次製作的工具,絕大多數的處理動作都會在OnChartEvent中進行。首先應建立檢測游標雙點擊的迴路。定義游標的X座標與Y座標,在位置並未偏離的狀態下,若按下游標兩次即會判斷為雙點擊。若是CHART_EVENT_MOUSE_MOVE,則為「lparam」顯示X座標、「dparam」顯示Y座標。利用「sparam」傳達判斷游標點擊左鍵或點擊右鍵的數值。
if (id == CHARTEVENT_MOUSE_MOVE) {另外,為了在一定時間內檢測游標按鍵的按壓動作,定義「count」以便記憶點擊與雙點擊的操作。
static int xPre, yPre;
int xNow = (int)lparam;
int yNow = (int)dparam;
static uint count;接下來,當sparam為「1」時設定點擊為「true」,若並非此狀態,則將點擊設定為「false」。在點擊狀態關閉時儲存游標的位置,並以「GetTickCount」記憶點擊的時間。GetTickCount是能將電腦自啟動所經過的時間,換算為毫秒單位的函數。
static bool click, dClick;
至於GetTickCount的處理時機,則設定為雙點擊並未成立時。而雙點擊的判定標準,是當「Now」與「Pre」都呈現相同不變的座標,並在開始計算的200(0.2秒)內於同一位置點擊兩下。
if (sparam == “1”) {
if (!click) {
if (xNow == xPre && yNow == yPre && GetTickCount() < count + 200) dClick = true;
if (!dClick) {
xPre = xNow;
yPre = yNow;
count = GetTickCount();
}
}
click = true;
} else {
click = false;
dClick = false;
}
3.取得游標的位置資訊
接下來,將製作雙點擊成立時的距離監測迴路。首先利用「ChartXYToTimePrice」,將游標位置的X座標、Y座標變更為時間資訊、價格資訊。一旦失敗便會在此處結束處理動作。f (dClick) {如此便會將雙點擊的位置資訊寫入time[0]與price[0],而目前的游標位置資訊則是寫入time[1] 與price[1] 。
datetime time[2];
double price[2];
int win = 0;
if (!ChartXYToTimePrice(0, xPre, yPre, win, time[0], price[0])) return;
if (!ChartXYToTimePrice(0, xNow, yNow, win, time[1], price[1])) return;
}
4.修改「OBJ_TREND」的範例編碼
在上述內容中,取得了雙點擊位置的資訊、以及目前的游標位置資訊。接下來,將利用該數值來顯示水平線、垂直線與趨勢線。可從MQL4幫助檔中,複製趨勢線的範例編碼。於MQL4相關參考目錄中點選「Constants, Enumerations and Structures」→「Objects Constants」→「Object Types」,便會顯示物件一覽表。從中選擇「OBJ_TREND」,並將預先準備的「Create a trend line by the given coordinates」編碼複製貼上於檔案的下方。
為了運用所有趨勢線、水平線與垂直線,將「// chart’s ID」的「TrendCreate」替換為「LineCreate」,「// line color」的「clr = clrRed」替換為「clr = clrWhite」,「// line style」的「style = STYLE_SOLID」替換為「style = STYLE_DOT」,「// highlight to move」的「selection = true」替換為「selection = false」。
其次,在「// line name」上方新增類型的參數「const int type = OBJ_TREND, // type」,「if(!ObjectCreate(chart_ID, name, OBJ_TREND, sub_window, time1, price1, time2, price2))」的「OBJ_TREND」變更為「type」以供指定。
另外,從「//— set anchor points’ coordinates if they are not set」至「ResetLastError();」為止的4行,以及「Print(__FUNCTION__,」「”: failed to create a trend line! Error code = “, GetLastError());」等2行皆不需使用,故可予以刪除。為了正確反映數值,在「if(!ObjectCreate(chart_ID, name, type, sub_window, time1, price1, time2, price2))」下方新增「ObjectMove(chart_ID, name, 0, time1, price1);」「ObjectMove(chart_ID, name, 1, time2, price2);」等2行。
接著,因希望隱藏工具提示(游標暫停時顯示的補充說明),故需在「ObjectSetInteger(chart_ID, name, OBJPROP_ZORDER, z_order);」下方新增「ObjectSetString(chart_ID, name, OBJPROP_TOOLTIP, “Wn”);」。
//+——————————————————————+
//| Create a trend line by the given coordinates |
//+——————————————————————+
bool LineCreate(const long chart_ID = 0, // chart’s ID
const int type = OBJ_TREND, // type
const string name = “TrendLine”, // line name
const int sub_window = 0, // subwindow index
datetime time1 = 0, // first point time
double price1 = 0, // first point price
datetime time2 = 0, // second point time
double price2 = 0, // second point price
const color clr = clrWhite, // line color
const ENUM_LINE_STYLE style = STYLE_DOT, // line style
const int width = 1, // line width
const bool back = false, // in the background
const bool selection = false, // highlight to move
const bool ray_right = false, // line’s continuation to the right
const bool hidden = true, // hidden in the object list
const long z_order = 0) // priority for mouse click
{
//— create a trend line by the given coordinates
if(!ObjectCreate(chart_ID, name, type, sub_window, time1, price1, time2, price2)) {
ObjectMove(chart_ID, name, 0, time1, price1);
ObjectMove(chart_ID, name, 1, time2, price2);
return(false);
}
//— set line color
ObjectSetInteger(chart_ID, name, OBJPROP_COLOR, clr);
//— set line display style
ObjectSetInteger(chart_ID, name, OBJPROP_STYLE, style);
//— set line width
ObjectSetInteger(chart_ID, name, OBJPROP_WIDTH, width);
//— display in the foreground (false) or background (true)
ObjectSetInteger(chart_ID, name, OBJPROP_BACK, back);
//— enable (true) or disable (false) the mode of moving the line by mouse
//— when creating a graphical object using ObjectCreate function, the object cannot be
//— highlighted and moved by default. Inside this method, selection parameter
//— is true by default making it possible to highlight and move the object
ObjectSetInteger(chart_ID, name, OBJPROP_SELECTABLE, selection);
ObjectSetInteger(chart_ID, name, OBJPROP_SELECTED, selection);
//— enable (true) or disable (false) the mode of continuation of the line’s display to the right
ObjectSetInteger(chart_ID, name, OBJPROP_RAY_RIGHT, ray_right);
//— hide (true) or display (false) graphical object name in the object list
ObjectSetInteger(chart_ID, name, OBJPROP_HIDDEN, hidden);
//— set the priority for receiving the event of a mouse click in the chart
ObjectSetInteger(chart_ID, name, OBJPROP_ZORDER, z_order);
ObjectSetString(chart_ID, name, OBJPROP_TOOLTIP, “\n”);
//— successful execution
return(true);
}
5.修改「OBJ_LABEL」的範例編碼
由於本次會以文字顯示,因此需準備Label物件的編碼。與趨勢線相同,可從MQL4幫助檔中複製範例編碼。於MQL4相關參考目錄中點選「Constants, Enumerations and Structures」→「Objects Constants」→「Object Types」,便會顯示物件一覽表。從中選擇「OBJ_LABEL」,並將預先準備的「Create a text label」編碼複製貼上於檔案的下方。
「//— reset the error value」「ResetLastError();」的2行,以及自「Print(__FUNCTION__,」至「return(false);」的3行皆不需使用,故可予以刪除。另外,將「if(!ObjectCreate(chart_ID, name, OBJ_LABEL, sub_window, 0, 0))」變更為「ObjectCreate(chart_ID, name, OBJ_LABEL, sub_window, 0, 0)」。
//+——————————————————————+
//| Create a text label |
//+——————————————————————+
bool LabelCreate(const long chart_ID = 0, // chart’s ID
const string name = “Label”, // label name
const int sub_window = 0, // subwindow index
const int x = 0, // X coordinate
const int y = 0, // Y coordinate
const ENUM_BASE_CORNER corner = CORNER_LEFT_UPPER, // chart corner for anchoring
const string text = “Label”, // text
const string font = “Arial”, // font
const int font_size = 10, // font size
const color clr = clrRed, // color
const double angle = 0.0, // text slope
const ENUM_ANCHOR_POINT anchor = ANCHOR_LEFT_UPPER, // anchor type
const bool back = false, // in the background
const bool selection = false, // highlight to move
const bool hidden = true, // hidden in the object list
const long z_order = 0) // priority for mouse click
{
//— create a text label
ObjectCreate(chart_ID, name, OBJ_LABEL, sub_window, 0, 0);
//— set label coordinates
ObjectSetInteger(chart_ID, name, OBJPROP_XDISTANCE, x);
ObjectSetInteger(chart_ID, name, OBJPROP_YDISTANCE, y);
//— set the chart’s corner, relative to which point coordinates are defined
ObjectSetInteger(chart_ID, name, OBJPROP_CORNER, corner);
//— set the text
ObjectSetString(chart_ID, name, OBJPROP_TEXT, text);
//— set text font
ObjectSetString(chart_ID, name, OBJPROP_FONT, font);
//— set font size
ObjectSetInteger(chart_ID, name, OBJPROP_FONTSIZE, font_size);
//— set the slope angle of the text
ObjectSetDouble(chart_ID, name, OBJPROP_ANGLE, angle);
//— set anchor type
ObjectSetInteger(chart_ID, name, OBJPROP_ANCHOR, anchor);
//— set color
ObjectSetInteger(chart_ID, name, OBJPROP_COLOR, clr);
//— display in the foreground (false) or background (true)
ObjectSetInteger(chart_ID, name, OBJPROP_BACK, back);
//— enable (true) or disable (false) the mode of moving the label by mouse
ObjectSetInteger(chart_ID, name, OBJPROP_SELECTABLE, selection);
ObjectSetInteger(chart_ID, name, OBJPROP_SELECTED, selection);
//— hide (true) or display (false) graphical object name in the object list
ObjectSetInteger(chart_ID, name, OBJPROP_HIDDEN, hidden);
//— set the priority for receiving the event of a mouse click in the chart
ObjectSetInteger(chart_ID, name, OBJPROP_ZORDER, z_order);
//— successful execution
return(true);
}
6.顯示水平線、垂直線與趨勢線
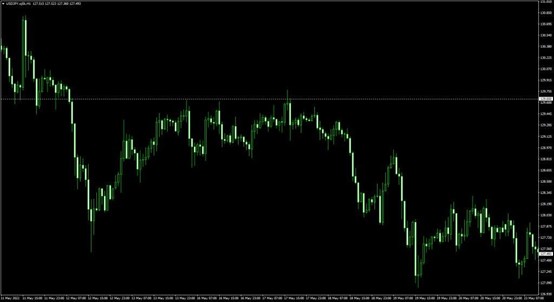
以下將嘗試使用LineCreate拉出線條。在OnChartEvent中的「if (!ChartXYToTimePrice(0, xNow, yNow, win, time[1], price[1])) return;」下方寫入下列編碼。「OBJ_HLINE」意指水平線。LineCreate(0, OBJ_HLINE, PREFIX + “HLine0”, 0, time[0], price[0], 0, 0);如此進行編譯並設定圖表,就會於圖表上雙點擊時顯示水平線。
此外,若希望在雙點擊拖曳結束時刪除相關物件,則需在「dClick = false;」下方新增以下編碼。
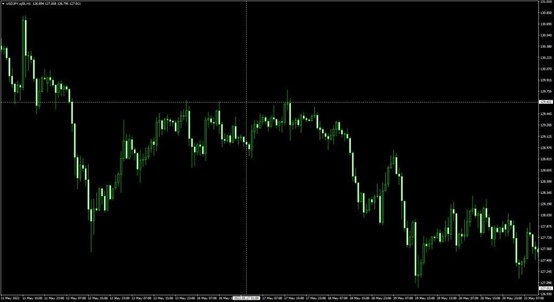
ObjectsDeleteAll(0, PREFIX);同樣設定垂直線的描繪動作。垂直線能夠以「OBJ_VLINE」顯示。
LineCreate(0, OBJ_VLINE, PREFIX + “VLine0”, 0, time[0], price[0], 0, 0);如此進行編譯並於圖表雙點擊,便可見到圖表上除了水平線之外,還會顯示垂直線。
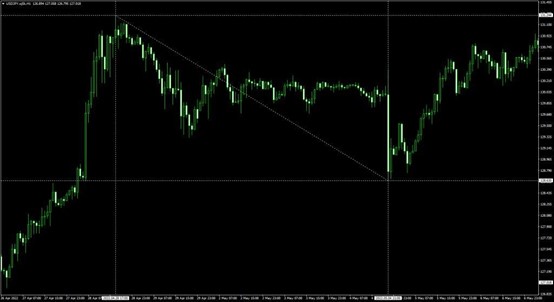
如欲在測量點的一側也拉出水平線與垂直線,則需追加該編碼。另外,能以「OBJ_TREND」顯示連接標準點與測量點的趨勢線。
LineCreate(0, OBJ_HLINE, PREFIX + “HLine1”, 0, time[1], price[1], 0, 0);如此進行編譯,並在圖表上雙點擊拖曳,即可顯示連結水平線、垂直線、標準點與測量點的趨勢線。
LineCreate(0, OBJ_VLINE, PREFIX + “VLine1”, 0, time[1], price[1], 0, 0);
LineCreate(0, OBJ_TREND, PREFIX + “Trend”, 0, time[0], price[0], time[1], price[1]);
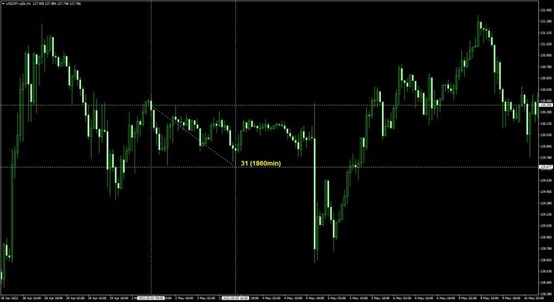
7.顯示標準點至測量點之間的條列數量與時間
在前述文章中,顯示了連結水平線、垂直線、標準點與測量點的趨勢線。接下來,將顯示標準點至測量點之間的K線數量與時間。K線數量使用「iBarShift」,並以time[0]減去time[1]得出。另一方面,由於希望以分鐘表示時間,故從 time[1]減去time[0]並除以60。
int bar = iBarShift(NULL, 0, time[0]) – iBarShift(NULL, 0, time[1]);顯示的型態則如同「K線數量(分鐘)」一般,在K線數量後方括弧標示時間。首先需定義「text」,再以LabelCreate顯示。為了避免與游標重疊,將X的位置以「xNow + 15」做出些微偏離。字體設定為「Arial Bold」、尺寸為「14」、顏色為「Yellow」。
int min = int(time[1] – time[0]) / 60;
string text = (string)bar + ” (” + (string)min + “min)”;如此進行編譯並拖曳圖表,就會顯示出標準點至測量點之間的K線數量與時間。
LabelCreate(0, PREFIX + “time”, 0, xNow + 15, yNow, CORNER_LEFT_UPPER, text, “Arial Bold”, 14, clrYellow, 0, ANCHOR_LEFT_LOWER);
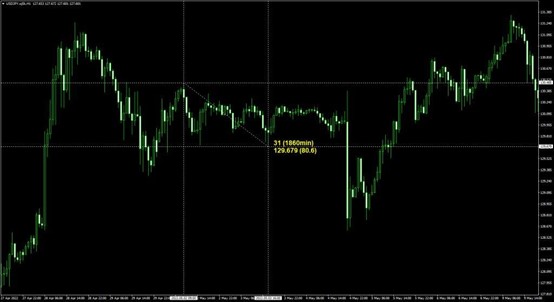
8.顯示游標位置的價格、以及標準點與測量點的價差
接下來,針對游標目前位置的價格、以及標準點與測量點之間的價差,將以「游標目前位置的價格(標準點與測量點之間的價差)」的形式加以顯示。使用「MathAbs」計算指定數值的絕對值,並在得出價差後以pips顯示。double deff = MathAbs(price[0] – price[1]) / 10 / _Point;與K線的數量與時間相同,以LabelCreate顯示價格。錨定設定為「ANCHOR_LEFT_UPPER」,並在K線的數量與時間下方,以縱向並列顯示。
text = DoubleToString(price[1], _Digits) + ” (” + DoubleToString(deff, 1) + “)”;
LabelCreate(0, PREFIX + “price”, 0, xNow + 15, yNow, CORNER_LEFT_UPPER, text, “Arial Bold”, 14, clrYellow, 0, ANCHOR_LEFT_UPPER);如此即可完成測量價差・時間差的工具。如此進行編譯並拖曳圖表,就會在K線的數量與時間下方顯示價格資訊。
9.原始碼
本次製作的原始碼如以下所示。//+——————————————————————+
//| MeasureTool.mq4 |
//| Copyright 2022, MetaQuotes Software Corp. |
//| https://www.mql5.com |
//+——————————————————————+
#property copyright “Copyright 2022, MetaQuotes Software Corp.”
#property link “https://www.mql5.com”
#property version “1.00”
#property strict
#property indicator_chart_window
#define PREFIX “Measure_”
//+——————————————————————+
//| Custom indicator initialization function |
//+——————————————————————+
int OnInit()
{
//— indicator buffers mapping
ChartSetInteger(0, CHART_EVENT_MOUSE_MOVE, true);
//—
return(INIT_SUCCEEDED);
}
//+——————————————————————+
//| Custom indicator iteration function |
//+——————————————————————+
int OnCalculate(const int rates_total,
const int prev_calculated,
const datetime &time[],
const double &open[],
const double &high[],
const double &low[],
const double &close[],
const long &tick_volume[],
const long &volume[],
const int &spread[])
{
//—
//— return value of prev_calculated for next call
return(rates_total);
}
//+——————————————————————+
//| ChartEvent function |
//+——————————————————————+
void OnChartEvent(const int id,
const long &lparam,
const double &dparam,
const string &sparam)
{
if (id == CHARTEVENT_MOUSE_MOVE) {
static int xPre, yPre;
int xNow = (int)lparam;
int yNow = (int)dparam;
static uint count;
static bool click, dClick;
if (sparam == “1”) {
if (!click) {
if (xNow == xPre && yNow == yPre && GetTickCount() < count + 200) dClick = true;
if (!dClick) {
xPre = xNow;
yPre = yNow;
count = GetTickCount();
}
}
click = true;
} else {
click = false;
dClick = false;
ObjectsDeleteAll(0, PREFIX);
}
if (dClick) {
datetime time[2];
double price[2];
int win = 0;
if (!ChartXYToTimePrice(0, xPre, yPre, win, time[0], price[0])) return;
if (!ChartXYToTimePrice(0, xNow, yNow, win, time[1], price[1])) return;
LineCreate(0, OBJ_HLINE, PREFIX + “HLine0”, 0, time[0], price[0], 0, 0);
LineCreate(0, OBJ_VLINE, PREFIX + “VLine0”, 0, time[0], price[0], 0, 0);
LineCreate(0, OBJ_HLINE, PREFIX + “HLine1”, 0, time[1], price[1], 0, 0);
LineCreate(0, OBJ_VLINE, PREFIX + “VLine1”, 0, time[1], price[1], 0, 0);
LineCreate(0, OBJ_TREND, PREFIX + “Trend”, 0, time[0], price[0], time[1], price[1]);
int bar = iBarShift(NULL, 0, time[0]) – iBarShift(NULL, 0, time[1]);
int min = int(time[1] – time[0]) / 60;
string text = (string)bar + ” (” + (string)min + “min)”;
LabelCreate(0, PREFIX + “time”, 0, xNow + 15, yNow, CORNER_LEFT_UPPER, text, “Arial Bold”, 14, clrYellow, 0, ANCHOR_LEFT_LOWER);
double deff = MathAbs(price[0] – price[1]) / 10 / _Point;
text = DoubleToString(price[1], _Digits) + ” (” + DoubleToString(deff, 1) + “)”;
LabelCreate(0, PREFIX + “price”, 0, xNow + 15, yNow, CORNER_LEFT_UPPER, text, “Arial Bold”, 14, clrYellow, 0, ANCHOR_LEFT_UPPER);
}
}
}
//+——————————————————————+
//| Create a trend line by the given coordinates |
//+——————————————————————+
bool LineCreate(const long chart_ID = 0, // chart’s ID
const int type = OBJ_TREND, // type
const string name = “TrendLine”, // line name
const int sub_window = 0, // subwindow index
datetime time1 = 0, // first point time
double price1 = 0, // first point price
datetime time2 = 0, // second point time
double price2 = 0, // second point price
const color clr = clrWhite, // line color
const ENUM_LINE_STYLE style = STYLE_DOT, // line style
const int width = 1, // line width
const bool back = false, // in the background
const bool selection = false, // highlight to move
const bool ray_right = false, // line’s continuation to the right
const bool hidden = true, // hidden in the object list
const long z_order = 0) // priority for mouse click
{
//— create a trend line by the given coordinates
if(!ObjectCreate(chart_ID, name, type, sub_window, time1, price1, time2, price2)) {
ObjectMove(chart_ID, name, 0, time1, price1);
ObjectMove(chart_ID, name, 1, time2, price2);
return(false);
}
//— set line color
ObjectSetInteger(chart_ID, name, OBJPROP_COLOR, clr);
//— set line display style
ObjectSetInteger(chart_ID, name, OBJPROP_STYLE, style);
//— set line width
ObjectSetInteger(chart_ID, name, OBJPROP_WIDTH, width);
//— display in the foreground (false) or background (true)
ObjectSetInteger(chart_ID, name, OBJPROP_BACK, back);
//— enable (true) or disable (false) the mode of moving the line by mouse
//— when creating a graphical object using ObjectCreate function, the object cannot be
//— highlighted and moved by default. Inside this method, selection parameter
//— is true by default making it possible to highlight and move the object
ObjectSetInteger(chart_ID, name, OBJPROP_SELECTABLE, selection);
ObjectSetInteger(chart_ID, name, OBJPROP_SELECTED, selection);
//— enable (true) or disable (false) the mode of continuation of the line’s display to the right
ObjectSetInteger(chart_ID, name, OBJPROP_RAY_RIGHT, ray_right);
//— hide (true) or display (false) graphical object name in the object list
ObjectSetInteger(chart_ID, name, OBJPROP_HIDDEN, hidden);
//— set the priority for receiving the event of a mouse click in the chart
ObjectSetInteger(chart_ID, name, OBJPROP_ZORDER, z_order);
ObjectSetString(chart_ID, name, OBJPROP_TOOLTIP, “\n”);
//— successful execution
return(true);
}
//+——————————————————————+
//| Create a text label |
//+——————————————————————+
bool LabelCreate(const long chart_ID = 0, // chart’s ID
const string name = “Label”, // label name
const int sub_window = 0, // subwindow index
const int x = 0, // X coordinate
const int y = 0, // Y coordinate
const ENUM_BASE_CORNER corner = CORNER_LEFT_UPPER, // chart corner for anchoring
const string text = “Label”, // text
const string font = “Arial”, // font
const int font_size = 10, // font size
const color clr = clrRed, // color
const double angle = 0.0, // text slope
const ENUM_ANCHOR_POINT anchor = ANCHOR_LEFT_UPPER, // anchor type
const bool back = false, // in the background
const bool selection = false, // highlight to move
const bool hidden = true, // hidden in the object list
const long z_order = 0) // priority for mouse click
{
//— create a text label
ObjectCreate(chart_ID, name, OBJ_LABEL, sub_window, 0, 0);
//— set label coordinates
ObjectSetInteger(chart_ID, name, OBJPROP_XDISTANCE, x);
ObjectSetInteger(chart_ID, name, OBJPROP_YDISTANCE, y);
//— set the chart’s corner, relative to which point coordinates are defined
ObjectSetInteger(chart_ID, name, OBJPROP_CORNER, corner);
//— set the text
ObjectSetString(chart_ID, name, OBJPROP_TEXT, text);
//— set text font
ObjectSetString(chart_ID, name, OBJPROP_FONT, font);
//— set font size
ObjectSetInteger(chart_ID, name, OBJPROP_FONTSIZE, font_size);
//— set the slope angle of the text
ObjectSetDouble(chart_ID, name, OBJPROP_ANGLE, angle);
//— set anchor type
ObjectSetInteger(chart_ID, name, OBJPROP_ANCHOR, anchor);
//— set color
ObjectSetInteger(chart_ID, name, OBJPROP_COLOR, clr);
//— display in the foreground (false) or background (true)
ObjectSetInteger(chart_ID, name, OBJPROP_BACK, back);
//— enable (true) or disable (false) the mode of moving the label by mouse
ObjectSetInteger(chart_ID, name, OBJPROP_SELECTABLE, selection);
ObjectSetInteger(chart_ID, name, OBJPROP_SELECTED, selection);
//— hide (true) or display (false) graphical object name in the object list
ObjectSetInteger(chart_ID, name, OBJPROP_HIDDEN, hidden);
//— set the priority for receiving the event of a mouse click in the chart
ObjectSetInteger(chart_ID, name, OBJPROP_ZORDER, z_order);
//— successful execution
return(true);
}
將EA自動程式交易應用於外匯與差價合約交易中

我們以圖文形式詳細介紹有關EA自動程式交易的基本知識,以及在MT4/MT5平台上的安裝、參數設定方法、編碼等等內容。另外,對持有OANDA帳戶的客戶,還可以免費使用我們的獨有EA與指標工具。