製作重疊顯示Tick圖與1分鐘K線的自動交易程式
新增匯入Tick資訊與時間資訊的緩衝器
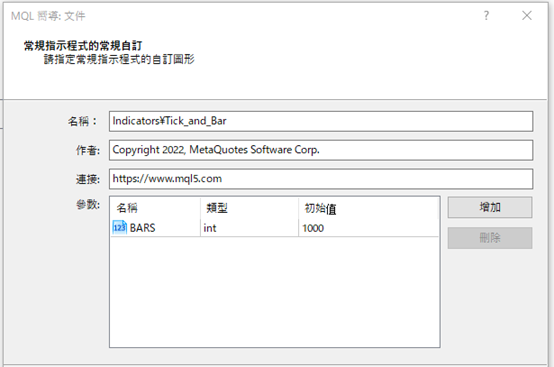
本文將說明如何在副窗口中重疊顯示Tick圖與1分鐘K線。首先介紹如何顯示Tick圖。首先,在製作新檔案時選擇「自訂指標」,並將檔案命名為「Tick_and_Bar」。參數將可指定計算K線的數量。名稱應為「BARS」、初始值為「1000」。
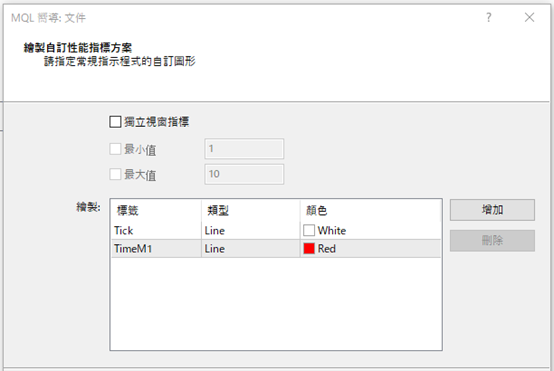
在「自訂指標程式的事件處理常式」中,「OnTimer」「OnChartEvent」皆無需勾選,直接進入下一步,並在「繪製自訂性能指標方案」設定中,登錄含有數據的兩個緩衝器。
一個是匯入Tick資訊的緩衝器,標籤為「Tick」、顏色為「White」,另一個是匯入時間資訊的緩衝器,標籤為「TimeM1」、顏色為「Red」。如此點擊「完成」即可呈現雛形。
開啟新檔案時,將修正上方的屬性。首先,將「indicator_chart_window」變更為「indicator_separate_window」,以便顯示於副窗口中。
#property indicator_ separate _window接下來,由於不需顯示記憶時間資訊的「TimeM1」,因此樣式(type)的「DRAW_LINE」改變為「DRAW_NONE」,並刪除其下的「color」「style」「width」3行。本次將使用元件,故為了能夠一次刪除,應先定義接頭詞的「PREFIX」。
#property indicator_type2 DRAW_NONE另外,由於緩衝器的名稱過長,可如「TickBuffer」→「Tick」將「Buffer」省略予以縮短。
#define PREFIX MQLInfoString(MQL_PROGRAM_NAME) + “_”
double Tick[];同樣地,用於 OnInit函數中的緩衝器名稱也能如下所示來變更。
double TimeM1[];
SetIndexBuffer(0,Tick);
SetIndexBuffer(1,TimeM1);
在副窗口中顯示Tick圖
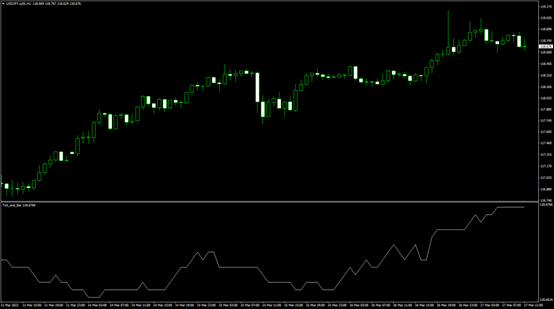
接下來將嘗試在副窗口中顯示Tick圖。在OnCalculate函數下方寫入計算公式。計算的K線數量指定為較少的「BARS」或「Bars-2」。首先,雖然要在「Tick[0]」中寫入「Bid」,但每次寫入時,若不移動一個緩衝器,則相同的數值將會逐漸遭到改寫。因此應輸入1根K線之前的數值。這樣移動每1根K線的處理過程,將會在Tick[0]含有數據時執行。
int limit = MathMin(BARS, Bars – 2);如此進行編譯並設定圖表,便會在副窗口中顯示K線圖。
if (Tick[0] != EMPTY_VALUE) {
for (int i = limit; i > 0; i–) {
Tick[i] = Tick[i – 1];
}
}
Tick[0] = Bid;
新增「TimeM1」的相關公式
以同樣的方式,新增匯入時間資訊的「TimeM1」內容。在「TimeM1[0]」中匯入1分鐘K線的時間,並在每次進行時刪除元件。另外,也應先重設「limit+1」以顯示範圍外的數值。int limit = MathMin(BARS, Bars – 2);
if (Tick[0] != EMPTY_VALUE) {
for (int i = limit; i > 0; i–) {
Tick[i] = Tick[i – 1];
TimeM1[i] = TimeM1[i – 1];
}
}
Tick[0] = Bid;
TimeM1[0] = (double)iTime(NULL, PERIOD_M1, 0);
Tick[limit + 1] = EMPTY_VALUE;
TimeM1[limit + 1] = EMPTY_VALUE;
ObjectsDeleteAll(0, PREFIX);
取得1分鐘K線的4個價格
目前已在副窗口中顯示Tick圖,並完成了重疊1分鐘K線的準備工作。接下來,將利用緩衝器來繪製1分鐘的K線。首先使用if文體,讓「TimeM1」數值為空白時不會執行處理。接下來以「iBarShift」顯示1分鐘K線的編號,藉以分別取得4個價格。
for (int i = limit; i >= 0; i–) {此處應定義K線的顏色。將陽線設為紅色、陰線為藍色。
if (TimeM1[i] == EMPTY_VALUE) continue;
int bar = iBarShift(NULL, PERIOD_M1, (datetime)TimeM1[i]);
double op = iOpen(NULL, PERIOD_M1, bar);
double cl = iClose(NULL, PERIOD_M1, bar);
double hi = iHigh(NULL, PERIOD_M1, bar);
double lo = iLow(NULL, PERIOD_M1, bar);
color clr = clrWhite;
if (cl > op) clr = clrRed;
else if (cl < op) clr = clrBlue;
沿用元件的範例編碼
接下來將使用if文體,在與先前的K線相比之下、當1分鐘K線的資訊出現變化時繪製新K線,若相同則會更新資訊。if (TimeM1[i] != TimeM1[i + 1]) {首先,將寫入1分鐘K線的資訊與先前K線不同時的處理過程。每次描繪新K線時,將利用元件的趨勢線與矩形,因此可從MQL4幫助檔中複製範例編碼加以使用。
} else {
}
在MQL4幫助檔的目錄中點選「Constants, Enumerations and Structures」→「Objects Constants」→「Object Types」,即可看見元件一覽。從中選擇「OBJ_TREND」,並將預先準備的「Create a trend line by the given coordinates」編碼複製貼上於檔案下方。
同樣地,從元件一覽中選擇「OBJ_RECTANGLE」,並複製「Create rectangle by the given coordinates」編碼複製貼至檔案下方。
如兩者皆欲設定背景,可將「// in the background」的「back = false」變成「back = true」。因無需進行選擇,故將「// highlight to move」的「selection = true」改為「selection = false」。
另外,趨勢線的「//— set anchor points’ coordinates if they are not set」到「ResetLastError();」4行、「Print(__FUNCTION__,」「”: failed to create a trend line! Error code = “, GetLastError());」兩行、矩形的「//— set anchor points’ coordinates if they are not set」到「ResetLastError();」4行、以及「Print(__FUNCTION__,」「”: failed to create a rectangle! Error code = “, GetLastError());」兩行皆無需使用,可予以刪除。
//+——————————————————————+如此進行編譯並點擊圖表,K線的顏色就會自左邊移至右邊。
//| Create a trend line by the given coordinates |
//+——————————————————————+
bool TrendCreate(const long chart_ID = 0, // chart’s ID
const string name = “TrendLine”, // line name
const int sub_window = 0, // subwindow index
datetime time1 = 0, // first point time
double price1 = 0, // first point price
datetime time2 = 0, // second point time
double price2 = 0, // second point price
const color clr = clrRed, // line color
const ENUM_LINE_STYLE style = STYLE_SOLID, // line style
const int width = 1, // line width
const bool back = true, // in the background
const bool selection = false, // highlight to move
const bool ray_right = false, // line’s continuation to the right
const bool hidden = true, // hidden in the object list
const long z_order = 0) // priority for mouse click
{
//— create a trend line by the given coordinates
if(!ObjectCreate(chart_ID, name, OBJ_TREND, sub_window, time1, price1, time2, price2)) { return(false);
}
//— set line color
ObjectSetInteger(chart_ID, name, OBJPROP_COLOR, clr);
//— set line display style
ObjectSetInteger(chart_ID, name, OBJPROP_STYLE, style);
//— set line width
ObjectSetInteger(chart_ID, name, OBJPROP_WIDTH, width);
//— display in the foreground (false) or background (true)
ObjectSetInteger(chart_ID, name, OBJPROP_BACK, back);
//— enable (true) or disable (false) the mode of moving the line by mouse
//— when creating a graphical object using ObjectCreate function, the object cannot be
//— highlighted and moved by default. Inside this method, selection parameter
//— is true by default making it possible to highlight and move the object
ObjectSetInteger(chart_ID, name, OBJPROP_SELECTABLE, selection);
ObjectSetInteger(chart_ID, name, OBJPROP_SELECTED, selection);
//— enable (true) or disable (false) the mode of continuation of the line’s display to the right
ObjectSetInteger(chart_ID, name, OBJPROP_RAY_RIGHT, ray_right);
//— hide (true) or display (false) graphical object name in the object list
ObjectSetInteger(chart_ID, name, OBJPROP_HIDDEN, hidden);
//— set the priority for receiving the event of a mouse click in the chart
ObjectSetInteger(chart_ID, name, OBJPROP_ZORDER, z_order);
//— successful execution
return(true);
}
//+——————————————————————+
//| Create rectangle by the given coordinates |
//+——————————————————————+
bool RectangleCreate(const long chart_ID = 0, // chart’s ID
const string name = “Rectangle”, // rectangle name
const int sub_window = 0, // subwindow index
datetime time1 = 0, // first point time
double price1 = 0, // first point price
datetime time2 = 0, // second point time
double price2 = 0, // second point price
const color clr = clrRed, // rectangle color
const ENUM_LINE_STYLE style = STYLE_SOLID, // style of rectangle lines
const int width = 1, // width of rectangle lines
const bool fill = false, // filling rectangle with color
const bool back = true, // in the background
const bool selection = false, // highlight to move
const bool hidden = true, // hidden in the object list
const long z_order = 0) // priority for mouse click
{
//— create a rectangle by the given coordinates
if(!ObjectCreate(chart_ID, name, OBJ_RECTANGLE, sub_window, time1, price1, time2, price2)) {
return(false);
}
//— set rectangle color
ObjectSetInteger(chart_ID, name, OBJPROP_COLOR, clr);
//— set the style of rectangle lines
ObjectSetInteger(chart_ID, name, OBJPROP_STYLE, style);
//— set width of the rectangle lines
ObjectSetInteger(chart_ID, name, OBJPROP_WIDTH, width);
//— enable (true) or disable (false) the mode of filling the rectangle
ObjectSetInteger(chart_ID, name, OBJPROP_FILL, fill);
//— display in the foreground (false) or background (true)
ObjectSetInteger(chart_ID, name, OBJPROP_BACK, back);
//— enable (true) or disable (false) the mode of highlighting the rectangle for moving
//— when creating a graphical object using ObjectCreate function, the object cannot be
//— highlighted and moved by default. Inside this method, selection parameter
//— is true by default making it possible to highlight and move the object
ObjectSetInteger(chart_ID, name, OBJPROP_SELECTABLE, selection);
ObjectSetInteger(chart_ID, name, OBJPROP_SELECTED, selection);
//— hide (true) or display (false) graphical object name in the object list
ObjectSetInteger(chart_ID, name, OBJPROP_HIDDEN, hidden);
//— set the priority for receiving the event of a mouse click in the chart
ObjectSetInteger(chart_ID, name, OBJPROP_ZORDER, z_order);
//— successful execution
return(true);
}
以元件繪製1分鐘K線
在中間段落中,說明了如何設定趨勢線與矩形來繪製1分鐘K線。以下將運用這些元件來繪製1分鐘K線。首先以矩形寫入1分鐘K線的實體。先定義「name」、名稱為「name + “Body”」,副窗口的部分、使用以「ChartWindowFind」設定指標的副窗口編號,時間為「Time[i]」、價格為開盤價至收盤價、顏色為則是已定義的顏色。
string name = PREFIX + (string)bar + “_”;接下來是趨勢線。名稱為「name + “Pin”」、價格為開盤價至收盤價,其他則與矩形相同。
RectangleCreate(0, name + “Body”, ChartWindowFind(), Time[i], op, Time[i], cl, clr);
TrendCreate(0, name + “Pin”, ChartWindowFind(), Time[i], hi, Time[i], lo, clr);接下來,將寫入當1分鐘K線的資訊與先前相同時的處理過程。為了更新K線的資訊,使用「ObjectMove」變更元件的座標。至於價格的部分,顯示實體的「Body」為收盤價,顯示影線的「Pin」則反應最高價與最低價。
因要將影線繪製於實體的中央,故在for文體上添加「int barStart = 0;」、並在「TrendCreate(0, name + “Pin”, ChartWindowFind(), Time[i], hi, Time[i], lo, clr);」下添加「barStart = i;」,預先記憶K線最初出現的位置。自K線最初出現處,加上目前的位置再除以2,便是實體的中央部位,故將於該處繪製影線。
ObjectMove(0, name + “Body”, 1, Time[i], cl);另外,使用「ObjectSetInteger」指定實體與影線的顏色。
ObjectMove(0, name + “Pin”, 0, Time[(barStart + i) / 2], hi);
ObjectMove(0, name + “Pin”, 1, Time[(barStart + i) / 2], lo);
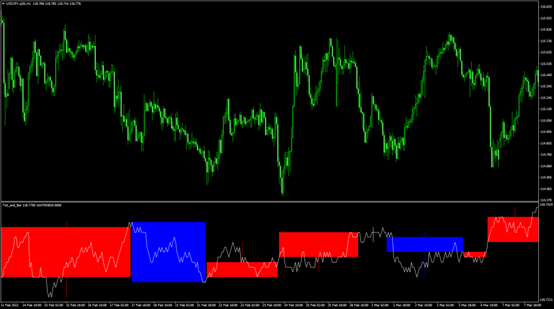
ObjectSetInteger(0, name + “Body”, OBJPROP_COLOR, clr);如此進行編譯,子視窗的點線圖上便會重疊顯示1分鐘K線。
ObjectSetInteger(0, name + “Pin”, OBJPROP_COLOR, clr);
以元件繪製1分鐘線條
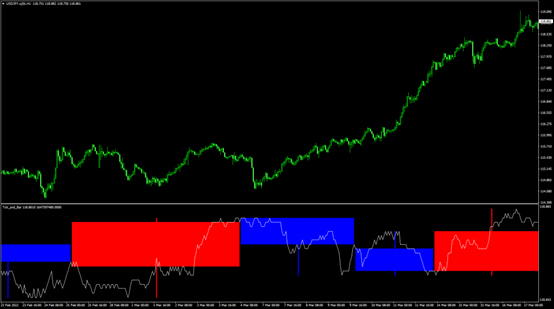
當開盤價與收盤價一致時,實體(矩形)的高度將會變成0,如此便無法顯示十字線。因此應當開盤價等於收盤價時,應在收盤價加上最低價波動點(若為美元/日圓便是0.1錢)的一半,並顯示十字線。添加下列if文體於「ObjectMove(0, name + “Body”, 1, Time[i], cl);」上方。if (cl ==op) cl += _Point / 2;另外,由於目前的影線過細,可將其寬度增加。將趨勢線「// line width」的初始值從「width = 1」變成「width = 3」。
const int width = 3, // line width接著進行編譯即可完成。如此重疊顯示Tick圖與1分鐘K線,即可仔細確認1分鐘線條的內容。在操作以秒為單位的買賣時,將可作為實用的指標。
原始碼
本次製作的原始碼如以下所示。//+——————————————————————+
//| Tick_and_Bar.mq4 |
//| Copyright 2022, MetaQuotes Software Corp. |
//| https://www.mql5.com |
//+——————————————————————+
#property copyright “Copyright 2022, MetaQuotes Software Corp.”
#property link “https://www.mql5.com”
#property version “1.00”
#property strict
#property indicator_separate_window
#property indicator_buffers 2
#property indicator_plots 2
//— plot Tick
#property indicator_label1 “Tick”
#property indicator_type1 DRAW_LINE
#property indicator_color1 clrWhite
#property indicator_style1 STYLE_SOLID
#property indicator_width1 1
//— plot TimeM1
#property indicator_label2 “TimeM1”
#property indicator_type2 DRAW_NONE
#define PREFIX MQLInfoString(MQL_PROGRAM_NAME) + “_”
//— input parameters
input int BARS = 1000;
//— indicator buffers
double Tick[];
double TimeM1[];
//+——————————————————————+
//| Custom indicator initialization function |
//+——————————————————————+
int OnInit()
{
//— indicator buffers mapping
SetIndexBuffer(0, Tick);
SetIndexBuffer(1, TimeM1);
//—
return(INIT_SUCCEEDED);
}
//+——————————————————————+
//| Custom indicator iteration function |
//+——————————————————————+
int OnCalculate(const int rates_total,
const int prev_calculated,
const datetime &time[],
const double &open[],
const double &high[],
const double &low[],
const double &close[],
const long &tick_volume[],
const long &volume[],
const int &spread[])
{
//—
int limit = MathMin(BARS, Bars – 2);
if (Tick[0] != EMPTY_VALUE) {
for (int i = limit; i > 0; i–) {
Tick[i] = Tick[i – 1];
TimeM1[i] = TimeM1[i – 1];
}
}
Tick[0] = Bid;
TimeM1[0] = (double)iTime(NULL, PERIOD_M1, 0);
Tick[limit + 1] = EMPTY_VALUE;
TimeM1[limit + 1] = EMPTY_VALUE;
ObjectsDeleteAll(0, PREFIX);
int barStart = 0;
for (int i = limit; i >= 0; i–) {
if (TimeM1[i] == EMPTY_VALUE) continue;
int bar = iBarShift(NULL, PERIOD_M1, (datetime)TimeM1[i]);
double op = iOpen(NULL, PERIOD_M1, bar);
double cl = iClose(NULL, PERIOD_M1, bar);
double hi = iHigh(NULL, PERIOD_M1, bar);
double lo = iLow(NULL, PERIOD_M1, bar);
color clr = clrWhite;
if (cl > op) clr = clrRed;
else if (cl < op) clr = clrBlue;
string name = PREFIX + (string)bar + “_”;
if (TimeM1[i] != TimeM1[i + 1]) {
RectangleCreate(0, name + “Body”, ChartWindowFind(), Time[i], op, Time[i], cl, clr);
TrendCreate(0, name + “Pin”, ChartWindowFind(), Time[i], hi, Time[i], lo, clr);
barStart = i;
} else {
if (cl ==op) cl += _Point / 2;
ObjectMove(0, name + “Body”, 1, Time[i], cl);
ObjectMove(0, name + “Pin”, 0, Time[(barStart + i) / 2], hi);
ObjectMove(0, name + “Pin”, 1, Time[(barStart + i) / 2], lo);
ObjectSetInteger(0, name + “Body”, OBJPROP_COLOR, clr);
ObjectSetInteger(0, name + “Pin”, OBJPROP_COLOR, clr);
}
}
//— return value of prev_calculated for next call
return(rates_total);
}
//+——————————————————————+
//| Create a trend line by the given coordinates |
//+——————————————————————+
bool TrendCreate(const long chart_ID = 0, // chart’s ID
const string name = “TrendLine”, // line name
const int sub_window = 0, // subwindow index
datetime time1 = 0, // first point time
double price1 = 0, // first point price
datetime time2 = 0, // second point time
double price2 = 0, // second point price
const color clr = clrRed, // line color
const ENUM_LINE_STYLE style = STYLE_SOLID, // line style
const int width = 3, // line width
const bool back = true, // in the background
const bool selection = false, // highlight to move
const bool ray_right = false, // line’s continuation to the right
const bool hidden = true, // hidden in the object list
const long z_order = 0) // priority for mouse click
{
//— create a trend line by the given coordinates
if(!ObjectCreate(chart_ID, name, OBJ_TREND, sub_window, time1, price1, time2, price2)) {
return(false);
}
//— set line color
ObjectSetInteger(chart_ID, name, OBJPROP_COLOR, clr);
//— set line display style
ObjectSetInteger(chart_ID, name, OBJPROP_STYLE, style);
//— set line width
ObjectSetInteger(chart_ID, name, OBJPROP_WIDTH, width);
//— display in the foreground (false) or background (true)
ObjectSetInteger(chart_ID, name, OBJPROP_BACK, back);
//— enable (true) or disable (false) the mode of moving the line by mouse
//— when creating a graphical object using ObjectCreate function, the object cannot be
//— highlighted and moved by default. Inside this method, selection parameter
//— is true by default making it possible to highlight and move the object
ObjectSetInteger(chart_ID, name, OBJPROP_SELECTABLE, selection);
ObjectSetInteger(chart_ID, name, OBJPROP_SELECTED, selection);
//— enable (true) or disable (false) the mode of continuation of the line’s display to the right
ObjectSetInteger(chart_ID, name, OBJPROP_RAY_RIGHT, ray_right);
//— hide (true) or display (false) graphical object name in the object list
ObjectSetInteger(chart_ID, name, OBJPROP_HIDDEN, hidden);
//— set the priority for receiving the event of a mouse click in the chart
ObjectSetInteger(chart_ID, name, OBJPROP_ZORDER, z_order);
//— successful execution
return(true);
}
//+——————————————————————+
//| Create rectangle by the given coordinates |
//+——————————————————————+
bool RectangleCreate(const long chart_ID = 0, // chart’s ID
const string name = “Rectangle”, // rectangle name
const int sub_window = 0, // subwindow index
datetime time1 = 0, // first point time
double price1 = 0, // first point price
datetime time2 = 0, // second point time
double price2 = 0, // second point price
const color clr = clrRed, // rectangle color
const ENUM_LINE_STYLE style = STYLE_SOLID, // style of rectangle lines
const int width = 1, // width of rectangle lines
const bool fill = false, // filling rectangle with color
const bool back = true, // in the background
const bool selection = false, // highlight to move
const bool hidden = true, // hidden in the object list
const long z_order = 0) // priority for mouse click
{
//— create a rectangle by the given coordinates
if(!ObjectCreate(chart_ID, name, OBJ_RECTANGLE, sub_window, time1, price1, time2, price2)) {
return(false);
}
//— set rectangle color
ObjectSetInteger(chart_ID, name, OBJPROP_COLOR, clr);
//— set the style of rectangle lines
ObjectSetInteger(chart_ID, name, OBJPROP_STYLE, style);
//— set width of the rectangle lines
ObjectSetInteger(chart_ID, name, OBJPROP_WIDTH, width);
//— enable (true) or disable (false) the mode of filling the rectangle
ObjectSetInteger(chart_ID, name, OBJPROP_FILL, fill);
//— display in the foreground (false) or background (true)
ObjectSetInteger(chart_ID, name, OBJPROP_BACK, back);
//— enable (true) or disable (false) the mode of highlighting the rectangle for moving
//— when creating a graphical object using ObjectCreate function, the object cannot be
//— highlighted and moved by default. Inside this method, selection parameter
//— is true by default making it possible to highlight and move the object
ObjectSetInteger(chart_ID, name, OBJPROP_SELECTABLE, selection);
ObjectSetInteger(chart_ID, name, OBJPROP_SELECTED, selection);
//— hide (true) or display (false) graphical object name in the object list
ObjectSetInteger(chart_ID, name, OBJPROP_HIDDEN, hidden);
//— set the priority for receiving the event of a mouse click in the chart
ObjectSetInteger(chart_ID, name, OBJPROP_ZORDER, z_order);
//— successful execution
return(true);
}
將EA自動程式交易應用於外匯與差價合約交易中

我們以圖文形式詳細介紹有關EA自動程式交易的基本知識,以及在MT4/MT5平台上的安裝、參數設定方法、編碼等等內容。另外,對持有OANDA帳戶的客戶,還可以免費使用我們的獨有EA與指標工具。