製作依照方向改變顏色的移動平均線的自動交易程式
登錄三個緩衝器
在本章節當中,將說明如何製作依照方向改變顏色的移動平均線(MA:Moving Average)。首先介紹使用指標緩衝器的基本製作方式。在製作新檔案時選擇「自訂指標」,並將檔案命名為「ColorfulMA_Normal」並新增參數。名稱設定為「PERIOD」、初始值為「5」。此處為了易於辨認MA的顏色變化,因故設定較為短暫的時間。
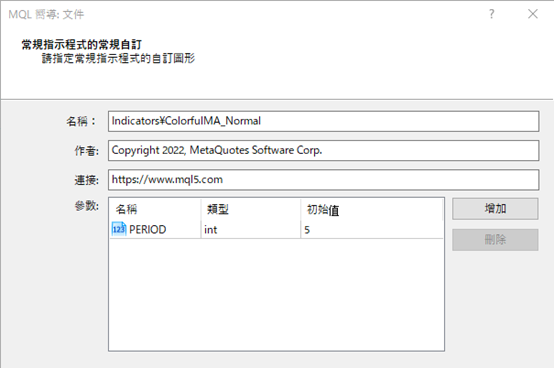
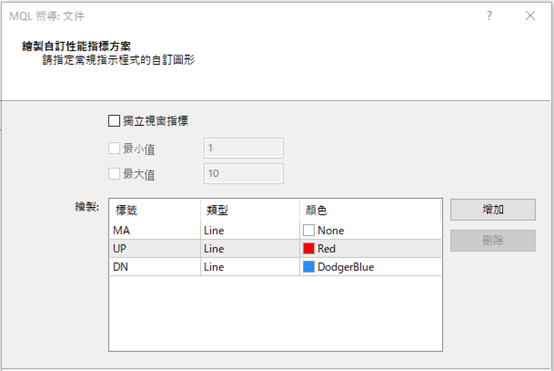
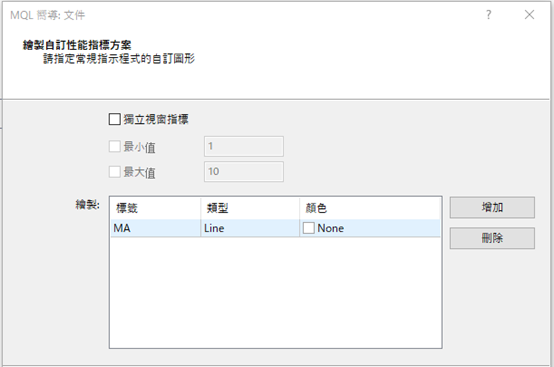
在「自訂指標程式的事件處理常式」中,無需勾選「OnTimer」「OnChartEvent」便點擊下一步。在「客製化指標的繪圖屬性」設定欄中,登錄含有MA數據的三個緩衝器。
●第一個是計算用的緩衝器,因此不會顯示。標籤設定為「MA」、顏色為「None」。
●第二個是上升用的緩衝器,標籤設定為「UP」、顏色為「Red」。
●第三個是下降用的緩衝器,標籤設定為「DN」、顏色為「DodgerBlue」。如此點擊「完成」即可呈現雛形。
計算MA並將數值匯入緩衝器
開啟新檔案時,將修正上方的屬性。由於「MA」的部分並不會如前文顯示,因此將樣式(type)從「DRAW_LINE」改變為「DRAW_NONE」。另外,為了使MA易於辨認,將「UP」與「DN」的寬度(width)從「1」變成「2」。//--- plot MA接下來,在OnCalculate函數下方寫入MA的計算公式,並將MA的緩衝器如下列所示加以定義。樣式為簡單移動平均線,適用價格則是收盤價。
#property indicator_label1 “MA”
#property indicator_type1 DRAW_NONE
#property indicator_style1 STYLE_SOLID
#property indicator_width1 1
//--- plot UP
#property indicator_label2 “UP”
#property indicator_type2 DRAW_LINE
#property indicator_color2 clrRed
#property indicator_style2 STYLE_SOLID
#property indicator_width2 2
//--- plot DN
#property indicator_label3 “DN”
#property indicator_type3 DRAW_LINE
#property indicator_color3 clrDodgerBlue
#property indicator_style3 STYLE_SOLID
#property indicator_width3 2
int limit = Bars - prev_calculated - 2;如此計算出的MA數值便會匯入於緩衝器中。
for (int i = limit; i >= 0; i--) {
MABuffer[i] = iMA(NULL, 0, PERIOD, 0, MODE_SMA, PRICE_CLOSE, i);
利用匯入的資訊顯示MA
接下來,將利用匯入緩衝器的資訊,以if文體組合成上升、下降的條件。若比前1根K線有所上升,便在「UPBuffer」中輸入數值。若只有1將無法畫出線條,故此處的重點便是以「i+1」在1根K線之前輸入數值。與前1根K線相比,若並未出現上升,則在「DNBuffer」緩衝器中輸入數值。
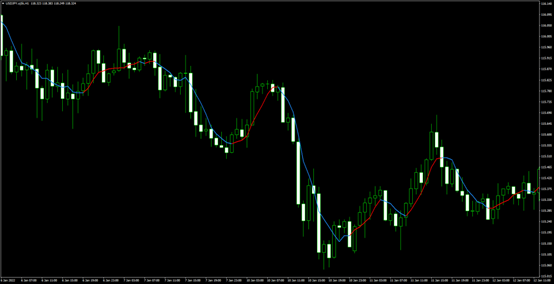
if (MABuffer[i] > MABuffer[i + 1]) {如此進行編譯並設定圖表,便會出現在向上時呈現紅色、向下時呈現藍色的MA。
UPBuffer[i] = MABuffer[i];
UPBuffer[i + 1] = MABuffer[i + 1];
} else {
DNBuffer[i] = MABuffer[i];
DNBuffer[i + 1] = MABuffer[i + 1];
}
使用元件解決問題
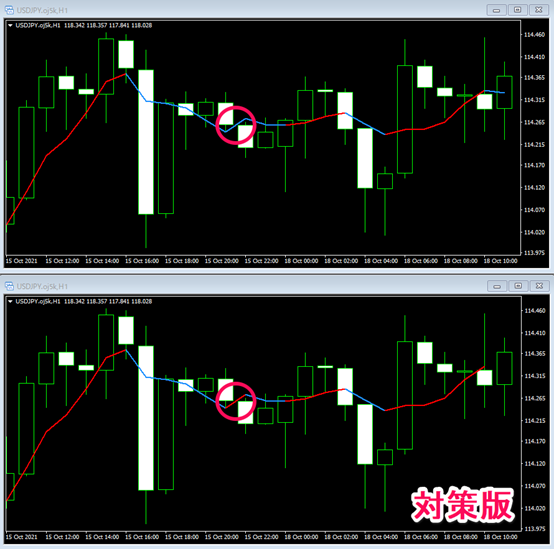
目前已能夠顯示依方向改變顏色的移動平均線(MA:Moving Average)。但是,有些部分的 MA雖然呈現上升,卻沒有變為紅色。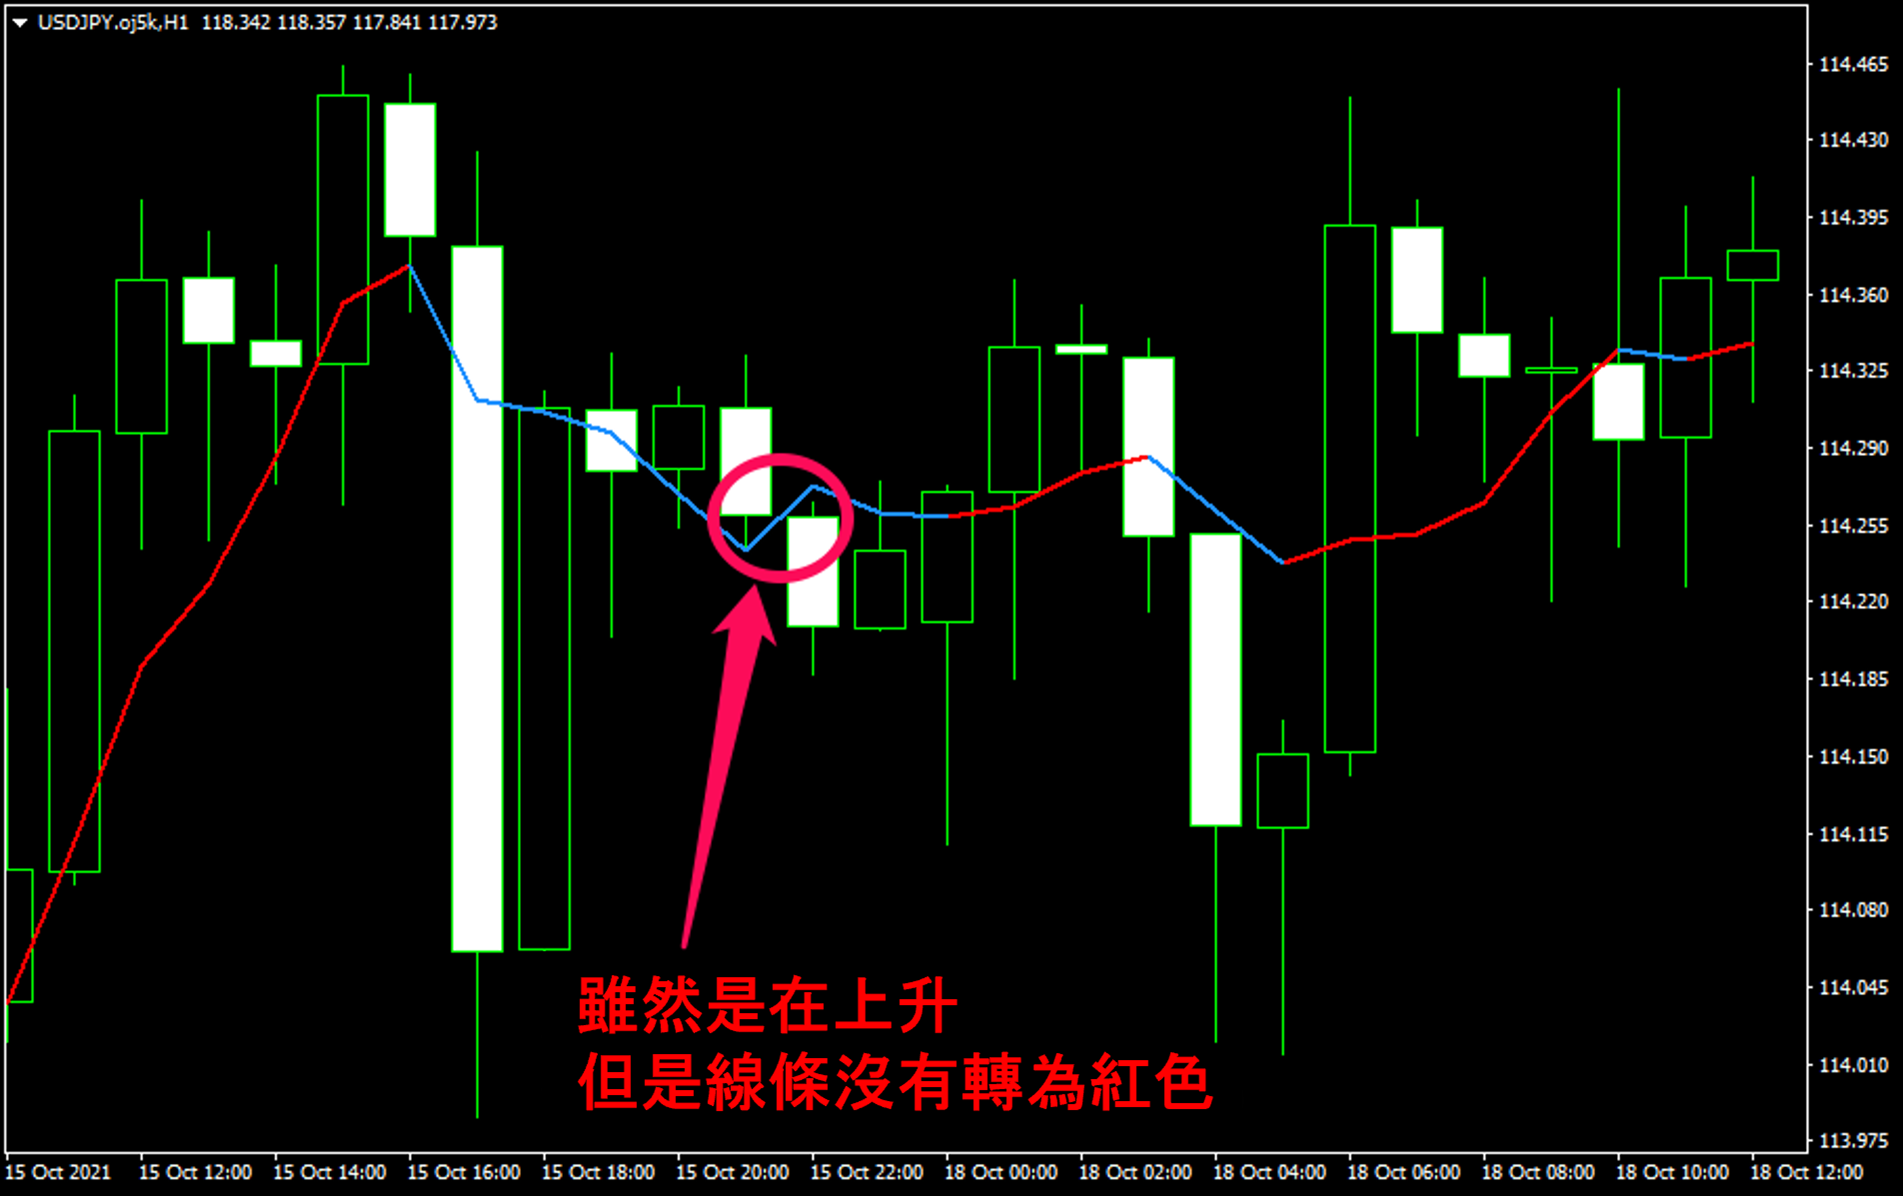
造成此現象的原因在於前後皆為下降傾向。雖然實際上是上升,但由於前後皆為下降,因此數值被納入於下降用的緩衝器,進而使線條呈現下降的顏色。以下將介紹如何運用元件來解決此問題。
為了製作問題對策的指標,必須再度製作新檔案。
在製作新檔案時選擇「客製化指標」,並將檔案命名為「ColorfulMA」新增參數。與前一次相同,名稱設定為「PERIOD」、初始值為「5」。
本次將使用「OnChartEvent」。在「客製化指標的事件處理程序」畫面點選「OnChartEvent」,並在下一個畫面中登錄一個緩衝器。標籤設定為「MA」、顏色為「None」。如此點擊「完成」即可呈現雛形。
首先,將新檔案上方定義的「MA」樣式(type)從「DRAW_LINE」改變為「DRAW_NONE」。
//--- plot MA至於MA的計算公式,則與先前製作的「ColorfulMA_Normal」相同,因此可將其複製並貼至OnCalculate的參數之下。
#property indicator_label1 “MA”
#property indicator_type1 DRAW_NONE
#property indicator_style1 STYLE_SOLID
#property indicator_width1 1
int limit = Bars - prev_calculated - 2;
for (int i = limit; i >= 0; i--) {
MABuffer[i] = iMA(NULL, 0, PERIOD, 0, MODE_SMA, PRICE_CLOSE, i);
}
利用「MABuffer」數值決定顏色
此處將在「ChartEvent function」下方使用趨勢線,並製作繪製MA的程式。首先運用ObjectsDeleteAll函數記載重設元件的編碼。void DrawMA()接下來,為了指定K線的搜尋範圍,應取得顯示於圖表中的K線資訊。
{
ObjectsDeleteAll(0, “MA_”);
}
「CHART_FIRST_VISIBLE_BAR」會顯示圖表左邊的K線,若自該處減去顯示圖表所有K線數的「CHART_WIDTH_IN_BARS」,便會呈現右邊的數值。
若計算結果為負數,將會呈現「0」。
int barF = (int)ChartGetInteger(0, CHART_FIRST_VISIBLE_BAR);接著將使用得出的K線加以計算。如欲依照上升與下降來改變顏色,可利用「MABuffer」數值來決定。本次將顯示三種顏色,持平為「白」、上升為「紅」、下降為「藍」。
int barR = barF - (int)ChartGetInteger(0, CHART_WIDTH_IN_BARS);
if (barR < 0) barR = 0;
for (int i = barF; i > barR; i--) {
color clr = clrWhite;
if (MABuffer[i] > MABuffer[i + 1]) clr = clrRed;
else if (MABuffer[i] < MABuffer[i + 1]) clr = clrDodgerBlue;
}
使用趨勢線繪製MA
接下來將使用趨勢線來顯示MA。從MQL4幫助檔中複製趨勢線的範例編碼加以使用。
在MQL4幫助檔的目錄中點選「Constants, Enumerations and Structures」→「Objects Constants」→「Object Types」,即可看見元件一覽。從中選擇「OBJ_TREND」,並將預先準備的「Create a trend line by the given coordinates」編碼複製貼上於檔案下方。
從「//--- set anchor points’ coordinates if they are not set」至「ResetLastError();」的4行以及「Print(__FUNCTION__,」「”: failed to create a trend line! Error code = “, GetLastError());」兩行皆無需使用,可予以刪除。
另外,如欲將線條加寬,可將上方的「// line width」從「width = 1」改成「width = 2」。由於無需進行選擇,故「// highlight to move」可從「selection = true」修改為「selection = false」。
//+------------------------------------------------------------------+
//| Create a trend line by the given coordinates |
//+------------------------------------------------------------------+
bool TrendCreate(const long chart_ID = 0, // chart’s ID
const string name = “TrendLine”, // line name
const int sub_window = 0, // subwindow index
datetime time1 = 0, // first point time
double price1 = 0, // first point price
datetime time2 = 0, // second point time
double price2 = 0, // second point price
const color clr = clrRed, // line color
const ENUM_LINE_STYLE style = STYLE_SOLID, // line style
const int width = 2, // line width
const bool back = false, // in the background
const bool selection = false, // highlight to move
const bool ray_right = false, // line’s continuation to the right
const bool hidden = true, // hidden in the object list
const long z_order = 0) // priority for mouse click
{
//--- create a trend line by the given coordinates
if(!ObjectCreate(chart_ID, name, OBJ_TREND, sub_window, time1, price1, time2, price2)) { return(false);
}
//--- set line color
ObjectSetInteger(chart_ID, name, OBJPROP_COLOR, clr);
//--- set line display style
ObjectSetInteger(chart_ID, name, OBJPROP_STYLE, style);
//--- set line width
ObjectSetInteger(chart_ID, name, OBJPROP_WIDTH, width);
//--- display in the foreground (false) or background (true)
ObjectSetInteger(chart_ID, name, OBJPROP_BACK, back);
//--- enable (true) or disable (false) the mode of moving the line by mouse
//--- when creating a graphical object using ObjectCreate function, the object cannot be
//--- highlighted and moved by default. Inside this method, selection parameter
//--- is true by default making it possible to highlight and move the object
ObjectSetInteger(chart_ID, name, OBJPROP_SELECTABLE, selection);
ObjectSetInteger(chart_ID, name, OBJPROP_SELECTED, selection);
//--- enable (true) or disable (false) the mode of continuation of the line’s display to the right
ObjectSetInteger(chart_ID, name, OBJPROP_RAY_RIGHT, ray_right);
//--- hide (true) or display (false) graphical object name in the object list
ObjectSetInteger(chart_ID, name, OBJPROP_HIDDEN, hidden);
//--- set the priority for receiving the event of a mouse click in the chart
ObjectSetInteger(chart_ID, name, OBJPROP_ZORDER, z_order);
//--- successful execution
return(true);
}
比較最初製作的MA與問題對策版MA
在DrawMA()的「else if (MABuffer[i] < MABuffer[i + 1]) clr = clrDodgerBlue;」下方叫出設定的TrendCreate。第1個時間點為「Time[i]」、價格為「MABuffer[i]」。第2個時間點與價格則分別加上1,設定為「Time[i+1]」、「MABuffer[i +1]」。TrendCreate(0, “MA_” + (string)i, 0, Time[i], MABuffer[i], Time[i + 1], MABuffer[i + 1], clr);最後在OnCalculate函數下方輸入製作的DrawMA()。
int OnCalculate(const int rates_total,另外,若希望在圖表出現變化時同步顯示,可在OnChartEvent函數中增加下列if文體。
const int prev_calculated,
const datetime &time[],
const double &open[],
const double &high[],
const double &low[],
const double &close[],
const long &tick_volume[],
const long &volume[],
const int &spread[])
{
//---
int limit = Bars - prev_calculated - 2;
for (int i = limit; i >= 0; i--) {
MABuffer[i] = iMA(NULL, 0, PERIOD, 0, MODE_SMA, PRICE_CLOSE, i);
}
DrawMA();
//--- return value of prev_calculated for next call
return(rates_total);
}
if (id == CHARTEVENT_CHART_CHANGE) DrawMA();如此進行編譯、設定圖表,並與最初的MA加以比較。畫面上方是最初製作的指標「ColorfulMA_Normal」、下方則是作為問題對策的指標「ColorfulMA」。在ColorfulMA中,可以見到前後皆為下降的上升部分也確實變成了紅色。
原始碼
本次製作的兩個原始碼如以下所示。ColorfulMA_Normal
//+------------------------------------------------------------------+
//| ColorfulMA_Normal.mq4 |
//| Copyright 2022, MetaQuotes Software Corp. |
//| https://www.mql5.com |
//+------------------------------------------------------------------+
#property copyright “Copyright 2022, MetaQuotes Software Corp.”
#property link “https://www.mql5.com”
#property version “1.00”
#property strict
#property indicator_chart_window
#property indicator_buffers 3
#property indicator_plots 3
//--- plot MA
#property indicator_label1 “MA”
#property indicator_type1 DRAW_NONE
#property indicator_style1 STYLE_SOLID
#property indicator_width1 1
//--- plot UP
#property indicator_label2 “UP”
#property indicator_type2 DRAW_LINE
#property indicator_color2 clrRed
#property indicator_style2 STYLE_SOLID
#property indicator_width2 2
//--- plot DN
#property indicator_label3 “DN”
#property indicator_type3 DRAW_LINE
#property indicator_color3 clrDodgerBlue
#property indicator_style3 STYLE_SOLID
#property indicator_width3 2
//--- input parameters
input int PERIOD = 5;
//--- indicator buffers
double MABuffer[];
double UPBuffer[];
double DNBuffer[];
//+------------------------------------------------------------------+
//| Custom indicator initialization function |
//+------------------------------------------------------------------+
int OnInit()
{
//--- indicator buffers mapping
SetIndexBuffer(0, MABuffer);
SetIndexBuffer(1, UPBuffer);
SetIndexBuffer(2, DNBuffer);
//---
return(INIT_SUCCEEDED);
}
//+------------------------------------------------------------------+
//| Custom indicator iteration function |
//+------------------------------------------------------------------+
int OnCalculate(const int rates_total,
const int prev_calculated,
const datetime &time[],
const double &open[],
const double &high[],
const double &low[],
const double &close[],
const long &tick_volume[],
const long &volume[],
const int &spread[])
{
//---
int limit = Bars - prev_calculated - 2;
for (int i = limit; i >= 0; i--) {
MABuffer[i] = iMA(NULL, 0, PERIOD, 0, MODE_SMA, PRICE_CLOSE, i);
if (MABuffer[i] > MABuffer[i + 1]) {
UPBuffer[i] = MABuffer[i];
UPBuffer[i + 1] = MABuffer[i + 1];
} else {
DNBuffer[i] = MABuffer[i];
DNBuffer[i + 1] = MABuffer[i + 1];
}
}
//--- return value of prev_calculated for next call
return(rates_total);
}
ColorfulMA
//+------------------------------------------------------------------+
//| ColorfulMA.mq4 |
//| Copyright 2022, MetaQuotes Software Corp. |
//| https://www.mql5.com |
//+------------------------------------------------------------------+
#property copyright “Copyright 2022, MetaQuotes Software Corp.”
#property link “https://www.mql5.com”
#property version “1.00”
#property strict
#property indicator_chart_window
#property indicator_buffers 1
#property indicator_plots 1
//--- plot MA
#property indicator_label1 “MA”
#property indicator_type1 DRAW_NONE
#property indicator_style1 STYLE_SOLID
#property indicator_width1 1
//--- input parameters
input int PERIOD = 5;
//--- indicator buffers
double MABuffer[];
//+------------------------------------------------------------------+
//| Custom indicator initialization function |
//+------------------------------------------------------------------+
int OnInit()
{
//--- indicator buffers mapping
SetIndexBuffer(0, MABuffer);
//---
return(INIT_SUCCEEDED);
}
//+------------------------------------------------------------------+
//| Custom indicator iteration function |
//+------------------------------------------------------------------+
int OnCalculate(const int rates_total,
const int prev_calculated,
const datetime &time[],
const double &open[],
const double &high[],
const double &low[],
const double &close[],
const long &tick_volume[],
const long &volume[],
const int &spread[])
{
//---
int limit = Bars - prev_calculated - 2;
for (int i = limit; i >= 0; i--) {
MABuffer[i] = iMA(NULL, 0, PERIOD, 0, MODE_SMA, PRICE_CLOSE, i);
}
DrawMA();
//--- return value of prev_calculated for next call
return(rates_total);
}
//+------------------------------------------------------------------+
//| ChartEvent function |
//+------------------------------------------------------------------+
void OnChartEvent(const int id,
const long &lparam,
const double &dparam,
const string &sparam)
{
//---
if (id == CHARTEVENT_CHART_CHANGE) DrawMA();
}
//+------------------------------------------------------------------+
//| ChartEvent function |
//+------------------------------------------------------------------+
void DrawMA()
{
ObjectsDeleteAll(0, “MA_”);
int barF = (int)ChartGetInteger(0, CHART_FIRST_VISIBLE_BAR);
int barR = barF - (int)ChartGetInteger(0, CHART_WIDTH_IN_BARS);
if (barR < 0) barR = 0;
for (int i = barF; i > barR; i--) {
color clr = clrWhite;
if (MABuffer[i] > MABuffer[i + 1]) clr = clrRed;
else if (MABuffer[i] < MABuffer[i + 1]) clr = clrDodgerBlue;
TrendCreate(0, “MA_” + (string)i, 0, Time[i], MABuffer[i], Time[i + 1], MABuffer[i + 1], clr);
}
}
//+------------------------------------------------------------------+
//| Create a trend line by the given coordinates |
//+------------------------------------------------------------------+
bool TrendCreate(const long chart_ID = 0, // chart’s ID
const string name = “TrendLine”, // line name
const int sub_window = 0, // subwindow index
datetime time1 = 0, // first point time
double price1 = 0, // first point price
datetime time2 = 0, // second point time
double price2 = 0, // second point price
const color clr = clrRed, // line color
const ENUM_LINE_STYLE style = STYLE_SOLID, // line style
const int width = 2, // line width
const bool back = false, // in the background
const bool selection = false, // highlight to move
const bool ray_right = false, // line’s continuation to the right
const bool hidden = true, // hidden in the object list
const long z_order = 0) // priority for mouse click
{
//--- create a trend line by the given coordinates
if(!ObjectCreate(chart_ID, name, OBJ_TREND, sub_window, time1, price1, time2, price2)) {
return(false);
}
//--- set line color
ObjectSetInteger(chart_ID, name, OBJPROP_COLOR, clr);
//--- set line display style
ObjectSetInteger(chart_ID, name, OBJPROP_STYLE, style);
//--- set line width
ObjectSetInteger(chart_ID, name, OBJPROP_WIDTH, width);
//--- display in the foreground (false) or background (true)
ObjectSetInteger(chart_ID, name, OBJPROP_BACK, back);
//--- enable (true) or disable (false) the mode of moving the line by mouse
//--- when creating a graphical object using ObjectCreate function, the object cannot be
//--- highlighted and moved by default. Inside this method, selection parameter
//--- is true by default making it possible to highlight and move the object
ObjectSetInteger(chart_ID, name, OBJPROP_SELECTABLE, selection);
ObjectSetInteger(chart_ID, name, OBJPROP_SELECTED, selection);
//--- enable (true) or disable (false) the mode of continuation of the line’s display to the right
ObjectSetInteger(chart_ID, name, OBJPROP_RAY_RIGHT, ray_right);
//--- hide (true) or display (false) graphical object name in the object list
ObjectSetInteger(chart_ID, name, OBJPROP_HIDDEN, hidden);
//--- set the priority for receiving the event of a mouse click in the chart
ObjectSetInteger(chart_ID, name, OBJPROP_ZORDER, z_order);
//--- successful execution
return(true);
}
將EA自動程式交易應用於外匯與差價合約交易中

我們以圖文形式詳細介紹有關EA自動程式交易的基本知識,以及在MT4/MT5平台上的安裝、參數設定方法、編碼等等內容。另外,對持有OANDA帳戶的客戶,還可以免費使用我們的獨有EA與指標工具。