運用ATR製作波動判別工具的方法|在圖表上繪製×標記的方式
1.沿用趨勢線的範例編碼
在「以ATR製作波動判別工具的方法|數值的顯示方式與變更顯示顏色的方法」文章中,說明了如何在圖表左下方顯示ATR數值、以及定義圖表四角的時間與價格資訊。接下來,將在圖表上使用趨勢線來繪製×標記。可從MQL4幫助檔中,複製使用趨勢線的範例編碼。於MQL4幫助檔目錄中點選「Constants, Enumerations and Structures」→「Objects Constants」→「Object Types」,便會顯示物件一覽表。從中選擇「OBJ_TREND」,並將預先準備的「Create a trend line by the given coordinates」編碼複製貼上於檔案的下方。
刪除「//— set anchor points’ coordinates if they are not set」與「ChangeTrendEmptyPoints(time1,price1,time2,price2);」兩行,並將「Print(__FUNCTION__,」與「”: failed to create a trend line! Error code = “, GetLastError());」兩行以「/*」「*/」作為註解。其次,使用「ObjectMove」以反映數值變化。在「return(false);」上方添加「ObjectMove(chart_ID, name, 0, time1, price1);」「ObjectMove(chart_ID, name, 1, time2, price2);」兩行,便能同時指定時間資訊與價格資訊。
另外,應變更兩處預設值。在「// in the background」將「back = false」變更為「back = true」、以及在「// highlight to move」將「selection = true」變更為「selection = false」。
//+——————————————————————+
//| Create a trend line by the given coordinates |
//+——————————————————————+
bool TrendCreate(const long chart_ID = 0, // chart’s ID
const string name = “TrendLine”, // line name
const int sub_window = 0, // subwindow index
datetime time1 = 0, // first point time
double price1 = 0, // first point price
datetime time2 = 0, // second point time
double price2 = 0, // second point price
const color clr = clrRed, // line color
const ENUM_LINE_STYLE style = STYLE_SOLID, // line style
const int width = 1, // line width
const bool back = true, // in the background
const bool selection = false, // highlight to move
const bool ray_right = false, // line’s continuation to the right
const bool hidden = true, // hidden in the object list
const long z_order = 0) // priority for mouse click
{
//— reset the error value
ResetLastError();
//— create a trend line by the given coordinates
if(!ObjectCreate(chart_ID, name, OBJ_TREND, sub_window, time1, price1, time2, price2)) {
/* Print(__FUNCTION__,
“: failed to create a trend line! Error code = “,GetLastError());*/
ObjectMove(chart_ID, name, 0, time1, price1);
ObjectMove(chart_ID, name, 0, time1, price1);
return(false);
}
//— set line color
ObjectSetInteger(chart_ID, name, OBJPROP_COLOR, clr);
//— set line display style
ObjectSetInteger(chart_ID, name, OBJPROP_STYLE, style);
//— set line width
ObjectSetInteger(chart_ID, name, OBJPROP_WIDTH, width);
//— display in the foreground (false) or background (true)
ObjectSetInteger(chart_ID, name, OBJPROP_BACK, back);
//— enable (true) or disable (false) the mode of moving the line by mouse
//— when creating a graphical object using ObjectCreate function, the object cannot be
//— highlighted and moved by default. Inside this method, selection parameter
//— is true by default making it possible to highlight and move the object
ObjectSetInteger(chart_ID, name, OBJPROP_SELECTABLE, selection);
ObjectSetInteger(chart_ID, name, OBJPROP_SELECTED, selection);
//— enable (true) or disable (false) the mode of continuation of the line’s display to the right
ObjectSetInteger(chart_ID, name, OBJPROP_RAY_RIGHT, ray_right);
//— hide (true) or display (false) graphical object name in the object list
ObjectSetInteger(chart_ID, name, OBJPROP_HIDDEN, hidden);
//— set the priority for receiving the event of a mouse click in the chart
ObjectSetInteger(chart_ID, name, OBJPROP_ZORDER, z_order);
//— successful execution
return(true);
}
2.以TrendCreate顯示×標記
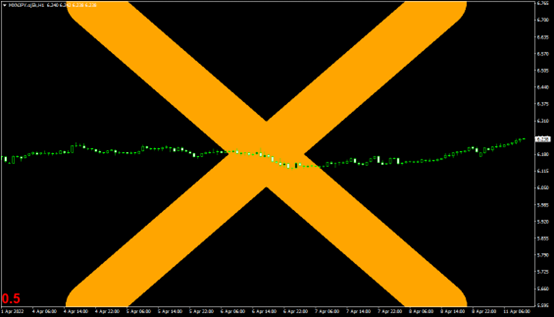
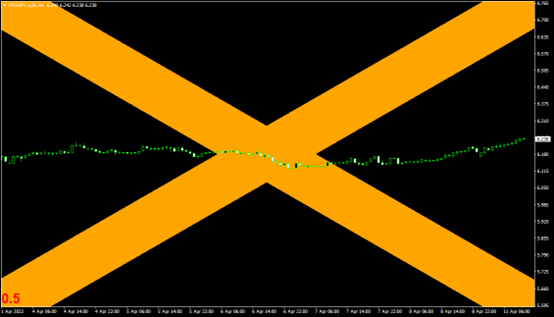
與LabelCreate一樣,在DrawX()中執行TrendCreate。首先繪製右下方的趨勢線。參數的部分,圖表ID設定為「0」、名稱為「PREFIX + “X0″」、視窗為「0」、左邊的時間為「timeL」、該價格為「max」、右邊的時間為「timeR」、該價格為「min」、顏色是已定義的「clrX」、樣式為實線的「STYLE_SOLID」、寬度為「100」。由於希望使用×標記,因此同樣使用TrendCreate來繪製右上方的趨勢線。TrendCreate(0, PREFIX + “X0”, 0, timeL, max, timeR, min, clrX, STYLE_SOLID, 100);如此進行編譯,就可在圖表上繪製出橘色的×標記。
TrendCreate(0, PREFIX + “X1”, 0, timeL, min, timeR, max, clrX, STYLE_SOLID, 100);
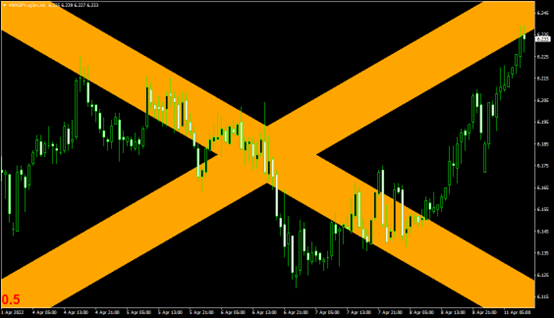
但是,如果就這樣移動圖表或擴大、縮小價格的顯示範圍,×標記並不會隨之移動。
為了在圖表出現變化時進行相同的處理動作,需在OnChartEvent函數內新增以下if文體。
if (id == CHARTEVENT_CHART_CHANGE) DrawX();如此一來,即使圖表有所改變,×標記也會隨之變更。
3.原始碼
本次製作的原始碼如以下所示。//+——————————————————————+
//| ATR_Judge.mq4 |
//| Copyright 2022, MetaQuotes Software Corp. |
//| https://www.mql5.com |
//+——————————————————————+
#property copyright “Copyright 2022, MetaQuotes Software Corp.”
#property link “https://www.mql5.com”
#property version “1.00”
#property strict
#property indicator_chart_window
#define PREFIX MQLInfoString(MQL_PROGRAM_NAME) + “_”
//— input parameters
input ENUM_TIMEFRAMES TF = PERIOD_M5; // 時間足
input int PERIOD = 14; // 期間
input double LEVEL = 1.5; // 許容値
//+——————————————————————+
//| Custom indicator initialization function |
//+——————————————————————+
int OnInit()
{
//— indicator buffers mapping
//—
return(INIT_SUCCEEDED);
}
//+——————————————————————+
//| Custom indicator deinitialization function |
//+——————————————————————+
void OnDeinit(const int reason)
{
ObjectsDeleteAll(0, PREFIX);
}
//+——————————————————————+
//| Custom indicator iteration function |
//+——————————————————————+
int OnCalculate(const int rates_total,
const int prev_calculated,
const datetime &time[],
const double &open[],
const double &high[],
const double &low[],
const double &close[],
const long &tick_volume[],
const long &volume[],
const int &spread[])
{
//—
DrawX();
//— return value of prev_calculated for next call
return(rates_total);
}
//+——————————————————————+
//| ChartEvent function |
//+——————————————————————+
void OnChartEvent(const int id,
const long &lparam,
const double &dparam,
const string &sparam)
{
//—
if (id == CHARTEVENT_CHART_CHANGE) DrawX();
}
//+——————————————————————+
//| Draw function |
//+——————————————————————+
void DrawX()
{
double atr = iATR(NULL, TF, PERIOD, 1) / _Point / 10;
bool small = atr < LEVEL;
color clrATR = small ? clrRed : clrWhite;
LabelCreate(0, PREFIX + “ATR”, 0, 0, 0, CORNER_LEFT_LOWER, DoubleToString(atr, 1), “Arial Bold”, 20, clrATR, 0, ANCHOR_LEFT_LOWER);
double max = ChartGetDouble(0, CHART_PRICE_MAX);
double min = ChartGetDouble(0, CHART_PRICE_MIN);
int barL = (int)ChartGetInteger(0, CHART_FIRST_VISIBLE_BAR);
int barR = barL – (int)ChartGetInteger(0, CHART_WIDTH_IN_BARS);
datetime timeL = Time[barL];
datetime timeR = barR >= 0 ? Time[barR] : Time[0] – barR * PeriodSeconds();
color clrX = small ? clrOrange : clrNONE;
TrendCreate(0, PREFIX + “X0”, 0, timeL, max, timeR, min, clrX, STYLE_SOLID, 100);
TrendCreate(0, PREFIX + “X1”, 0, timeL, min, timeR, max, clrX, STYLE_SOLID, 100);
}
//+——————————————————————+
//| Create a text label |
//+——————————————————————+
bool LabelCreate(const long chart_ID = 0, // chart’s ID
const string name = “Label”, // label name
const int sub_window = 0, // subwindow index
const int x = 0, // X coordinate
const int y = 0, // Y coordinate
const ENUM_BASE_CORNER corner = CORNER_LEFT_UPPER, // chart corner for anchoring
const string text = “Label”, // text
const string font = “Arial”, // font
const int font_size = 10, // font size
const color clr = clrRed, // color
const double angle = 0.0, // text slope
const ENUM_ANCHOR_POINT anchor = ANCHOR_LEFT_UPPER, // anchor type
const bool back = false, // in the background
const bool selection = false, // highlight to move
const bool hidden = true, // hidden in the object list
const long z_order = 0) // priority for mouse click
{
//— reset the error value
ResetLastError();
//— create a text label
if(!ObjectCreate(chart_ID, name, OBJ_LABEL, sub_window, 0, 0)) {
/* Print(__FUNCTION__,
“: failed to create text label! Error code = “,GetLastError());*/
ObjectSetString(chart_ID, name, OBJPROP_TEXT, text);
ObjectSetInteger(chart_ID, name, OBJPROP_COLOR, clr);
return(false);
}
//— set label coordinates
ObjectSetInteger(chart_ID, name, OBJPROP_XDISTANCE, x);
ObjectSetInteger(chart_ID, name, OBJPROP_YDISTANCE, y);
//— set the chart’s corner, relative to which point coordinates are defined
ObjectSetInteger(chart_ID, name, OBJPROP_CORNER, corner);
//— set the text
ObjectSetString(chart_ID, name, OBJPROP_TEXT, text);
//— set text font
ObjectSetString(chart_ID, name, OBJPROP_FONT, font);
//— set font size
ObjectSetInteger(chart_ID, name, OBJPROP_FONTSIZE, font_size);
//— set the slope angle of the text
ObjectSetDouble(chart_ID, name, OBJPROP_ANGLE, angle);
//— set anchor type
ObjectSetInteger(chart_ID, name, OBJPROP_ANCHOR, anchor);
//— set color
ObjectSetInteger(chart_ID, name, OBJPROP_COLOR, clr);
//— display in the foreground (false) or background (true)
ObjectSetInteger(chart_ID, name, OBJPROP_BACK, back);
//— enable (true) or disable (false) the mode of moving the label by mouse
ObjectSetInteger(chart_ID, name, OBJPROP_SELECTABLE, selection);
ObjectSetInteger(chart_ID, name, OBJPROP_SELECTED, selection);
//— hide (true) or display (false) graphical object name in the object list
ObjectSetInteger(chart_ID, name, OBJPROP_HIDDEN, hidden);
//— set the priority for receiving the event of a mouse click in the chart
ObjectSetInteger(chart_ID, name, OBJPROP_ZORDER, z_order);
//— successful execution
return(true);
}
//+——————————————————————+
//| Create a trend line by the given coordinates |
//+——————————————————————+
bool TrendCreate(const long chart_ID = 0, // chart’s ID
const string name = “TrendLine”, // line name
const int sub_window = 0, // subwindow index
datetime time1 = 0, // first point time
double price1 = 0, // first point price
datetime time2 = 0, // second point time
double price2 = 0, // second point price
const color clr = clrRed, // line color
const ENUM_LINE_STYLE style = STYLE_SOLID, // line style
const int width = 1, // line width
const bool back = true, // in the background
const bool selection = false, // highlight to move
const bool ray_right = false, // line’s continuation to the right
const bool hidden = true, // hidden in the object list
const long z_order = 0) // priority for mouse click
{
//— reset the error value
ResetLastError();
//— create a trend line by the given coordinates
if(!ObjectCreate(chart_ID, name, OBJ_TREND, sub_window, time1, price1, time2, price2)) {
/* Print(__FUNCTION__,
“: failed to create a trend line! Error code = “,GetLastError());*/
ObjectMove(chart_ID, name, 0, time1, price1);
ObjectMove(chart_ID, name, 1, time2, price2);
return(false);
}
//— set line color
ObjectSetInteger(chart_ID, name, OBJPROP_COLOR, clr);
//— set line display style
ObjectSetInteger(chart_ID, name, OBJPROP_STYLE, style);
//— set line width
ObjectSetInteger(chart_ID, name, OBJPROP_WIDTH, width);
//— display in the foreground (false) or background (true)
ObjectSetInteger(chart_ID, name, OBJPROP_BACK, back);
//— enable (true) or disable (false) the mode of moving the line by mouse
//— when creating a graphical object using ObjectCreate function, the object cannot be
//— highlighted and moved by default. Inside this method, selection parameter
//— is true by default making it possible to highlight and move the object
ObjectSetInteger(chart_ID, name, OBJPROP_SELECTABLE, selection);
ObjectSetInteger(chart_ID, name, OBJPROP_SELECTED, selection);
//— enable (true) or disable (false) the mode of continuation of the line’s display to the right
ObjectSetInteger(chart_ID, name, OBJPROP_RAY_RIGHT, ray_right);
//— hide (true) or display (false) graphical object name in the object list
ObjectSetInteger(chart_ID, name, OBJPROP_HIDDEN, hidden);
//— set the priority for receiving the event of a mouse click in the chart
ObjectSetInteger(chart_ID, name, OBJPROP_ZORDER, z_order);
//— successful execution
return(true);
}
將EA自動程式交易應用於外匯與差價合約交易中

我們以圖文形式詳細介紹有關EA自動程式交易的基本知識,以及在MT4/MT5平台上的安裝、參數設定方法、編碼等等內容。另外,對持有OANDA帳戶的客戶,還可以免費使用我們的獨有EA與指標工具。