運用水平線與垂直線物件在圖表上繪製網格的方式
登錄接頭辭以利製作雛形
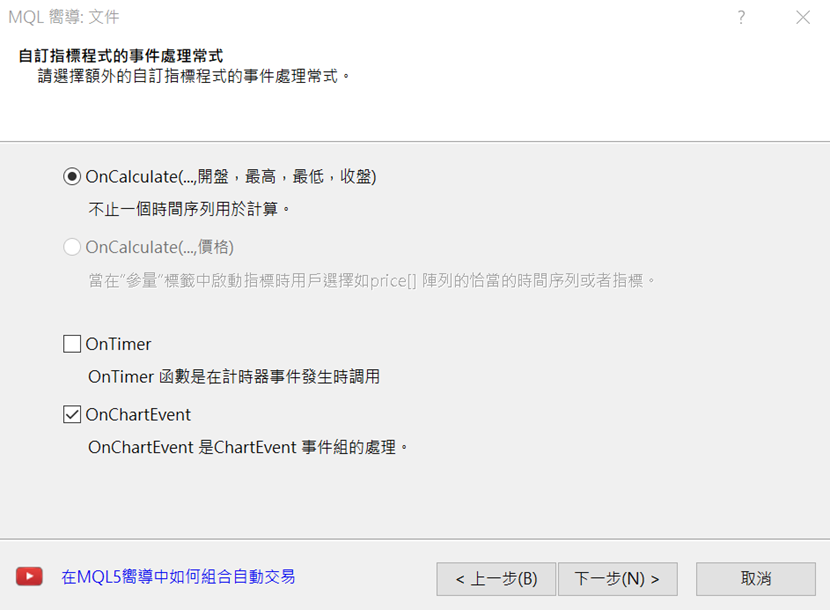
在本篇章節中,將介紹如何運用水平線與垂直線物件在圖表上繪製網格(縱橫線)。首先,在製作新檔案中選擇「客製化指標」,並將檔案名稱命名為「Grid_test」。由於本次將使用「OnChartEvent」,因此在「客製化指標的事件處理程序」畫面中,僅勾選「OnChartEvent」的欄位並進入下一步;如此點擊「完成」即是雛形。
因需使用到物件,故為了能夠一次進行刪除,應先登錄接頭辭;在檔案上方的屬性「 #property indicator_chart_window」下方,如以下所示加以定義。
#define PREFIX “Grid_”其後,在「Custom indicator initialization function」下方設定「Custom indicator deinit function」,並寫入使用OnDeinit函數的以下編碼。
void OnDeinit(const int reason)
{
ObjectsDeleteAll(0, PREFIX);
}
使用OBJ_VLINE設定垂直線
關於網格的繪圖處理,應能夠在圖表變更時予以執行,並在每次重設之後繪製網格。首先來設定垂直線;在繪製縱向線條時,將範圍指定為左方K線至右方K線。
「CHART_FIRST_VISIBLE_BAR」是圖表左邊最先出現的K線,「CHART_WIDTH_IN_BARS」則是圖表中的K線總數量;至於右邊的K線,由於當圖表位置變換時,最新的線條可能並不會出現在右邊、並成為負數值,因此需將此狀況的數值設定為「0」。
int barF = (int)ChartGetInteger(0, CHART_FIRST_VISIBLE_BAR);接下來將使用for文體,從barF至barR進行計算。如果只希望在需要的位置繪製垂直線,便須再度新增條件;將繪製垂直線時機的「drawV」改為「true」,便會形成在此時繪製垂直線的模式。
int barR = barF – (int)ChartGetInteger(0, CHART_WIDTH_IN_BARS);
if (barR < 0) barR = 0;
for (int i = barF; i >= barR; i–) {此處會從MQL4幫助檔中,複製垂直線的範例編碼並加以運用。點擊MQL4相關參考目錄的「Constants, Enumerations and Structures」→「Objects Constants」→「Object Types」,便會出現物件一覽;從中選擇「OBJ_ VLINE」後,複製預先準備的編碼並貼至檔案下方。
bool drawV = false;
if (drawV) {
}
}
刪除不需要的「//— if the line time is not set, draw it via the last bar」等5行,以及「Print(__FUNCTION__,」「”: failed to create a vertical line! Error code = “,GetLastError());」2行。
另外,顏色從「clr = clrRed」改為「clr = clrGray」,風格則從實線「style = STYLE_SOLID」改為虛線「style = STYLE_DOT」,選擇從「selection = true,」改為「selection = false」。
順道一提,雖然此處為垂直線專用,但亦可將「VLineCreate」改為「LineCreate」以便水平線也能使用;而時間初始設定「datetime time = 0, // line time」的下方,將價格初始設定「double price = 0, // line price」新增double型,然後將「if(!ObjectCreate(chart_ID, name, OBJ_VLINE, sub_window, time, 0)) {」的「0」改為「price」即完成了準備工作。
//+——————————————————————+
//| Create the vertical line |
//+——————————————————————+
bool LineCreate(const long chart_ID = 0, // chart’s ID
const string name = “VLine”, // line name
const int sub_window = 0, // subwindow index
datetime time = 0, // line time
double price = 0, // line price
const color clr = clrGray, // line color
const ENUM_LINE_STYLE style = STYLE_DOT, // line style
const int width = 1, // line width
const bool back = false, // in the background
const bool selection = false, // highlight to move
const bool hidden = true, // hidden in the object list
const long z_order = 0) // priority for mouse click
{
//— create a vertical line
if(!ObjectCreate(chart_ID, name, OBJ_VLINE, sub_window, time, price)) {
return(false);
}
//— set line color
ObjectSetInteger(chart_ID, name, OBJPROP_COLOR, clr);
//— set line display style
ObjectSetInteger(chart_ID, name, OBJPROP_STYLE, style);
//— set line width
ObjectSetInteger(chart_ID, name, OBJPROP_WIDTH, width);
//— display in the foreground (false) or background (true)
ObjectSetInteger(chart_ID, name, OBJPROP_BACK, back);
//— enable (true) or disable (false) the mode of moving the line by mouse
//— when creating a graphical object using ObjectCreate function, the object cannot be
//— highlighted and moved by default. Inside this method, selection parameter
//— is true by default making it possible to highlight and move the object
ObjectSetInteger(chart_ID, name, OBJPROP_SELECTABLE, selection);
ObjectSetInteger(chart_ID, name, OBJPROP_SELECTED, selection);
//— hide (true) or display (false) graphical object name in the object list
ObjectSetInteger(chart_ID, name, OBJPROP_HIDDEN, hidden);
//— set the priority for receiving the event of a mouse click in the chart
ObjectSetInteger(chart_ID, name, OBJPROP_ZORDER, z_order);
//— successful execution
return(true);
}
使用switch處理繪製垂直線
接下來,將新增繪製垂直線的編碼。首先在「if (drawV) {」下方「LineCreate」,如以下所示設定參數。圖表ID為「0」、名稱為「PREFIX+VL+序號」、視窗編號為主要視窗的「0」、時間為核准時間,價格則因是「0」故予以省略。
LineCreate(0, PREFIX + “VL” + IntegerToString(i), 0, Time[i]);如欲在此處將設定改為依照時間週期,便須使用「switch文體」;其與if文體相同,常用於製作執行不同條件的程式。在Switch後方的括弧中置入「條件公式」,便會跳到與該公式一致的case位置加以處理。
首先,如果顯示圖表時間週期的「_Period」數值為1分鐘「PERIOD_M1」的處理時,需在「if (drawV) {」上方進行以下編寫。在每分鐘單位的公式中,如欲以15分鐘作為間隔來繪製垂直線,便應將時間除以15分鐘,並在餘數為「0」時成為「true」。
switch (_Period) {如此便完成了每分鐘的設定。
case PERIOD_M1 :
drawV = Time[i] % PeriodSeconds(PERIOD_M15) == 0;
break;
}
根據不同時間週期指定繪製垂直線的間隔
除了1分鐘之外,時間週期亦有「5分鐘」「15分鐘」「30分鐘」「1小時」「4小時」「每日」「每週」「每月」等8種,並可設定其各自的條件。此處將5分鐘時間週期設定為每小時間隔、15分鐘及30分鐘設定為每4小時間隔、1小時則設定為每日間隔。由於15分鐘與30分鐘同為每4小時進行處理,故可如下所示,刪除15分鐘的「break;」並一次進行編寫。
case PERIOD_M5 :4小時則設定為每週間隔;若使用取得指定日期週間的「TimeDayOfWeek」,便只會在星期一執行處理,並拉出每週的垂直線。
drawV = Time[i] % PeriodSeconds(PERIOD_H1) == 0;
break;
case PERIOD_M15 :
case PERIOD_M30 :
drawV = Time[i] % PeriodSeconds(PERIOD_H4) == 0;
break;
case PERIOD_H1 :
drawV = Time[i] % PeriodSeconds(PERIOD_D1) == 0;
break;
case PERIOD_H4 :另外,每日則以每月間隔,故可使用「MN1」;但若不滿一日,便會無法順利繪製垂直線,因此此處將公式予以改變,運用「TimeMonth」在月份切換時進行繪製。
drawV = Time[i] % PeriodSeconds(PERIOD_D1) == 0 && TimeDayOfWeek(Time[i]) == MONDAY;
break;
case PERIOD_D1 :但是,當使用「i+1」、且「barF」存在於圖表最左邊的數據時,需注意是否超出序列的範圍;為了消除此錯誤,可在「int barF = (int)ChartGetInteger(0, CHART_FIRST_VISIBLE_BAR);」下方添加以下if文體。
drawV = TimeMonth(Time[i]) != TimeMonth(Time[i + 1]);
break;
if (barF > Bars – 2) barF = Bars – 2;至於每週的間隔,則以3個月作為區隔;以 TimeMonth(Time[i])除以3,便只會在餘數為1、也就是1、4、7、10月時繪製垂直線。
case PERIOD_W1 :最後,每月則是以1年為區隔;使用「TimeYear」,藉以在年份切換時進行繪製。
drawV = TimeMonth(Time[i]) != TimeMonth(Time[i + 1]) && TimeMonth(Time[i]) % 3 == 1;
break;
case PERIOD_MN1 :如此即完成了垂直線;若進行編譯並設定圖表,即可看見垂直線依設定的間隔進行繪製。
drawV = TimeYear(Time[i]) != TimeYear(Time[i + 1]);
break;
在不同時間週期繪製不同間隔的水平線
接下來,就要進行水平線的設定。水平線與垂直向相同,都會使用switch文體,根據不同時間週期變更間隔。
本次將1分鐘、5分鐘、15分鐘以50pips做出區隔。「_Point」意指最小的價格單位,意即0.1pips;故若乘以500便成為50pips。另外, 30分鐘、1小時、4小時單位是以100pips做出間隔;每日單位為200pips、每週及每月則是1000pips。
double pitch = 0;針對水平線,目標範圍僅從圖表上方至下方,因此可透過「ChartGetDouble」取得第1個價格以及其下方1個價格;至於最下方的價格,則使用「MathMod」以間隔除算,將餘數從最小值中減去、再予以四捨五入。舉例來說,若最下方的價格為「104.2」,則間隔的50pips則為四捨五入的「104」。
switch (_Period) {
case PERIOD_M1 :
case PERIOD_M5 :
case PERIOD_M15 :
pitch = 500 * _Point;
break;
case PERIOD_M30 :
case PERIOD_H1 :
case PERIOD_H4 :
pitch = 1000 * _Point;
break;
case PERIOD_D1 :
pitch = 2000 * _Point;
break;
case PERIOD_W1 :
case PERIOD_MN1 :
pitch = 10000 * _Point;
break;
}
double max = ChartGetDouble(0, CHART_PRICE_MAX);為了將數字化為整數,可使用「NormalizeDouble」,從最小值處拉出n條水平線(「_Digits」會顯示該貨幣對價格的小數點以下位數)。
double min = ChartGetDouble(0, CHART_PRICE_MIN);
min -= MathMod(min, pitch);
min = NormalizeDouble(min, _Digits);雖已使用for文體來處理n條列,但「Create the vertical line」的設定為VLINE專用型,故此處將予以修改,以便後續設定樣式。在「Create the vertical line」的「const string name = “VLine”, // line name」下方寫入以下公式,即可指定兩者的樣式。
int n = int((max – min) / pitch) + 1;
for (int i = 0; i < n; i++) {
const int type = OBJ_VLINE, // type其後將「if(!ObjectCreate(chart_ID, name, OBJ_VLINE, sub_window, time, price)) {」的「OBJ_VLINE」改為「type」。
if(!ObjectCreate(chart_ID, name, type, sub_window, time, price)) {與此同時,在繪製垂直線的「LineCreate(0, PREFIX + “VL” + IntegerToString(i), 0, Time[i]);」中,在「0」前方添加「OBJ_VLINE」。
LineCreate(0, PREFIX + “VL” + IntegerToString(i), OBJ_VLINE, 0, Time[i]);關於繪製水平線的編碼,可延用前文的垂直線內容,並與前述for文體相互搭配。將「VL」改為「HL」、「OBJ_VLINE」改為「OBJ_HLINE」;另外, 因屬於HLINE、故時間為「0」、價格為「min+i*pitch」。
LineCreate(0, PREFIX + “HL” + IntegerToString(i), OBJ_HLINE, 0, 0, min + i * pitch);進行編譯並設定圖表之後,便可依據不同時間週期設定的間隔繪製水平線;如此便完成了隔線。
原始碼
本次製作的原始碼如以下所示。//+——————————————————————+
//| Grid_test.mq4 |
//| Copyright 2021, MetaQuotes Software Corp. |
//| https://www.mql5.com |
//+——————————————————————+
#property copyright “Copyright 2021, MetaQuotes Software Corp.”
#property link “https://www.mql5.com”
#property version “1.00”
#property strict
#property indicator_chart_window
#define PREFIX “Grid_”
//+——————————————————————+
//| Custom indicator initialization function |
//+——————————————————————+
int OnInit()
{
//— indicator buffers mapping
//—
return(INIT_SUCCEEDED);
}
//+——————————————————————+
//| Custom indicator deinit function |
//+——————————————————————+
void OnDeinit(const int reason)
{
ObjectsDeleteAll(0, PREFIX);
}
//+——————————————————————+
//| Custom indicator iteration function |
//+——————————————————————+
int OnCalculate(const int rates_total,
const int prev_calculated,
const datetime &time[],
const double &open[],
const double &high[],
const double &low[],
const double &close[],
const long &tick_volume[],
const long &volume[],
const int &spread[])
{
//—
//— return value of prev_calculated for next call
return(rates_total);
}
//+——————————————————————+
//| ChartEvent function |
//+——————————————————————+
void OnChartEvent(const int id,
const long &lparam,
const double &dparam,
const string &sparam)
{
if (id == CHARTEVENT_CHART_CHANGE) {
ObjectsDeleteAll(0, PREFIX);
int barF = (int)ChartGetInteger(0, CHART_FIRST_VISIBLE_BAR);
if (barF > Bars – 2) barF = Bars – 2;
int barR = barF – (int)ChartGetInteger(0, CHART_WIDTH_IN_BARS);
if (barR < 0) barR = 0;
for (int i = barF; i >= barR; i–) {
bool drawV = false;
switch (_Period) {
case PERIOD_M1 :
drawV = Time[i] % PeriodSeconds(PERIOD_M15) == 0;
break;
case PERIOD_M5 :
drawV = Time[i] % PeriodSeconds(PERIOD_H1) == 0;
break;
case PERIOD_M15 :
case PERIOD_M30 :
drawV = Time[i] % PeriodSeconds(PERIOD_H4) == 0;
break;
case PERIOD_H1 :
drawV = Time[i] % PeriodSeconds(PERIOD_D1) == 0;
break;
case PERIOD_H4 :
drawV = Time[i] % PeriodSeconds(PERIOD_D1) == 0 && TimeDayOfWeek(Time[i]) == MONDAY;
break;
case PERIOD_D1 :
drawV = TimeMonth(Time[i]) != TimeMonth(Time[i + 1]);
break;
case PERIOD_W1 :
drawV = TimeMonth(Time[i]) != TimeMonth(Time[i + 1]) && TimeMonth(Time[i]) % 3 == 1;
break;
case PERIOD_MN1 :
drawV = TimeYear(Time[i]) != TimeYear(Time[i + 1]);
break;
}
if (drawV) {
LineCreate(0, PREFIX + “VL” + IntegerToString(i), OBJ_VLINE, 0, Time[i]);
}
}
double pitch = 0;
switch (_Period) {
case PERIOD_M1 :
case PERIOD_M5 :
case PERIOD_M15 :
pitch = 500 * _Point;
break;
case PERIOD_M30 :
case PERIOD_H1 :
case PERIOD_H4 :
pitch = 1000 * _Point;
break;
case PERIOD_D1 :
pitch = 2000 * _Point;
break;
case PERIOD_W1 :
case PERIOD_MN1 :
pitch = 10000 * _Point;
break;
}
double max = ChartGetDouble(0, CHART_PRICE_MAX);
double min = ChartGetDouble(0, CHART_PRICE_MIN);
min -= MathMod(min, pitch);
min = NormalizeDouble(min, _Digits);
int n = int((max – min) / pitch) + 1;
for (int i = 0; i < n; i++) {
LineCreate(0, PREFIX + “HL” + IntegerToString(i), OBJ_HLINE, 0, 0, min + i * pitch);
}
}
}
//+——————————————————————+
//| Create the vertical line |
//+——————————————————————+
bool LineCreate(const long chart_ID = 0, // chart’s ID
const string name = “VLine”, // line name
const int type = OBJ_VLINE, // type
const int sub_window = 0, // subwindow index
datetime time = 0, // line time
double price = 0, // line price
const color clr = clrGray, // line color
const ENUM_LINE_STYLE style = STYLE_DOT, // line style
const int width = 1, // line width
const bool back = false, // in the background
const bool selection = false, // highlight to move
const bool hidden = true, // hidden in the object list
const long z_order = 0) // priority for mouse click
{
//— create a vertical line
if(!ObjectCreate(chart_ID, name, type, sub_window, time, price)) {
return(false);
}
//— set line color
ObjectSetInteger(chart_ID, name, OBJPROP_COLOR, clr);
//— set line display style
ObjectSetInteger(chart_ID, name, OBJPROP_STYLE, style);
//— set line width
ObjectSetInteger(chart_ID, name, OBJPROP_WIDTH, width);
//— display in the foreground (false) or background (true)
ObjectSetInteger(chart_ID, name, OBJPROP_BACK, back);
//— enable (true) or disable (false) the mode of moving the line by mouse
//— when creating a graphical object using ObjectCreate function, the object cannot be
//— highlighted and moved by default. Inside this method, selection parameter
//— is true by default making it possible to highlight and move the object
ObjectSetInteger(chart_ID, name, OBJPROP_SELECTABLE, selection);
ObjectSetInteger(chart_ID, name, OBJPROP_SELECTED, selection);
//— hide (true) or display (false) graphical object name in the object list
ObjectSetInteger(chart_ID, name, OBJPROP_HIDDEN, hidden);
//— set the priority for receiving the event of a mouse click in the chart
ObjectSetInteger(chart_ID, name, OBJPROP_ZORDER, z_order);
//— successful execution
return(true);
}
//+——————————————————————+
將EA自動程式交易應用於外匯與差價合約交易中

我們以圖文形式詳細介紹有關EA自動程式交易的基本知識,以及在MT4/MT5平台上的安裝、參數設定方法、編碼等等內容。另外,對持有OANDA帳戶的客戶,還可以免費使用我們的獨有EA與指標工具。