在圖表上顯示候補支撐線與阻力線的方式
在繪圖屬性中定義2種線條
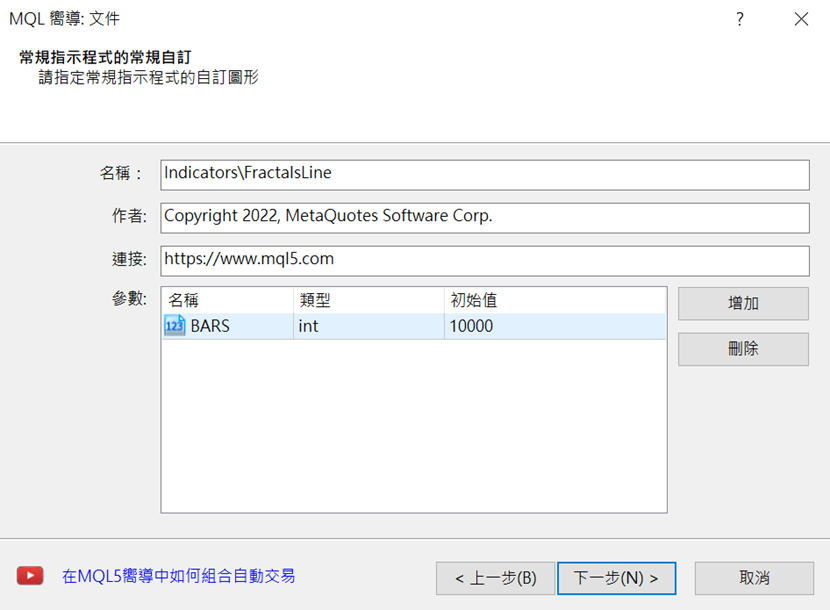
在本篇章節中,將介紹如何在圖表上顯示候補支撐線與阻力線;具體來說,將透過MT4最初導入的比爾·威廉姆斯系列指標「Fractals」,在其紀錄的轉換點位置之間描繪點線。首先,在製作新檔案時選擇「客製化指標」,並以檔案名稱「FractalsLine」來新增參數;由於本次計算的K線數量將有所限制,因此以「BARS」名稱將初始值設為「1000」。
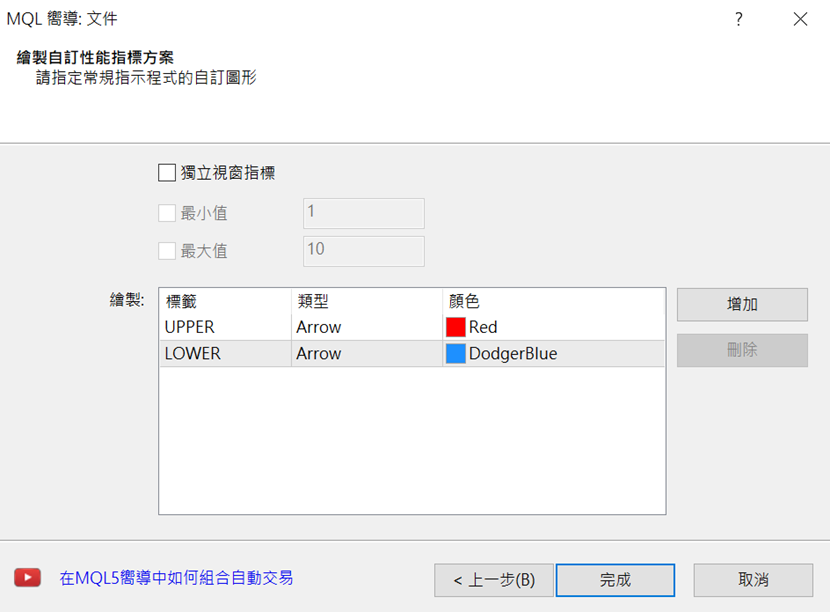
在「自訂指標程式的事件處理常式」畫面中,「OnTimer」「OnChartEvent」的欄位皆無需勾選、直接進入下一個步驟;到了「繪製自訂性能指標方案」的繪圖欄位中,登錄含有數據資料的緩衝器。
本次會繪製上方與下方的2種線條,因此要個別進行登錄。上方線條的標籤設定為「UPPER」、類型為「Arrow」、顏色為「Red」;下方線條的標籤則是「LOWER」、類型為「Arrow」、顏色為「DodgerBlue」,如此點擊「完成」即可呈現雛形。
設定「SetIndexArrow」使用的記號
若僅有這樣的雛形,恐仍難以運用自如;因此當設定指標於圖表上時,需改寫只會執行1次的 OnInit函數編碼。將「PlotIndexSetInteger」的2行文字,改變為設定顯示記號種類的「SetIndexArrow」;而記號種類的顯示編號中,小點即是「158」。另外,「PlotIndexSetInteger」則是指定MT5等編碼的方式。
SetIndexArrow(0, 158);另外,考量到緩衝器名稱「UPPERBuffer」「LOWERBuffer」略顯冗長,此處將其4個名稱分別改為「UPPER」「LOWER」。如此即完成了OnInit函數部分的編碼。
SetIndexArrow(1, 158);
double UPPER[];
double LOWER[];
SetIndexBuffer(0, UPPER);
SetIndexBuffer(1, LOWER);
運用iFractals函數取得價格波動的高點
接下來,將在OnCalculate函數下寫入執行處理的公式。製作for文體來計算所設定的K線數量、再以iFractals函數調查高點的數值;透過「MODE_UPPER」取得上方高點,「MODE_LOWER」則是下方的高點。for (int i = MathMin(Bars – 2, BARS); i >= 0; i–) {如此便能取得點的位置。當點顯示時,便會帶入當時的高價與低價;如未顯示點,則會返回0。若if文體的「fr_U」並不是0,則應於「UPPER[i]」處輸入「fr_U」;其他狀況則應輸入一個條列前的數值,「LOWER」部分亦是相同。
double fr_U = iFractals(NULL, 0, MODE_UPPER, i);
double fr_L = iFractals(NULL, 0, MODE_LOWER, i);
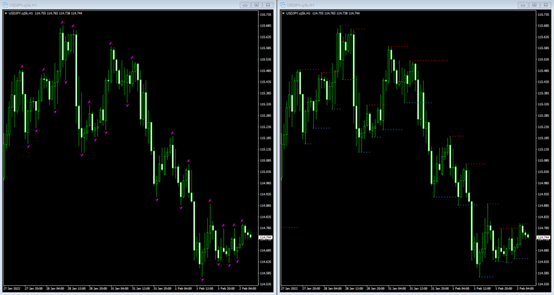
if (fr_U != 0) {如此進行編譯並設定圖表,就可在比爾·威廉姆斯系列指標「Fractals」轉換點的位置之間拉出點線。畫面左邊的圖表已設定「Fractals」,右側圖表則設定了本次製作的「FractalsLine」。
UPPER[i] = fr_U;
} else UPPER[i] = UPPER[i + 1];
if (fr_L != 0) {
LOWER[i] = fr_L;
} else LOWER [i] = LOWER[i + 1] ;
新增K線的停止功能
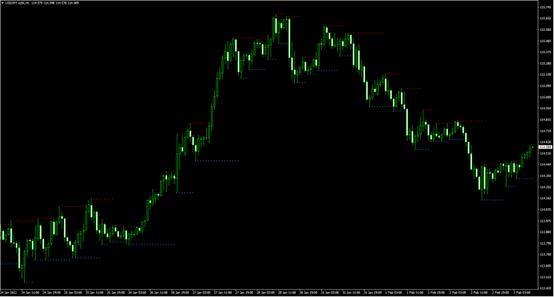
接下來,當收盤價向上突破上方線條、或向下跌破下方線條時,為了停止線條的繪製,將新增「else if」的條件。else if (Close[i] < UPPER[i + 1]) UPPER[i] = UPPER[i + 1];若在此處進行編譯,一旦線條的收盤價有所突破,其K線的繪製便會停止。從圖表即可見到,線條並未跨越K線的實體。
else if (Close[i] > LOWER[i + 1]) LOWER[i] = LOWER[i + 1];
新增線條的延長功能
在這樣的狀態下,一旦製作新的線條,便會使先前的線條中斷;因此在收盤價有所突破之前,需進行修改以延長線條。此處將利用趨勢線物件。於MQL4幫助檔目錄中點擊「Constants, Enumerations and Structures」→「Objects Constants」→「Object Types」,便會看見物件一覽表;選擇其中的「OBJ_TREND」,預先複製所準備的編碼,並貼至檔案的下方。
刪除不需要的「//— set anchor points’ coordinates if they are not set」至「ResetLastError();」4行,以及「Print(__FUNCTION__,」「”: failed to create a trend line! Error code = “,GetLastError());」2行。另外,將「selection = true」修正為「selection = false」。
//+——————————————————————+接下來,需定義使用物件時的接頭辭;於檔案上方的屬性「#property indicator_width2 1」下新增以下編碼。
//| Create a trend line by the given coordinates |
//+——————————————————————+
bool TrendCreate(const long chart_ID=0, // chart’s ID
const string name=”TrendLine”, // line name
const int sub_window=0, // subwindow index
datetime time1=0, // first point time
double price1=0, // first point price
datetime time2=0, // second point time
double price2=0, // second point price
const color clr=clrRed, // line color
const ENUM_LINE_STYLE style=STYLE_SOLID, // line style
const int width=1, // line width
const bool back=false, // in the background
const bool selection=true, // highlight to move
const bool ray_right=false, // line’s continuation to the right
const bool hidden=true, // hidden in the object list
const long z_order=0) // priority for mouse click
{
//— create a trend line by the given coordinates
if(!ObjectCreate(chart_ID,name,OBJ_TREND,sub_window,time1,price1,time2,price2))
{
return(false);
}
//— set line color
ObjectSetInteger(chart_ID,name,OBJPROP_COLOR,clr);
//— set line display style
ObjectSetInteger(chart_ID,name,OBJPROP_STYLE,style);
//— set line width
ObjectSetInteger(chart_ID,name,OBJPROP_WIDTH,width);
//— display in the foreground (false) or background (true)
ObjectSetInteger(chart_ID,name,OBJPROP_BACK,back);
//— enable (true) or disable (false) the mode of moving the line by mouse
//— when creating a graphical object using ObjectCreate function, the object cannot be
//— highlighted and moved by default. Inside this method, selection parameter
//— is true by default making it possible to highlight and move the object
ObjectSetInteger(chart_ID,name,OBJPROP_SELECTABLE,selection);
ObjectSetInteger(chart_ID,name,OBJPROP_SELECTED,selection);
//— enable (true) or disable (false) the mode of continuation of the line’s display to the right
ObjectSetInteger(chart_ID,name,OBJPROP_RAY_RIGHT,ray_right);
//— hide (true) or display (false) graphical object name in the object list
ObjectSetInteger(chart_ID,name,OBJPROP_HIDDEN,hidden);
//— set the priority for receiving the event of a mouse click in the chart
ObjectSetInteger(chart_ID,name,OBJPROP_ZORDER,z_order);
//— successful execution
return(true);
}
#define PREFIX “FractalsLine_”其後使用OnDeinit函數,以便在每次計算時都重設相關物件。
void OnDeinit(const int reason)在OnCalculate函數下、一開始的for文體上方新增以下編碼,便會於每一次都刪除含有「PREFIX」文字的物件。
{
ObjectsDeleteAll(0, PREFIX);
}
ObjectsDeleteAll(0, PREFIX);
以趨勢線延長線條
為了新增線條的延長功能,需定義接頭辭;如欲在每次計算時都重設相關物件,則應添加OnDeinit函數。其後,在OnCalculate函數下修改執行處理的編碼以便搭配。首先,應指定延長用趨勢線的繪製時機。由於本次希望在新的轉換點出現之前開始畫線,因此在「UPPER[i] = fr_U;」下方添加以下編碼。
if (Close[i] < UPPER[i + 1]){然後,在其下新增上方延長趨勢線的相關編碼。
TrendCreate(0, PREFIX + “U_” + (string)i, 0, Time[i], UPPER[i + 1], Time[iEnd], UPPER[i + 1], clrRed, STYLE_DOT);由於必須尋找終點的時間,因此要在新的點出現時,從該處開始進行搜尋;故在上列編碼的下方新增for文體。另外,若使用if文體「Close[j]」,便能在點朝上移動時納入當時的數值,並以for文體的形式結束。
int iEnd = 0;如此便完成了上方的趨勢線;亦可透過相同方式,在下方的趨勢線寫入以下相關編碼。
for (int j = i – 1; j >= 0; j–){
if (Close[j] > UPPER[i + 1]){
iEnd = j;
break;
}
}
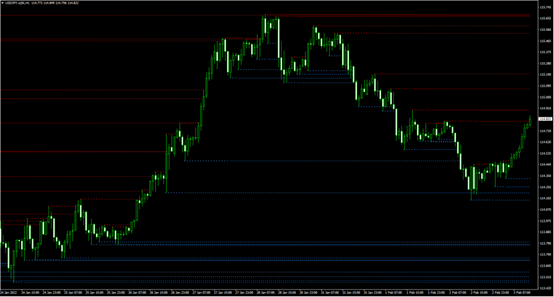
if (Close[i] > LOWER[i + 1]){如此進行編譯,就能延長候補的支撐線與阻力線,變得相當易於使用。
int iEnd = 0;
for (int j = i – 1; j >= 0; j–){
if (Close[j] < LOWER[i + 1]){
iEnd = j;
break;
}
}
TrendCreate(0, PREFIX + “L_” + (string)i, 0, Time[i], LOWER[i + 1], Time[iEnd], LOWER[i + 1], clrDodgerBlue, STYLE_DOT);
}
原始碼
本次製作的原始碼如以下所示。//+——————————————————————+
//| FractalsLine.mq4 |
//| Copyright 2021, MetaQuotes Software Corp. |
//| https://www.mql5.com |
//+——————————————————————+
#property copyright “Copyright 2021, MetaQuotes Software Corp.”
#property link “https://www.mql5.com”
#property version “1.00”
#property strict
#property indicator_chart_window
#property indicator_buffers 2
#property indicator_plots 2
//— plot UPPER
#property indicator_label1 “UPPER”
#property indicator_type1 DRAW_ARROW
#property indicator_color1 clrRed
#property indicator_style1 STYLE_SOLID
#property indicator_width1 1
//— plot LOWER
#property indicator_label2 “LOWER”
#property indicator_type2 DRAW_ARROW
#property indicator_color2 clrDodgerBlue
#property indicator_style2 STYLE_SOLID
#property indicator_width2 1
#define PREFIX “FractalsLine_”
//— input parameters
input int BARS = 1000;
//— indicator buffers
double UPPER[];
double LOWER[];
//+——————————————————————+
//| Custom indicator initialization function |
//+——————————————————————+
int OnInit()
{
//— indicator buffers mapping
SetIndexBuffer(0, UPPER);
SetIndexBuffer(1, LOWER);
//— setting a code from the Wingdings charset as the property of PLOT_ARROW
SetIndexArrow(0, 158);
SetIndexArrow(1, 158);
//—
return(INIT_SUCCEEDED);
}
//+——————————————————————+
//| Custom indicator deinitialization function |
//+——————————————————————+
void OnDeinit(const int reason)
{
ObjectsDeleteAll(0, PREFIX);
}
//+——————————————————————+
//| Custom indicator iteration function |
//+——————————————————————+
int OnCalculate(const int rates_total,
const int prev_calculated,
const datetime &time[],
const double &open[],
const double &high[],
const double &low[],
const double &close[],
const long &tick_volume[],
const long &volume[],
const int &spread[])
{
//—
ObjectsDeleteAll(0, PREFIX);
for (int i = MathMin(Bars – 2, BARS); i >= 0; i–) {
double fr_U = iFractals(NULL, 0, MODE_UPPER, i);
double fr_L = iFractals(NULL, 0, MODE_LOWER, i);
if (fr_U != 0) {
UPPER[i] = fr_U;
if (Close[i] < UPPER[i + 1]){
int iEnd = 0;
for (int j = i – 1; j >= 0; j–){
if (Close[j] > UPPER[i + 1]){
iEnd = j;
break;
}
}
TrendCreate(0, PREFIX + “U_” + (string)i, 0, Time[i], UPPER[i + 1], Time[iEnd], UPPER[i + 1], clrRed, STYLE_DOT);
}
} else if (Close[i] < UPPER[i + 1]) UPPER[i] = UPPER[i + 1];
if (fr_L != 0) {
LOWER[i] = fr_L;
if (Close[i] > LOWER[i + 1]){
int iEnd = 0;
for (int j = i – 1; j >= 0; j–){
if (Close[j] < LOWER[i + 1]){
iEnd = j;
break;
}
}
TrendCreate(0, PREFIX + “L_” + (string)i, 0, Time[i], LOWER[i + 1], Time[iEnd], LOWER[i + 1], clrDodgerBlue, STYLE_DOT);
}
} else if (Close[i] > LOWER[i + 1]) LOWER[i] = LOWER[i + 1];
}
//— return value of prev_calculated for next call
return(rates_total);
}
//+——————————————————————+
//| Create a trend line by the given coordinates |
//+——————————————————————+
bool TrendCreate(const long chart_ID = 0, // chart’s ID
const string name = “TrendLine”, // line name
const int sub_window = 0, // subwindow index
datetime time1 = 0, // first point time
double price1 = 0, // first point price
datetime time2 = 0, // second point time
double price2 = 0, // second point price
const color clr = clrRed, // line color
const ENUM_LINE_STYLE style = STYLE_SOLID, // line style
const int width = 1, // line width
const bool back = false, // in the background
const bool selection = false, // highlight to move
const bool ray_right = false, // line’s continuation to the right
const bool hidden = true, // hidden in the object list
const long z_order = 0) // priority for mouse click
{
//— create a trend line by the given coordinates
if(!ObjectCreate(chart_ID, name, OBJ_TREND, sub_window, time1, price1, time2, price2)) {
return(false);
}
//— set line color
ObjectSetInteger(chart_ID, name, OBJPROP_COLOR, clr);
//— set line display style
ObjectSetInteger(chart_ID, name, OBJPROP_STYLE, style);
//— set line width
ObjectSetInteger(chart_ID, name, OBJPROP_WIDTH, width);
//— display in the foreground (false) or background (true)
ObjectSetInteger(chart_ID, name, OBJPROP_BACK, back);
//— enable (true) or disable (false) the mode of moving the line by mouse
//— when creating a graphical object using ObjectCreate function, the object cannot be
//— highlighted and moved by default. Inside this method, selection parameter
//— is true by default making it possible to highlight and move the object
ObjectSetInteger(chart_ID, name, OBJPROP_SELECTABLE, selection);
ObjectSetInteger(chart_ID, name, OBJPROP_SELECTED, selection);
//— enable (true) or disable (false) the mode of continuation of the line’s display to the right
ObjectSetInteger(chart_ID, name, OBJPROP_RAY_RIGHT, ray_right);
//— hide (true) or display (false) graphical object name in the object list
ObjectSetInteger(chart_ID, name, OBJPROP_HIDDEN, hidden);
//— set the priority for receiving the event of a mouse click in the chart
ObjectSetInteger(chart_ID, name, OBJPROP_ZORDER, z_order);
//— successful execution
return(true);
}
//+——————————————————————+
將EA自動程式交易應用於外匯與差價合約交易中

我們以圖文形式詳細介紹有關EA自動程式交易的基本知識,以及在MT4/MT5平台上的安裝、參數設定方法、編碼等等內容。另外,對持有OANDA帳戶的客戶,還可以免費使用我們的獨有EA與指標工具。