製作顯示不同顏色K線的自動交易程式
登錄實體用與影線用的緩衝器
本文將介紹如何顯示有色的K線。具體來說,將利用稱為直方圖(HISTOGRAM)的柱狀圖指標來為K線上色。由於K線的實體與影線粗細不同,因此需搭配1對實體用以及1對影線用的直方圖,以四個緩衝器來顯示K線。
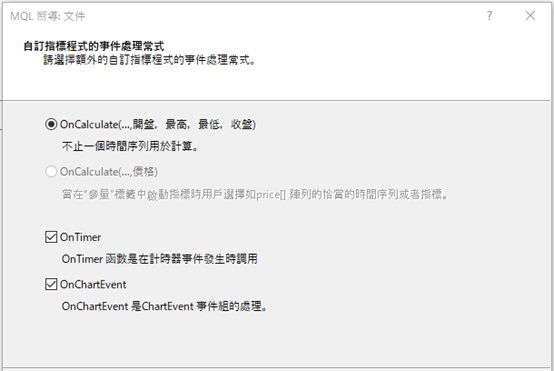
首先,在製作新檔案時選擇「自訂指標」,並將檔案命名為「FlowCandle」。無需新增參數即可進入下一步,在「客製化指標的事件處理程序」中點選「OnTimer」與「OnChartEvent」。
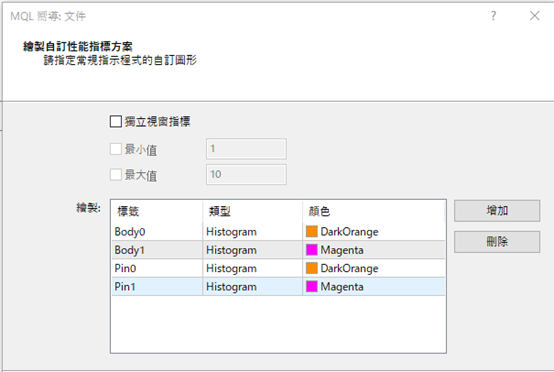
此處指標用的兩個緩衝器將作為1組合拉出1條線,因此在「繪製自訂性能指標方案」設定中,登錄實體以及影線用的緩衝器共計四個。
●第一個是實體用,標籤為「Body0」、樣式為「Histogram」、顏色為「DarkOrange」。
●第二個是與實體Body0配對用,標籤為「Body1」、樣式為「Histogram」、顏色為「Magenta」。
●第三個是影線用,標籤為「Pin0」、樣式為「Histogram」、顏色為「DarkOrange」。
●第四個是與影線Pin0配對用,標籤為「Pin1」、樣式為「Histogram」、顏色為「Magenta」。如此點擊「完成」即可呈現雛形。
另外,將Histogram配對使用時,務必先將最初的緩衝器定義為偶數(若將緩衝器編號設定為1與2等、最初的緩衝器編號為奇數,將無法辨識為一對)。
警示與計時器宣告
開啟新檔案時,將改變上方的屬性。將「Body0」與「Body1」的寬度(width)從「1」改成「2」。#property indicator_label1 “Body0”另外,由於緩衝器的名稱過長,可如「Body0Buffer」→「Body0」、將「Buffer」省略予以縮短。
#property indicator_type1 DRAW_HISTOGRAM
#property indicator_color1 clrDarkOrange
#property indicator_style1 STYLE_SOLID
#property indicator_width1 2
//--- plot Body1
#property indicator_label2 “Body1”
#property indicator_type2 DRAW_HISTOGRAM
#property indicator_color2 clrFuchsia
#property indicator_style2 STYLE_SOLID
#property indicator_width2 2
double Body0[];同樣地,用於 OnInit函數中的緩衝器名稱也能如下所示來變更。
double Body1[];
double Pin0[];
double Pin1[];
SetIndexBuffer(0, Body0);此處將製作警示條件,並依據警示來切換顯示與隱藏,故應在「double Pin1[];」下方宣告「ALERT」。
SetIndexBuffer(1, Body1);
SetIndexBuffer(2, Pin0);
SetIndexBuffer(3, Pin1);
bool ALERT;另外,如欲移動使用計時器函數的有色K線,便應設定以0.01秒為單位的計時器。
在OnInit函數內宣告「EventSetMillisecondTimer」。此EventSetMillisecondTimer是可依照括弧內指定秒數來重複計算的函數。單位設定毫秒,輸入「10」即可呈現0.01的間隔。
EventSetMillisecondTimer(10);如欲使用計時器,便須一併設定刪除計時器的處理過程。
在「Custom indicator initialization function」下方設定「Custom indicator deinitialization function」,使用OnDeinit函數宣告刪除計時器的「EventKillTimer」。
void OnDeinit(const int reason)接下來,將在點擊圖表時啟動或關閉警示。在OnChartEvent函數下方新增下列編碼。
{
EventKillTimer();
}
if (id == CHARTEVENT_CLICK){
if (!ALERT) ALERT = true;
else ALERT = false;
}
寫入OnTimer函數的處理過程
目前已說明了如何登錄實體K線與影線用的緩衝器、以及宣告警示與計時器的方法。接下來將寫入OnTimer函數的處理過程。首先,透過將序列以指定數值進行初始化的「ArrayInitialize」,使四個緩衝器每次都可重設。
ArrayInitialize(Body0, EMPTY_VALUE);接下來,當警示為ON時,在顯示圖表的範圍內執行處理過程。
ArrayInitialize(Body1, EMPTY_VALUE);
ArrayInitialize(Pin0, EMPTY_VALUE);
ArrayInitialize(Pin1, EMPTY_VALUE);
以「CHART_FIRST_VISIBLE_BAR」取得圖表左邊的K線,並自該處減去顯示圖表所有K線數的「CHART_WIDTH_IN_BARS」,如此便會得出右邊的數值。若該計算結果為負數,就會呈現「0」。
以「barF - barR」定義顯示範圍的K線數量,上色範圍為整體的四分之一。
if (ALERT) {
int barF = (int)ChartGetInteger(0, CHART_FIRST_VISIBLE_BAR);
int barR = barF - (int)ChartGetInteger(0, CHART_WIDTH_IN_BARS);
if (barR < 0) barR = 0;
int width = barF - barR;
int len = width / 4;
從圖表右邊為指定K線數量上色
接下來,將使用for文體,從圖表右邊為指定K線數量上色。此處將Body0作為實體的高點、因此開盤價與收盤價中較高的一方,Body1則是實體的低點、因此開盤價與收盤價中較低的一方。同樣地,影線的Pin0為高點、Pin1則是低點。for (int i = barR; i < barR + len; i++) {若直接為K線上色將會出現時間差,為了避免這樣的狀況發生,必須在除去for文體的位置添加「ChartRedraw」,以利再度進行圖表繪製。
Body0[i] = MathMax(Open[i], Close[i]);
Body1[i] = MathMin(Open[i], Close[i]);
Pin0[i] = High[i];
Pin1[i] = Low[i];
}
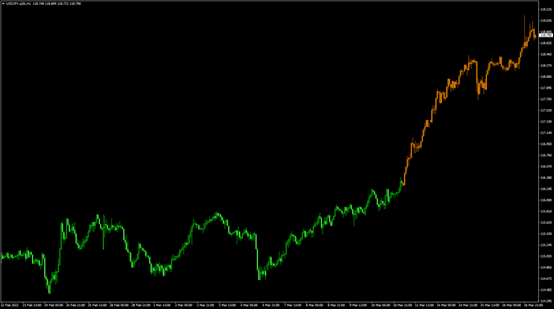
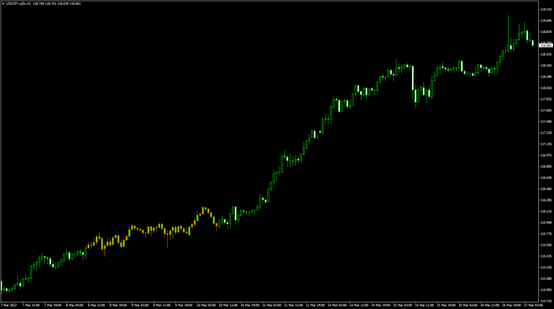
ChartRedraw();如此進行編譯、設定圖表,並點擊圖表,就會看見右邊開始四分之一範圍的K線塗上了橘色。另外,每次點擊圖表,都會在有色及無色的狀態之先來回切換。
利用計時器來移動有色K線
本次將利用計時器來移動有色K線。為了使起點置於左邊的K線,將修改for文體。另外,為了移動位置,也將變更為可計算的模式。如此便能將K線的色彩從左邊移至右邊。
接著,當「barF + len - count」數值小於0時,應新增if文體來重設計算過程。由於屆時「i」將變成負數,因此只需在正數的狀況下執行。
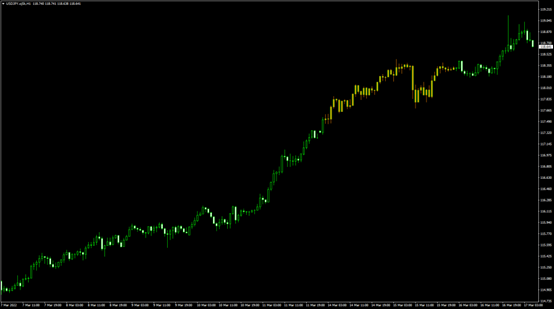
static int count;如此進行編譯並點擊圖表,K線的色彩便會從左邊移至右邊。
for (int i = barF - count; i < barF + len - count; i++) {
if (i >= 0) {
Body0[i] = MathMax(Open[i], Close[i]);
Body1[i] = MathMin(Open[i], Close[i]);
Pin0[i] = High[i];
Pin1[i] = Low[i];
}
}
count++;
if(barF + len - count <=0) count = 0;
ChartRedraw();
新增不同的顏色
接下來,將顯示不同顏色的多1個系統。首先定義從「i」減去「width + len」一半長度的「j」。若此為負數,便加上width + len的長度。
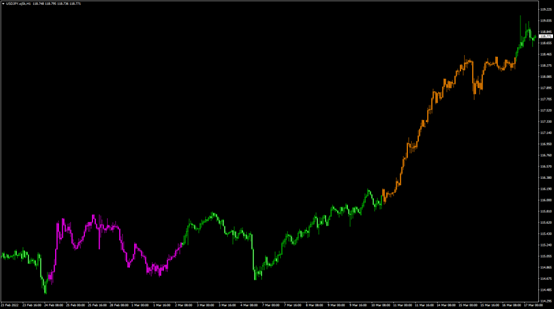
int j = i - (width + len) / 2;接著同樣利用j顯示上色。為了改變顏色, 將Body0與Body1的「Max」與「Min」分別替換成Pin0與Pin1的「High」與「Low」。切換高價與低價時顏色將會改變,此與 MT4標準的平均K線特性相同。
if (j < 0) j += width + len;
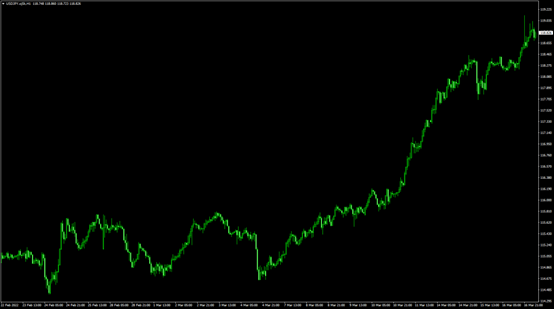
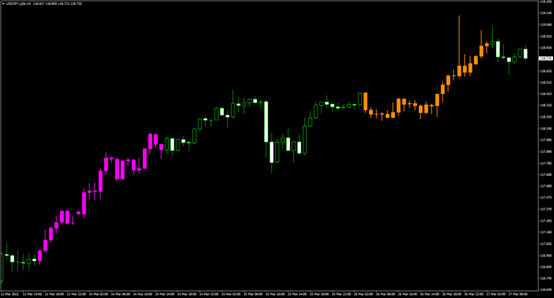
if (j >= 0) {如此進行編譯,橘色與紫色就會如同追逐一般自左至右移動。
Body0[j] = MathMin(Open[j], Close[j]);
Body1[j] = MathMax(Open[j], Close[j]);
Pin0[j] = High[j];
Pin1[j] = Low[j];
}
配合K線的寬度顯示顏色
當擴大顯示圖表時,上色的實體寬度將不會隨之變化,因此需修正使其配合圖表一同放大。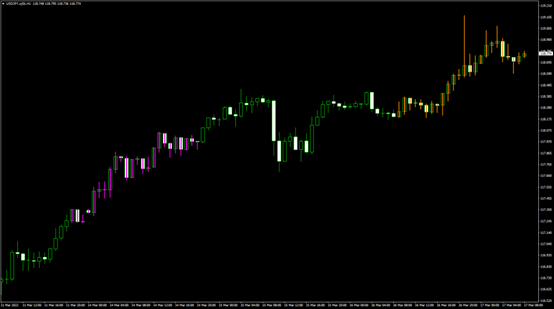
應添加修正的位置於OnChartEvent函數之下。本次使用switch文體來區分條件。在Switch後方括弧輸入「條件公式」,只要符合該公式的數值,便會移至 case處進行處理。
確認圖表的範圍,使有色的寬度隨著該數值一同變化。範圍共有0~5等6個階段。範圍若為「0」或「1」時、寬度就變更為「1」,範圍若為「2」時、寬度就變更為「2」,範圍若為「3」時、寬度就變更為「3」,範圍若為「4」時、寬度就變更為「6」,範圍若為「5」時、寬度就變更為「13」。
if (id == CHARTEVENT_CHART_CHANGE) {接著利用「SetIndexStyle」,使樣式在寬度改變持維持原樣。透過添加下列編碼,能夠指定0號與1號的緩衝器。
int width = 0;
switch ((int)ChartGetInteger(0, CHART_SCALE)) {
case 0 :
case 1 :
width = 1;
break;
case 2 :
width = 2;
break;
case 3 :
width = 3;
break;
case 4 :
width = 6;
break;
case 5 :
width = 13;
break;
}
SetIndexStyle(0, DRAW_HISTOGRAM, EMPTY, width);如此進行編譯並試著放大圖表,將可見到有色部分隨著K線寬度一同改變。
SetIndexStyle(1, DRAW_HISTOGRAM, EMPTY, width);
原始碼
本次製作的原始碼如以下所示。//+------------------------------------------------------------------+
//| FlowCandle.mq4 |
//| Copyright 2022, MetaQuotes Software Corp. |
//| https://www.mql5.com |
//+------------------------------------------------------------------+
#property copyright “Copyright 2022, MetaQuotes Software Corp.”
#property link “https://www.mql5.com”
#property version “1.00”
#property strict
#property indicator_chart_window
#property indicator_buffers 4
#property indicator_plots 4
//--- plot Body0
#property indicator_label1 “Body0”
#property indicator_type1 DRAW_HISTOGRAM
#property indicator_color1 clrDarkOrange
#property indicator_style1 STYLE_SOLID
#property indicator_width1 2
//--- plot Body1
#property indicator_label2 “Body1”
#property indicator_type2 DRAW_HISTOGRAM
#property indicator_color2 clrFuchsia
#property indicator_style2 STYLE_SOLID
#property indicator_width2 2
//--- plot Pin0
#property indicator_label3 “Pin0”
#property indicator_type3 DRAW_HISTOGRAM
#property indicator_color3 clrDarkOrange
#property indicator_style3 STYLE_SOLID
#property indicator_width3 1
//--- plot Pin1
#property indicator_label4 “Pin1”
#property indicator_type4 DRAW_HISTOGRAM
#property indicator_color4 clrFuchsia
#property indicator_style4 STYLE_SOLID
#property indicator_width4 1
//--- indicator buffers
double Body0[];
double Body1[];
double Pin0[];
double Pin1[];
bool ALERT;
//+------------------------------------------------------------------+
//| Custom indicator initialization function |
//+------------------------------------------------------------------+
int OnInit()
{
//--- indicator buffers mapping
SetIndexBuffer(0, Body0);
SetIndexBuffer(1, Body1);
SetIndexBuffer(2, Pin0);
SetIndexBuffer(3, Pin1);
EventSetMillisecondTimer(10);
//---
return(INIT_SUCCEEDED);
}
//+------------------------------------------------------------------+
//| Custom indicator deinitialization function |
//+------------------------------------------------------------------+
void OnDeinit(const int reason)
{
EventKillTimer();
}
//+------------------------------------------------------------------+
//| Custom indicator iteration function |
//+------------------------------------------------------------------+
int OnCalculate(const int rates_total,
const int prev_calculated,
const datetime &time[],
const double &open[],
const double &high[],
const double &low[],
const double &close[],
const long &tick_volume[],
const long &volume[],
const int &spread[])
{
//---
//--- return value of prev_calculated for next call
return(rates_total);
}
//+------------------------------------------------------------------+
//| Timer function |
//+------------------------------------------------------------------+
void OnTimer()
{
//---
ArrayInitialize(Body0, EMPTY_VALUE);
ArrayInitialize(Body1, EMPTY_VALUE);
ArrayInitialize(Pin0, EMPTY_VALUE);
ArrayInitialize(Pin1, EMPTY_VALUE);
if (ALERT) {
int barF = (int)ChartGetInteger(0, CHART_FIRST_VISIBLE_BAR);
int barR = barF - (int)ChartGetInteger(0, CHART_WIDTH_IN_BARS);
if (barR < 0) barR = 0;
int width = barF - barR;
int len = width / 4;
static int count;
for (int i = barF - count; i < barF + len - count; i++) {
if (i >= 0) {
Body0[i] = MathMax(Open[i], Close[i]);
Body1[i] = MathMin(Open[i], Close[i]);
Pin0[i] = High[i];
Pin1[i] = Low[i];
}
int j = i - (width + len) / 2;
if (j < 0) j += width + len;
if (j >= 0) {
Body0[j] = MathMin(Open[j], Close[j]);
Body1[j] = MathMax(Open[j], Close[j]);
Pin0[j] = Low[j];
Pin1[j] = High[j];
}
}
count++;
if(barF + len - count <=0) count = 0;
ChartRedraw();
}
}
//+------------------------------------------------------------------+
//| ChartEvent function |
//+------------------------------------------------------------------+
void OnChartEvent(const int id,
const long &lparam,
const double &dparam,
const string &sparam)
{
//---
if (id == CHARTEVENT_CHART_CHANGE) {
int width = 0;
switch ((int)ChartGetInteger(0, CHART_SCALE)) {
case 0 :
case 1 :
width = 1;
break;
case 2 :
width = 2;
break;
case 3 :
width = 3;
break;
case 4 :
width = 6;
break;
case 5 :
width = 13;
break;
}
SetIndexStyle(0, DRAW_HISTOGRAM, EMPTY, width);
SetIndexStyle(1, DRAW_HISTOGRAM, EMPTY, width);
}
if (id == CHARTEVENT_CLICK) {
if (!ALERT) ALERT = true;
else ALERT = false;
}
}
將EA自動程式交易應用於外匯與差價合約交易中

我們以圖文形式詳細介紹有關EA自動程式交易的基本知識,以及在MT4/MT5平台上的安裝、參數設定方法、編碼等等內容。另外,對持有OANDA帳戶的客戶,還可以免費使用我們的獨有EA與指標工具。