如何計算移動平均線角度並將其顯示於圖表上的方法
登錄移動平均線用的緩衝器
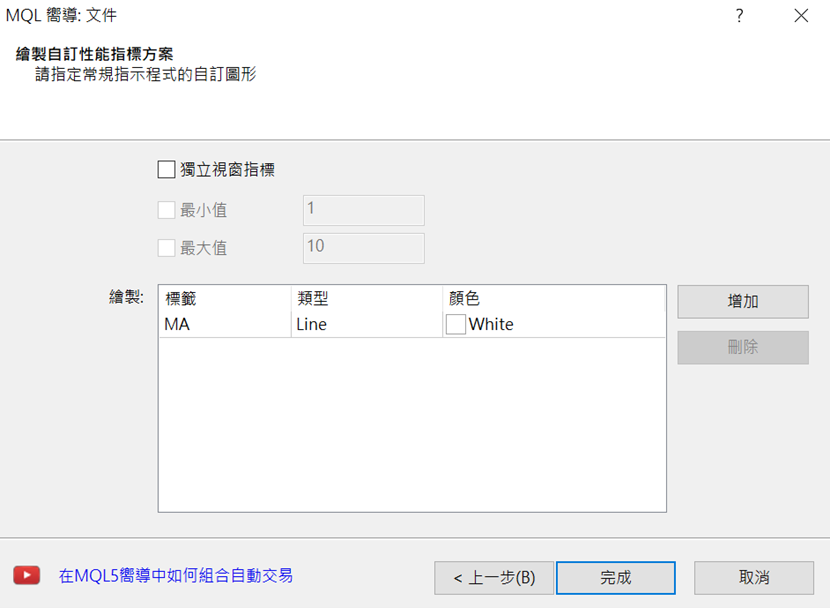
在本篇章節中,將說明如何計算移動平均線角度並顯示於圖表中。首先,在製作新檔案中選擇「自訂指標」,並將檔案名稱命名為「MA_angle」。由於本次將使用「OnChartEvent」,因此在「自訂指標程式的事件處理常式」畫面中,僅勾選「OnChartEvent」並進入下一步登錄移動平均線用的緩衝器。標籤設定為「MA」、樣式為「Line」、顏色為「White」後點擊「完成」即是雛形。
定義接頭辭以利刪除物件
首先,由於緩衝器名稱略嫌冗長,因此將「MABuffer」變更為「MA」。double MA[];因本次將使用到物件,故為了能夠一次進行刪除,應先登錄接頭辭;在檔案上方的屬性「#property indicator_width1 1」下方,將「PREFIX」如以下所示加以定義。
SetIndexBuffer(0,MA);
#define PREFIX “MA_angle_”另外,在「Custom indicator initialization function」下方設定「Custom indicator deinitialization function」,並寫入使用OnDeinit函數的以下編碼。
void OnDeinit(const int reason)接下來,在OnCalculate函數下寫入移動平均線的繪製公式。此處為假設繪製,故將省略詳細說明; 可使用for文體,如以下所示進行編寫。
{
ObjectsDeleteAll(0, PREFIX);
}
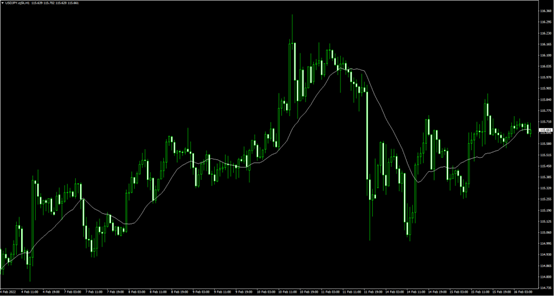
int limit = Bars – prev_calculated – 1;若進行編譯並設定圖表,即可看見白色的移動平均線。
if (limit < 1) limit = 1;
for (int i = limit; i >= 0; i–)
MA[i] = iMA(NULL, 0, 20, 0, MODE_SMA, PRICE_CLOSE, i);
取得游標位置的移動平均線資訊
接下來將製作程式,以檢測游標的位置,並計算該處的移動平均線角度。為了檢測游標的位置,需在「ChartSetInteger」使用「CHART_EVENT MOUSE_MOVE」進行宣言。在OnInit函數下的「SetIndexBuffer(0,MA);」下方,如以下所示寫入編碼。
ChartSetInteger(0, CHART_EVENT_MOUSE_MOVE, true);接著,在OnChartEvent函數旗下寫入移動滑鼠的處理動作。首先以「ChartXYToTimePrice」,將游標的XY座標變更為價格與時間資訊。X座標為「lparam」、Y座標為「dparam」。取得游標位置的時間之後,以「iBarShift」取得該時間的K線數量與位置。
if (id == CHARTEVENT_MOUSE_MOVE) {其後,將取得該游標位置的移動平均線資訊。具體來說,應取得移動平均線的2個點,並從該處得出角度。使用將圖表時間與價格變更為XY座標的「ChartTimePriceToXY」,第1點為K線位置,故寫入x[0]與y[0] ;第2點為前一個點,因此依樣寫入x[1]與y[1] 。
datetime time;
double price;
int win = 0;
ChartXYToTimePrice(0, (int)lparam, (int)dparam, win, time, price);
int bar = iBarShift(NULL, 0, time);
int x[2], y[2];如此即可取得2個點。
ChartTimePriceToXY(0, 0, Time[bar], MA[bar], x[0], y[0]);
ChartTimePriceToXY(0, 0, Time[bar + 1], MA[bar + 1], x[1], y[1]);
從移動平均線的2點資訊計算角度
接下來,將利用已取得的移動平均線2點來計算角度。角度計算將在x[0]與x[1]不一致時進行,而計算公式如以下畫面所示。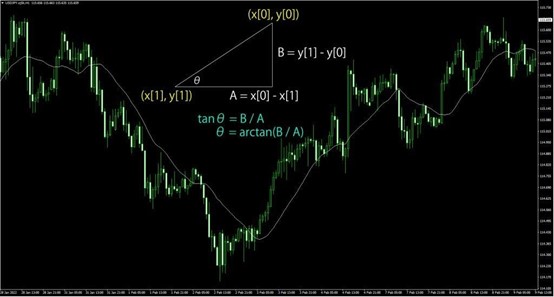
先前取得的2點即為黃色座標。為了算出角度,應先求出三角形底邊A的長度以及B的高度;而由於tanθ為A分之B,故能以「arctan(B/A)」來計算角度。
此處所運用的函數,為可返回指定數值arctan(反正切)的「MathArctan」;此函數所得出的答案,會以「弧度」為單位,故若希望轉換為計算的單位「次」,便須乘以180並除以π(MT4的M_PI等同於π)。
double angle = 90;如此便能夠得出角度。另外,X座標與Y座標的減法算式中,「1」與「0」將呈現顛倒,此原因在於座標的標準點位於左上方,故Y座標越往下、則數值會越發增加。
if (x[0] != x[1]) angle = MathArctan(double(y[1] – y[0]) / (x[0] – x[1])) * 180 / M_PI;
設定Label物件
方才已說明了如何利用移動平均線的2點資訊來計算角度;其次,將嘗試運用Label物件,把計算結果顯示於圖表中。此處會從MQL4幫助檔中,複製Label物件的樣本編碼並加以運用。點擊MQL4幫助檔目錄的「Constants, Enumerations and Structures」→「Objects Constants」→「Object Types」,便會出現物件一覽。
從中選擇「OBJ_LABEL」後,複製預先準備的「Create a text label」編碼,並貼至檔案下方。
首先,刪除不需要的「//— reset the error value」「ResetLastError();」等2行,以及「 Print(__FUNCTION__,」「”: failed to create text label! Error code = “,GetLastError());」2行。
另外,為了使顯示數值能夠改變,在「if(!ObjectCreate(chart_ID,name,OBJ_LABEL,sub_window,0,0)){」下方插入「ObjectSetString(chart_ID,name,OBJPROP_TEXT,text);」;為了使顯示數值能夠改變,則插入「ObjectSetInteger(chart_ID,name,OBJPROP_COLOR,clr);」。
//+——————————————————————+
//| Create a text label |
//+——————————————————————+
bool LabelCreate(const long chart_ID=0, // chart’s ID
const string name=”Label”, // label name
const int sub_window=0, // subwindow index
const int x=0, // X coordinate
const int y=0, // Y coordinate
const ENUM_BASE_CORNER corner=CORNER_LEFT_UPPER, // chart corner for anchoring
const string text=”Label”, // text
const string font=”Arial”, // font
const int font_size=10, // font size
const color clr=clrRed, // color
const double angle=0.0, // text slope
const ENUM_ANCHOR_POINT anchor=ANCHOR_LEFT_UPPER, // anchor type
const bool back=false, // in the background
const bool selection=false, // highlight to move
const bool hidden=true, // hidden in the object list
const long z_order=0) // priority for mouse click
{
//— create a text label
if(!ObjectCreate(chart_ID,name,OBJ_LABEL,sub_window,0,0)){
ObjectSetString(chart_ID,name,OBJPROP_TEXT,text);
ObjectSetInteger(chart_ID,name,OBJPROP_COLOR,clr);
return(false);
}
//— set label coordinates
ObjectSetInteger(chart_ID,name,OBJPROP_XDISTANCE,x);
ObjectSetInteger(chart_ID,name,OBJPROP_YDISTANCE,y);
//— set the chart’s corner, relative to which point coordinates are defined
ObjectSetInteger(chart_ID,name,OBJPROP_CORNER,corner);
//— set the text
ObjectSetString(chart_ID,name,OBJPROP_TEXT,text);
//— set text font
ObjectSetString(chart_ID,name,OBJPROP_FONT,font);
//— set font size
ObjectSetInteger(chart_ID,name,OBJPROP_FONTSIZE,font_size);
//— set the slope angle of the text
ObjectSetDouble(chart_ID,name,OBJPROP_ANGLE,angle);
//— set anchor type
ObjectSetInteger(chart_ID,name,OBJPROP_ANCHOR,anchor);
//— set color
ObjectSetInteger(chart_ID,name,OBJPROP_COLOR,clr);
//— display in the foreground (false) or background (true)
ObjectSetInteger(chart_ID,name,OBJPROP_BACK,back);
//— enable (true) or disable (false) the mode of moving the label by mouse
ObjectSetInteger(chart_ID,name,OBJPROP_SELECTABLE,selection);
ObjectSetInteger(chart_ID,name,OBJPROP_SELECTED,selection);
//— hide (true) or display (false) graphical object name in the object list
ObjectSetInteger(chart_ID,name,OBJPROP_HIDDEN,hidden);
//— set the priority for receiving the event of a mouse click in the chart
ObjectSetInteger(chart_ID,name,OBJPROP_ZORDER,z_order);
//— successful execution
return(true);
}
依據角度大小改變文字顏色
將設定的LabelCreate寫於OnChartEvent函數內;參數的X設定為「5」、Y為「15」、內容為「DoubleToString」的2行、文字字體為「Arial Bold」、大小為「30」。至於文字顏色的設定,則會在LabelCreate上執行;本次將文字顏色設為白色。color clr = clrWhite;另外,如欲在K線尺寸大於MA序列尺寸時停止計算,便應在「int bar = iBarShift(NULL, 0, time);」下方增加以下if文體。
LabelCreate(0, PREFIX + “angle”, 0, 5, 15, CORNER_LEFT_UPPER, DoubleToString(angle, 2), “Arial Bold”, 30, clr);
if (bar > ArraySize(MA) – 2) return;若在此處進行編譯,即會在圖表左上方顯示游標位置的移動平均線角度。
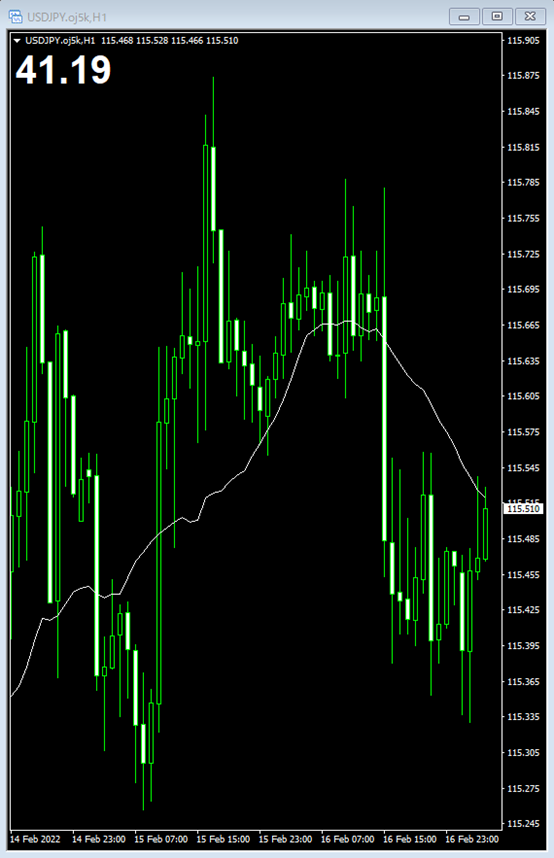
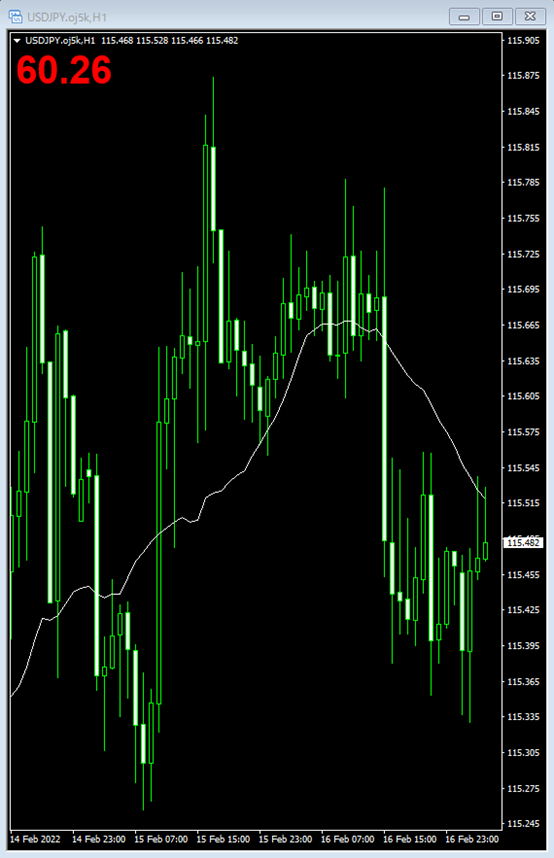
最後,當移動平均線的角度大於45度時,將文字顏色設定為紅色;負45度以下時則是藍色。只要在「color clr = clrWhite;」下方添加下列if文體即可。
if (angle >= 45) clr = clrRed;以此進行編譯之後,當移動平均線角度大於45度、或低於負45度時,只要移動游標,便可看見角度的文字顏色出現改變。
else if (angle <= -45) clr = clrDodgerBlue;
原始碼
本次製作的原始碼如以下所示。//+——————————————————————+
//| MA_angle.mq4 |
//| Copyright 2021, MetaQuotes Software Corp. |
//| https://www.mql5.com |
//+——————————————————————+
#property copyright “Copyright 2021, MetaQuotes Software Corp.”
#property link “https://www.mql5.com”
#property version “1.00”
#property strict
#property indicator_chart_window
#property indicator_buffers 1
#property indicator_plots 1
//— plot MA
#property indicator_label1 “MA”
#property indicator_type1 DRAW_LINE
#property indicator_color1 clrWhite
#property indicator_style1 STYLE_SOLID
#property indicator_width1 1
#define PREFIX “MA_angle_”
//— indicator buffers
double MA[];
//+——————————————————————+
//| Custom indicator initialization function |
//+——————————————————————+
int OnInit()
{
//— indicator buffers mapping
SetIndexBuffer(0, MA);
ChartSetInteger(0, CHART_EVENT_MOUSE_MOVE, true);
//—
return(INIT_SUCCEEDED);
}
//+——————————————————————+
//| Custom indicator deinitialization function |
//+——————————————————————+
void OnDeinit(const int reason)
{
ObjectsDeleteAll(0, PREFIX);
}
//+——————————————————————+
//| Custom indicator iteration function |
//+——————————————————————+
int OnCalculate(const int rates_total,
const int prev_calculated,
const datetime &time[],
const double &open[],
const double &high[],
const double &low[],
const double &close[],
const long &tick_volume[],
const long &volume[],
const int &spread[])
{
//—
int limit = Bars – prev_calculated – 1;
if (limit < 1) limit = 1;
for (int i = limit; i >= 0; i–)
MA[i] = iMA(NULL, 0, 20, 0, MODE_SMA, PRICE_CLOSE, i);
//— return value of prev_calculated for next call
return(rates_total);
}
//+——————————————————————+
//| ChartEvent function |
//+——————————————————————+
void OnChartEvent(const int id,
const long &lparam,
const double &dparam,
const string &sparam)
{
if (id == CHARTEVENT_MOUSE_MOVE) {
datetime time;
double price;
int win = 0;
ChartXYToTimePrice(0, (int)lparam, (int)dparam, win, time, price);
int bar = iBarShift(NULL, 0, time);
if (bar > ArraySize(MA) – 2) return;
int x[2], y[2];
ChartTimePriceToXY(0, 0, Time[bar], MA[bar], x[0], y[0]);
ChartTimePriceToXY(0, 0, Time[bar + 1], MA[bar + 1], x[1], y[1]);
double angle = 90;
if (x[0] != x[1]) angle = MathArctan(double(y[1] – y[0]) / (x[0] – x[1])) * 180 / M_PI;
color clr = clrWhite;
if (angle >= 45) clr = clrRed;
else if (angle <= -45) clr = clrDodgerBlue;
LabelCreate(0, PREFIX + “angle”, 0, 5, 15, CORNER_LEFT_UPPER, DoubleToString(angle, 2), “Arial Bold”, 30, clr);
}
}
//+——————————————————————+
//| Create a text label |
//+——————————————————————+
bool LabelCreate(const long chart_ID = 0, // chart’s ID
const string name = “Label”, // label name
const int sub_window = 0, // subwindow index
const int x = 0, // X coordinate
const int y = 0, // Y coordinate
const ENUM_BASE_CORNER corner = CORNER_LEFT_UPPER, // chart corner for anchoring
const string text = “Label”, // text
const string font = “Arial”, // font
const int font_size = 10, // font size
const color clr = clrRed, // color
const double angle = 0.0, // text slope
const ENUM_ANCHOR_POINT anchor = ANCHOR_LEFT_UPPER, // anchor type
const bool back = false, // in the background
const bool selection = false, // highlight to move
const bool hidden = true, // hidden in the object list
const long z_order = 0) // priority for mouse click
{
//— create a text label
if(!ObjectCreate(chart_ID, name, OBJ_LABEL, sub_window, 0, 0)) {
ObjectSetString(chart_ID, name, OBJPROP_TEXT, text);
ObjectSetInteger(chart_ID, name, OBJPROP_COLOR, clr);
return(false);
}
//— set label coordinates
ObjectSetInteger(chart_ID, name, OBJPROP_XDISTANCE, x);
ObjectSetInteger(chart_ID, name, OBJPROP_YDISTANCE, y);
//— set the chart’s corner, relative to which point coordinates are defined
ObjectSetInteger(chart_ID, name, OBJPROP_CORNER, corner);
//— set the text
ObjectSetString(chart_ID, name, OBJPROP_TEXT, text);
//— set text font
ObjectSetString(chart_ID, name, OBJPROP_FONT, font);
//— set font size
ObjectSetInteger(chart_ID, name, OBJPROP_FONTSIZE, font_size);
//— set the slope angle of the text
ObjectSetDouble(chart_ID, name, OBJPROP_ANGLE, angle);
//— set anchor type
ObjectSetInteger(chart_ID, name, OBJPROP_ANCHOR, anchor);
//— set color
ObjectSetInteger(chart_ID, name, OBJPROP_COLOR, clr);
//— display in the foreground (false) or background (true)
ObjectSetInteger(chart_ID, name, OBJPROP_BACK, back);
//— enable (true) or disable (false) the mode of moving the label by mouse
ObjectSetInteger(chart_ID, name, OBJPROP_SELECTABLE, selection);
ObjectSetInteger(chart_ID, name, OBJPROP_SELECTED, selection);
//— hide (true) or display (false) graphical object name in the object list
ObjectSetInteger(chart_ID, name, OBJPROP_HIDDEN, hidden);
//— set the priority for receiving the event of a mouse click in the chart
ObjectSetInteger(chart_ID, name, OBJPROP_ZORDER, z_order);
//— successful execution
return(true);
}
//+——————————————————————+
將EA自動程式交易應用於外匯與差價合約交易中

我們以圖文形式詳細介紹有關EA自動程式交易的基本知識,以及在MT4/MT5平台上的安裝、參數設定方法、編碼等等內容。另外,對持有OANDA帳戶的客戶,還可以免費使用我們的獨有EA與指標工具。