How to use the MACD in your trading strategy?
The MACD can help traders identify significant changes in momentum and market sentiment, providing signals for entering and exiting a trade.
The MACD can help traders identify significant changes in momentum and market sentiment, providing signals for entering and exiting a trade.

Moving Average Convergence Divergence (MACD)
The MACD indicator (or oscillator) is regarded by thousands of traders all around the world as one of the best indicators for identifying trends and reversals. It gives you a visual representation of the ups and downs in price action as influenced by market volatility. The idea being that, once the indicator has signalled a significant change in market behavior, turning from bullish to bearish, or vice versa, you have a potential entry or exit for your trade.
When you apply the indicator to your chart you’ll see two lines running alongside each other and oscillating above and below a zero horizontal line. The blue line (the MACD line) is not just a moving average, it is in fact the result of a calculation between two different exponential moving averages. If you were to use the default settings for the indicator, that calculation would come from subtracting the 12 exponential average from the 26 exponential moving average. The second component is the signal line which, for the default settings, is calculated by taking a 9-period exponential moving average of the MACD line itself. Or, put another way, it’s a reading of an average of the last 9 values of the MACD line. This results in the signal line being a slightly slower, more smoothed out version of the MACD line.
On top of this we have the histogram. This part of the indicator shows you the strength of the price move and can serve as an early warning to get ready for a signal. The deeper or higher the lines are, the stronger the move in price. When the lines are above the zero horizontal, the market can be said to be bullish, and when they are below, we are in bearish mode. When the signal line crosses the MACD line, the indicator is said to be generating a potential buy or sell signal.
MACD trading strategy
The MACD strategy in its most basic form involves using the crossing of the signal line as your entry or exit point for a trade. Although this approach can deliver profitable results in many cases, the MACD’s signal can often fail. This can happen, for instance, when the MACD line and signal line cross over one another multiple times. If you took an entry every time they crossed, you would quickly lose a bunch of trades in a row. This is why so many traders prefer to combine the MACD with another form of market analysis.
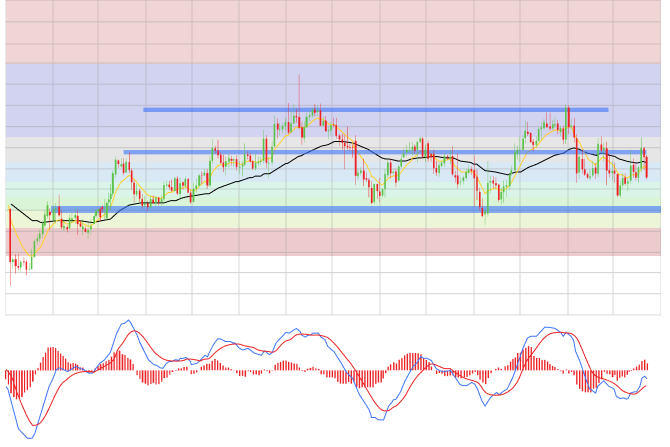
In the example below, we can see how useful it is to map out areas of support and resistance as we consider the validity of the MACD signals. Clearly, when price hits a strong area of support we can be more confident that the MACD’s signal is reliable. If you look at the last move up, you can see the MACD gives us a buy signal, but as price nears an area of resistance it flips to the downside. If you hadn’t drawn in the zone of resistance, but you’d opened a buy trade, you would have run into a strong, engulfing red candle.
The MACD and divergence
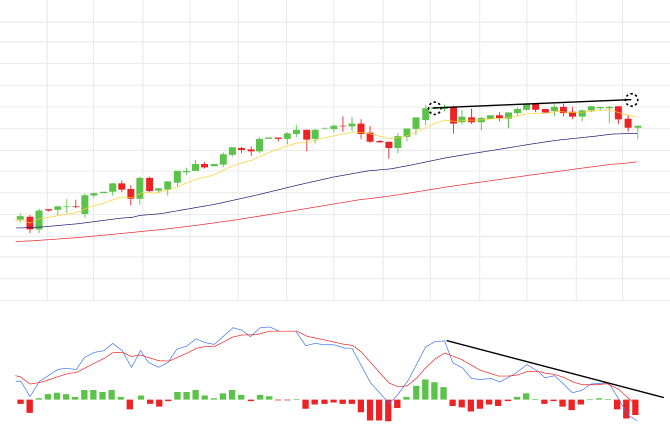
Many professional traders ignore the price signals created by the crossover and only use the MACD in conjunction with divergence. So what they are looking for is:
a/ a period of decreasing momentum as price rises and
b/ a period of increasing momentum as price falls
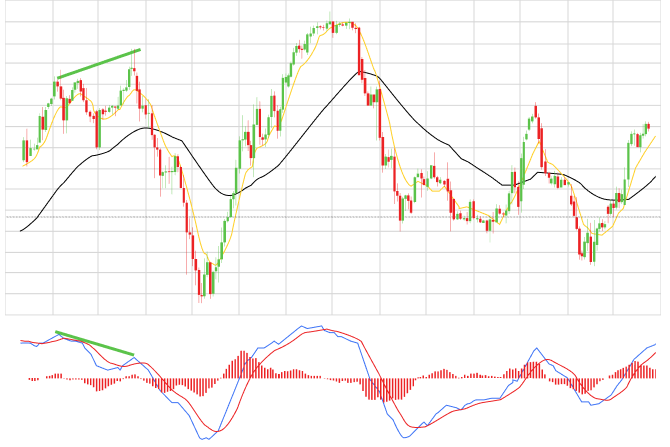
How to spot this divergence? Let’s take an example. The chart below shows pound sterling in an uptrend against the Japanese yen. To the left of the chart you’ll see a double top forming, where the second top is higher than the first. However, if you look directly below to the MACD, you’ll see momentum is weakening. So even though price is climbing we can see from the divergence between price and momentum, that we can anticipate a move to the downside. And in fact, shortly after the bears regain control, the red line crosses the blue line and sinks below the horizontal line; price crashes through the 50 EMA and retraces hard.
So we can see that when momentum fails, doubt tends to set in, sometimes rapidly, and the switch in sentiment brings about a reversal. Generally speaking, the higher the timeframe you are looking at, the bigger the reversal.
Three things to bear in mind when using the MACD
Here are some cautionary measures to keep in mind whenever you rely on the MACD for your trading decisions:
Different timeframes and fake signals. You’ll notice that the MACD can sometimes give you a trading signal on a 15-minute chart which looks dubious at best on a 4-hour chart. Be sure to identify areas of support and resistance prior to taking a signal and be aware that the signal can suddenly flip in the other direction and fail just as you were beginning to rely on it. You might also like to incorporate moving averages into your strategy so you have further confluence. Which timeframes you use really depends on your trading style, but generally speaking the 30-minute time frame works best with the MACD - after you’ve checked the higher time frames for governing price patterns.
MACD settings. Many professional traders find the default settings (12, 26 and 9) to be too slow, causing late entry and exit to and from a trade. You may want to customize/ format the settings and see how well they perform on a demo account. Some alternative settings to try are:
8, 21, 5
3, 17, 5
3, 10, 16
What you’re looking for is to see how close the crossover signal matches with the reversal on your chart. The best thing to do is to experiment on OANDA’s demo account to find out which settings work best for the instruments you like to trade. Then you can apply them to your live account with greater confidence in your MACD strategy.
Double tops and double bottoms. These patterns typically form at the end of a strong push up or down in the market. So, if price has climbed at speed, with little resistance, but then hits an area of resistance and starts to drop, because the move has been made with strong momentum, it is highly probable price will drop only to head back up to retest the area of resistance. Your MACD will be showing you a trade signal as price descends, but you would do well to wait and see if price makes a double top or, in a bearish environment, a double bottom, before placing your trade.
Key takeaways
- The MACD indicator (or oscillator) is one of the best indicators for identifying trends and reversals in the financial markets
- The MACD strategy in its most basic form involves using the crossing of the smoothed out signal line over the MACD line as your entry or exit point for a trade
- The MACD works best when used in conjunction with support and resistance and moving averages as MACD signals often fail especially in choppy market conditions
- The MACD is often used purely to identify divergence in the market, when price diverges from momentum warning traders of an imminent reversal.
- Many professional traders find the default settings (12, 26 and 9) to be too slow, causing late entry and exit to and from a trade. You may want to customize/ format the settings and see how well they perform on a demo account.
Difference between leveraged and other forms of financial trading.
expand_less expand_moreUse fundamental analysis to your advantage.
expand_less expand_moreHow is technical analysis different from fundamental analysis?
expand_less expand_moreHow to build a robust trading strategy using indicators and oscillators.
expand_less expand_more